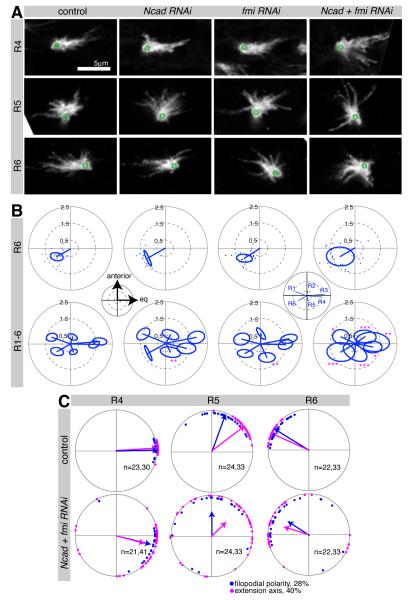
Figure 5. R cell growth cones in Ncad fmi subset knockdown have polarity defects.
Ncad and fmi single or double knockdown in an R cell subset using R25B08-Gal4 mδ-Gal80. Single R cells were labeled by GFPmyr at 28% apf. (A) R4-R6 growth cones displayed polarity defects in Ncad + fmi RNAi; ventral hemisphere of lamina, anterior up, equator to the right; green circles denote position of axon shaft. (B) Polar plots display the mean polarity vectors for each growth cone subtype, with the standard ellipse (see Extended Experimental Procedures). For R6 growth cones, polarity vector endpoints are shown as one dot per growth cone. Subset loss of Ncad and fmi resulted in a larger spread of polarity angles and thus an increased standard ellipse for the population. Insets show spatial coordinates and identity of growth cones. *p<0.05; **p<0.01; ***p<0.001 compared to control; testing for differences in the long axis of the standard ellipse using Bootstrap with Z-test and adjustment for multiple comparisons; n=17-27. (C) Polar plots of wild-type and Ncad fmi double mutants. Plots for R4-R6 with growth cone polarity angles at 28% (blue) and growth cone extension angle at 40% apf (magenta), are shown. For plots of R1-R3 see Figure S5.

