

Abstract
Reference broth microdilution methods of Candida echinocandin susceptibility testing are limited by interlaboratory variability in caspofungin MICs. Recently revised Clinical and Laboratory Standards Institute (CLSI) breakpoint MICs for echinocandin nonsusceptibility may not be valid for commercial tests employed in hospital laboratories. Indeed, there are limited echinocandin susceptibility testing data from hospital laboratories. We conducted a multicenter retrospective study of 9 U.S., Australian, and New Zealand hospitals that routinely tested Candida bloodstream isolates for echinocandin susceptibility from 2005 to 2013. Eight hospitals used Sensititre YeastOne assays. The Candida spp. were C. albicans (n = 1,067), C. glabrata (n = 911), C. parapsilosis (n = 476), C. tropicalis (n = 185), C. krusei (n = 104), and others (n = 154). Resistance and intermediate rates were ≤1.4% and ≤3%, respectively, for each echinocandin against C. albicans, C. parapsilosis, and C. tropicalis. Resistance rates among C. glabrata and C. krusei isolates were ≤7.5% and ≤5.6%, respectively. Caspofungin intermediate rates among C. glabrata and C. krusei isolates were 17.8% and 46.5%, respectively, compared to ≤4.3% and ≤4.4% for other echinocandins. Using CLSI breakpoints, 18% and 19% of C. glabrata isolates were anidulafungin susceptible/caspofungin nonsusceptible and micafungin susceptible/caspofungin nonsusceptible, respectively; similar discrepancies were observed for 38% and 39% of C. krusei isolates. If only YeastOne data were considered, interhospital modal MIC variability was low (within 2 doubling dilutions for each agent). In conclusion, YeastOne assays employed in hospitals may reduce the interlaboratory variability in caspofungin MICs against Candida species that are observed between reference laboratories using CLSI broth microdilution methods. The significance of classifying isolates as caspofungin intermediate and anidulafungin/micafungin susceptible will require clarification in future studies.
INTRODUCTION
The echinocandin antifungals are frontline agents for the treatment of candidemia and other forms of invasive candidiasis, including infections caused by non-albicans species, such as Candida glabrata and C. krusei, that typically exhibit diminished susceptibility to fluconazole. Recent reports suggest that echinocandin resistance may be emerging with widespread use of these agents (1, 2). Resistance is mediated primarily through mutations in hot-spot regions of FKS genes, which encode the echinocandin target enzyme (1,3-β-d-glucan synthase) (2). The Clinical and Laboratory Standards Institute (CLSI) and European Committee on Antimicrobial Susceptibility Testing (EUCAST) have developed reference broth microdilution methods for evaluating echinocandin MICs (3–6). Using data generated by their reference method, CLSI proposed Candida species-specific echinocandin clinical breakpoint MICs, which were designed to identify fks mutant isolates that are less likely to respond to treatment (7). Both CLSI and EUCAST reference methods, however, are limited by significant interlaboratory variability in caspofungin MICs against C. albicans, C. glabrata, C. tropicalis, and C. krusei (8, 9). In contrast, the methods have performed more reliably between laboratories when testing anidulafungin and micafungin (9). As a result, investigators and EUCAST have suggested that laboratories report anidulafungin or micafungin MICs as a surrogate for the class, rather than caspofungin MICs (5, 8, 10).
The utility of the CLSI breakpoints in predicting responses to echinocandin treatment among patients with candidiasis remains unproven. In studies at a large tertiary-care center using the CLSI broth microdilution method, the vast majority of C. glabrata bloodstream isolates were classified as nonsusceptible to caspofungin if the recently revised CLSI breakpoints were applied (1). The clinical breakpoint MICs were not useful for identifying fks mutant isolates or predicting caspofungin responses among patients with C. glabrata candidemia. By receiver operating characteristic (ROC) analysis, investigators identified an institutional resistance breakpoint (>0.5 μg/ml) that both detected fks mutants and correlated with caspofungin treatment failures (1). In these studies, CLSI anidulafungin and micafungin breakpoints performed better than CLSI caspofungin breakpoints, but results were still superior using ROC-defined cutoffs (resistant, >0.06 μg/ml and >0.03 μg/ml for anidulafungin and micafungin, respectively) (10).
To date, echinocandin MICs have been reported largely from research or reference laboratories that used the CLSI or EUCAST broth microdilution methods. In contrast, echinocandin susceptibility data on Candida clinical isolates generated by hospital clinical microbiology laboratories and reported to clinicians are more limited. Furthermore, for ease of testing and time considerations, clinical microbiology laboratories often employ commercialized assays rather than reference broth microdilution methods. In general, commercialized tests, like Sensititre YeastOne (Thermo Fisher Scientific, Waltham, MA) or Etest (AB Biodisk, Solna, Sweden), generate echinocandin MICs that show high levels of essential agreement (defined as MICs within 2 doubling dilutions) with the reference methods, but categorical agreement (i.e., agreement in the classification of an isolate as susceptible, intermediate, or resistant) may be lower (11, 12). Therefore, even if the uncertainties about broth microdilution methods and the echinocandin MICs they generate are resolved, it is not clear that these data will be applicable to clinical practice in most hospitals.
We conducted a multicenter study of hospitals in which clinical microbiology laboratories performed routine testing on Candida bloodstream isolates. Our objectives were to report on testing methods, echinocandin MICs, and susceptibility patterns using the CLSI breakpoints.
MATERIALS AND METHODS
We performed a retrospective, multicenter, descriptive analysis of echinocandin MICs against bloodstream Candida isolates recovered from adult patients between 1 January 2005 and 1 June 2013. The study was approved by the Institutional Review Board at each center. The participating centers were Johns Hopkins Hospital, Baltimore, MD; Henry Ford Hospital, Detroit, MI; New York Presbyterian Hospital, New York, NY; Shands Teaching Hospital at the University of Florida, Gainesville, FL; University of Michigan Health System, Ann Arbor, MI; University of Utah, Salt Lake City, UT; University of Pittsburgh Medical Center, Pittsburgh, PA; Auckland City Hospital, Auckland, New Zealand; and Westmead Hospital, New South Wales, Australia. In general, Candida isolates were identified to the species level using morphology on cornmeal agar, yeast assimilation tests (API 20C Aux Yeast Identification System or Vitek Yeast Biochemical Card), or mass spectrometry; if the species level identification was in doubt, internal transcribed spacer (ITS) sequencing was performed. MICs were determined by the clinical microbiology laboratory at each center as part of routine patient care. Duplicate isolates from a given patient (defined as the same species within any 7-day period) were excluded. The methods used for antifungal susceptibility testing were recorded. Isolates were classified as susceptible (S), intermediate (I), or resistant (R). The following CLSI breakpoints were used for anidulafungin and caspofungin: C. albicans, C. krusei, and C. tropicalis, S ≤ 0.25, I = 0.5, R > 0.5 μg/ml; C. glabrata, S ≤ 0.125, I = 0.25, R > 0.25 μg/ml; and C. parapsilosis, S ≤ 2, I = 4, R > 4 μg/ml. For micafungin, the CLSI breakpoints were concordant with those for anidulafungin/caspofungin for C. albicans, C. krusei, C. tropicalis, and C. parapsilosis, but for C. glabrata, the breakpoints were as follows: S ≤ 0.06, I = 0.12, R > 0.125 μg/ml.
Data analysis.
For statistical analysis, MICs listed as “less than or equal to” were analyzed at the given concentration; MICs noted as “less than” were analyzed at a concentration 1 doubling dilution (here referred to as “1 dilution”) lower than the given concentration. Statistical analyses were performed using the PASW Statistics 18 software program (SPSS Inc., Chicago, IL). A chi-square test was used to determine differences in rates of susceptibility between caspofungin and anidulafungin or micafungin for individual Candida spp. Significance was defined as a P value of ≤0.05 (two tailed).
RESULTS
Echinocandin susceptibility testing methods and Candida isolates.
We surveyed 15 large tertiary-care teaching hospitals throughout the United States about echinocandin susceptibility testing of Candida bloodstream isolates. Fifty-three percent (8/15) of the centers routinely performed such testing in their clinical microbiology laboratories. Seven of the 8 U.S. centers and one hospital each from Australia and New Zealand participated in this study. Together, the centers provided data for 2,897 isolates. MICs were not always determined for all three echinocandins. Thus, anidulafungin, caspofungin, and micafungin were tested against 1,467, 2,355, and 2,004 isolates, respectively. Eight centers utilized Sensititre YeastOne for susceptibility testing during the study period, and one center (center 3) used the CLSI broth microdilution method. Overall, the five most common Candida spp. tested were C. albicans (n = 1,067), C. glabrata (911), C. parapsilosis (476), C. tropicalis (185), and C. krusei (104). Other, less common Candida spp. were C. lusitaniae (57), C. dubliniensis (36), C. guilliermondii (36), C. kefyr (17), C. famata (2), C. lipolytica (2), and one isolate each of C. haemulonii, C. nivariensis, C. norvegensis, and C. pelliculosa. This study focused on only the 5 most common Candida spp.
Echinocandin MIC distributions and susceptibility patterns.
Echinocandin MIC distributions against the five most common Candida spp. are presented in Table 1. There were no significant trends in the emergence of resistance to each of the echinocandins over time (data not shown). For C. albicans and C. tropicalis, the modal MIC of each of the agents was at least 3 dilutions below the MIC designated intermediate by the CLSI (Fig. 1). For C. parapsilosis, the modal caspofungin and micafungin MICs were 3 and 2 dilutions below the intermediate MIC breakpoint, respectively. The modal anidulafungin MIC was a single dilution below the intermediate breakpoint (Fig. 1). Despite the differences in modal MICs, resistance rates among C. albicans, C. parapsilosis, and C. tropicalis isolates using CLSI breakpoints were ≤1.4% for each of the echinocandins. Intermediate rates were ≤2%, ≤3%, and ≤0.7% among C. albicans, C. parapsilosis, and C. tropicalis isolates, respectively, for each of the agents.
TABLE 1.
Echinocandin MIC distributions
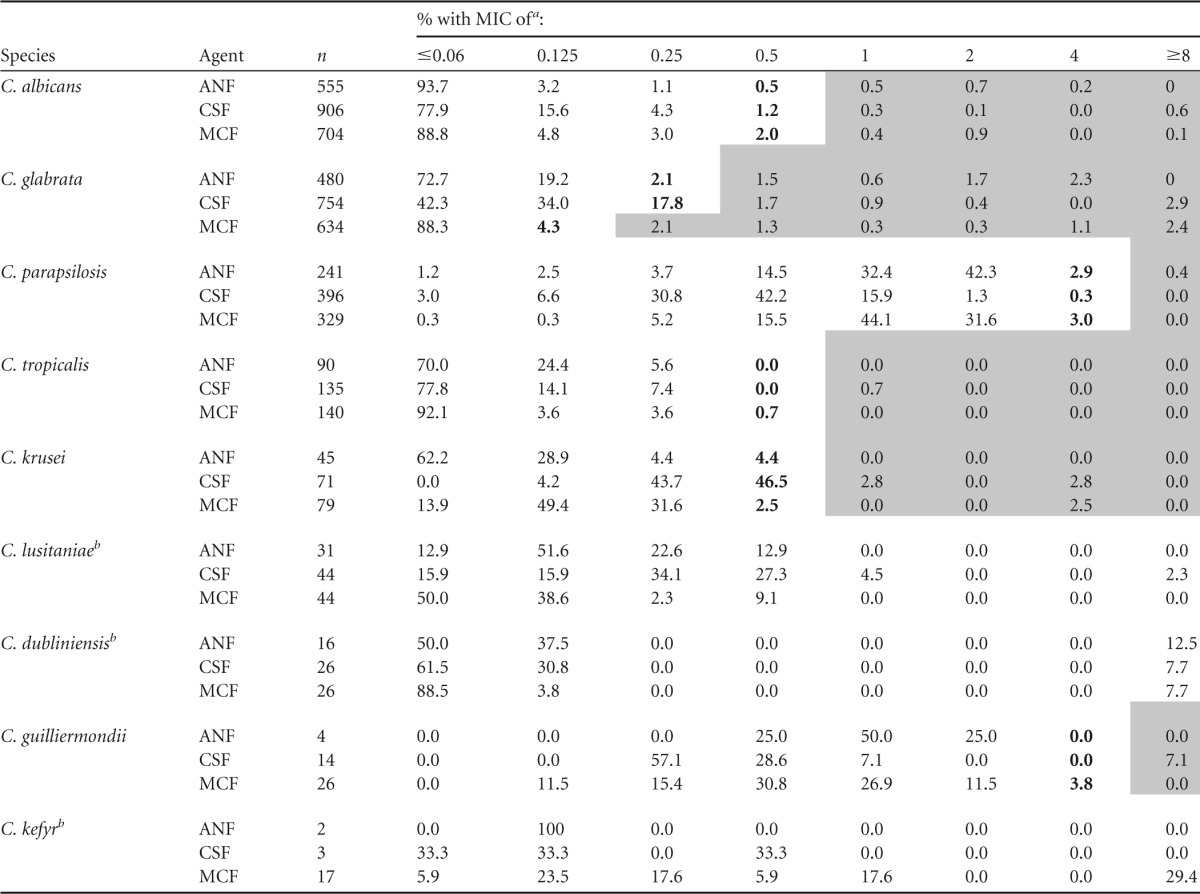
Boldface denotes intermediate susceptibility; shading denotes resistance. ANF, anidulafungin; CSF, caspofungin; MCF, micafungin. When data from center 3 were removed, differences in categorical agreement were ≤4% for all species.
CLSI breakpoints are not available for the species.
FIG 1.

Echinocandin MIC distributions against the five most common Candida spp. The lines represent breakpoints. Note that if data from center 3 are removed, the modes remain the same as shown except for the following: C. parapsilosis, anidulafungin mode MIC of 1 μg/ml; C. tropicalis, anidulafungin, caspofungin, and micafungin modes of 0.12, 0.03, and 0.03 μg/ml, respectively; and C. krusei, anidulafungin and caspofungin modes of 0.03 and 0.25/0.5 μg/ml, respectively. Since the micafungin CLSI breakpoint for C. glabrata differs from those of anidulafungin and caspofungin, the distribution of micafungin MICs is presented in a separate graph.
For C. glabrata, the modal anidulafungin and micafungin MICs were 3 dilutions below the intermediate breakpoint MICs, while the modal caspofungin MIC was only a single dilution below the intermediate breakpoint (Fig. 1). The resistance rate for caspofungin was 5.9% compared to 6.1% for anidulafungin (P = 1.0) and 7.5% for micafungin (P = 0.28). The intermediate rate for caspofungin was 17.8%, compared to 2.1% for anidulafungin and 4.3% for micafungin (P < 0.0001 for both). For C. krusei, the modal anidulafungin and micafungin MICs were 3 and 2 dilutions below the intermediate breakpoint MICs, respectively. In contrast, the modal caspofungin MIC was the same as the intermediate breakpoint. The resistance rate was 5.6% for caspofungin, compared to 0% for anidulafungin (P = 0.16) and 2.5% for micafungin (P = 0.42). The intermediate rate for caspofungin was 46.5%, compared to 4.4% for anidulafungin and 2.5% for micafungin (P < 0.0001 for both).
Modal MICs and susceptibility patterns remained essentially the same if data were taken only from centers that used the YeastOne assay (Table 1 and Fig. 1). For example, the resistance and intermediate rates for caspofungin among C. glabrata at these centers were 5.7% and 15.3%, respectively. The resistance and intermediate rates for caspofungin among C. krusei isolates were 6.9% and 44.8%, respectively.
Echinocandin MIC distributions and susceptibility patterns by center.
MIC distributions by center are presented in Table 2. Modal micafungin MICs against the five most common Candida species were within a single dilution at each of the centers. Modal caspofungin MICs against C. albicans, C. glabrata, and C. tropicalis were distributed within 2 dilutions; modal MICs against other species were within a single dilution. Modal anidulafungin MICs against both C. glabrata and C. tropicalis were within 3 dilutions; modal MICs against other species were within a single dilution. Intercenter variability was lessened if only YeastOne data were considered. Modal caspofungin MICs were within 2 dilutions against C. glabrata and within a single dilution against other species. Modal anidulafungin and micafungin MICs were within a single dilution against each of the five most common Candida species.
TABLE 2.
MIC distributions by center
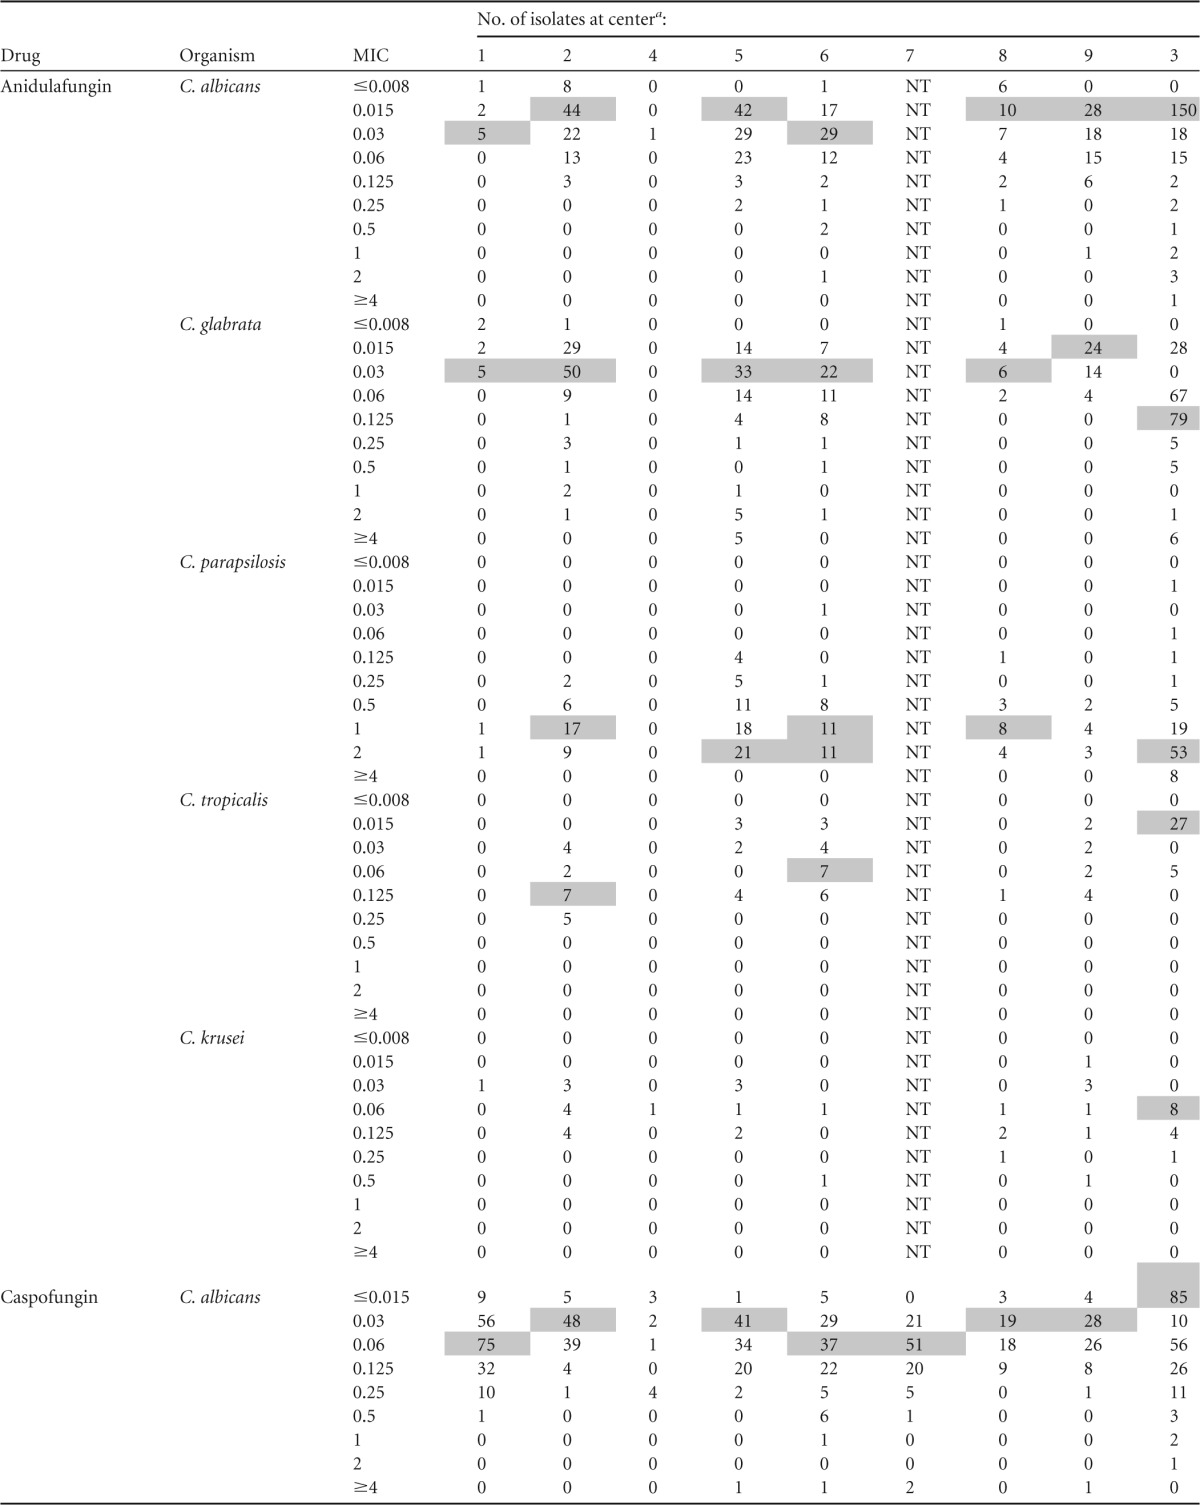
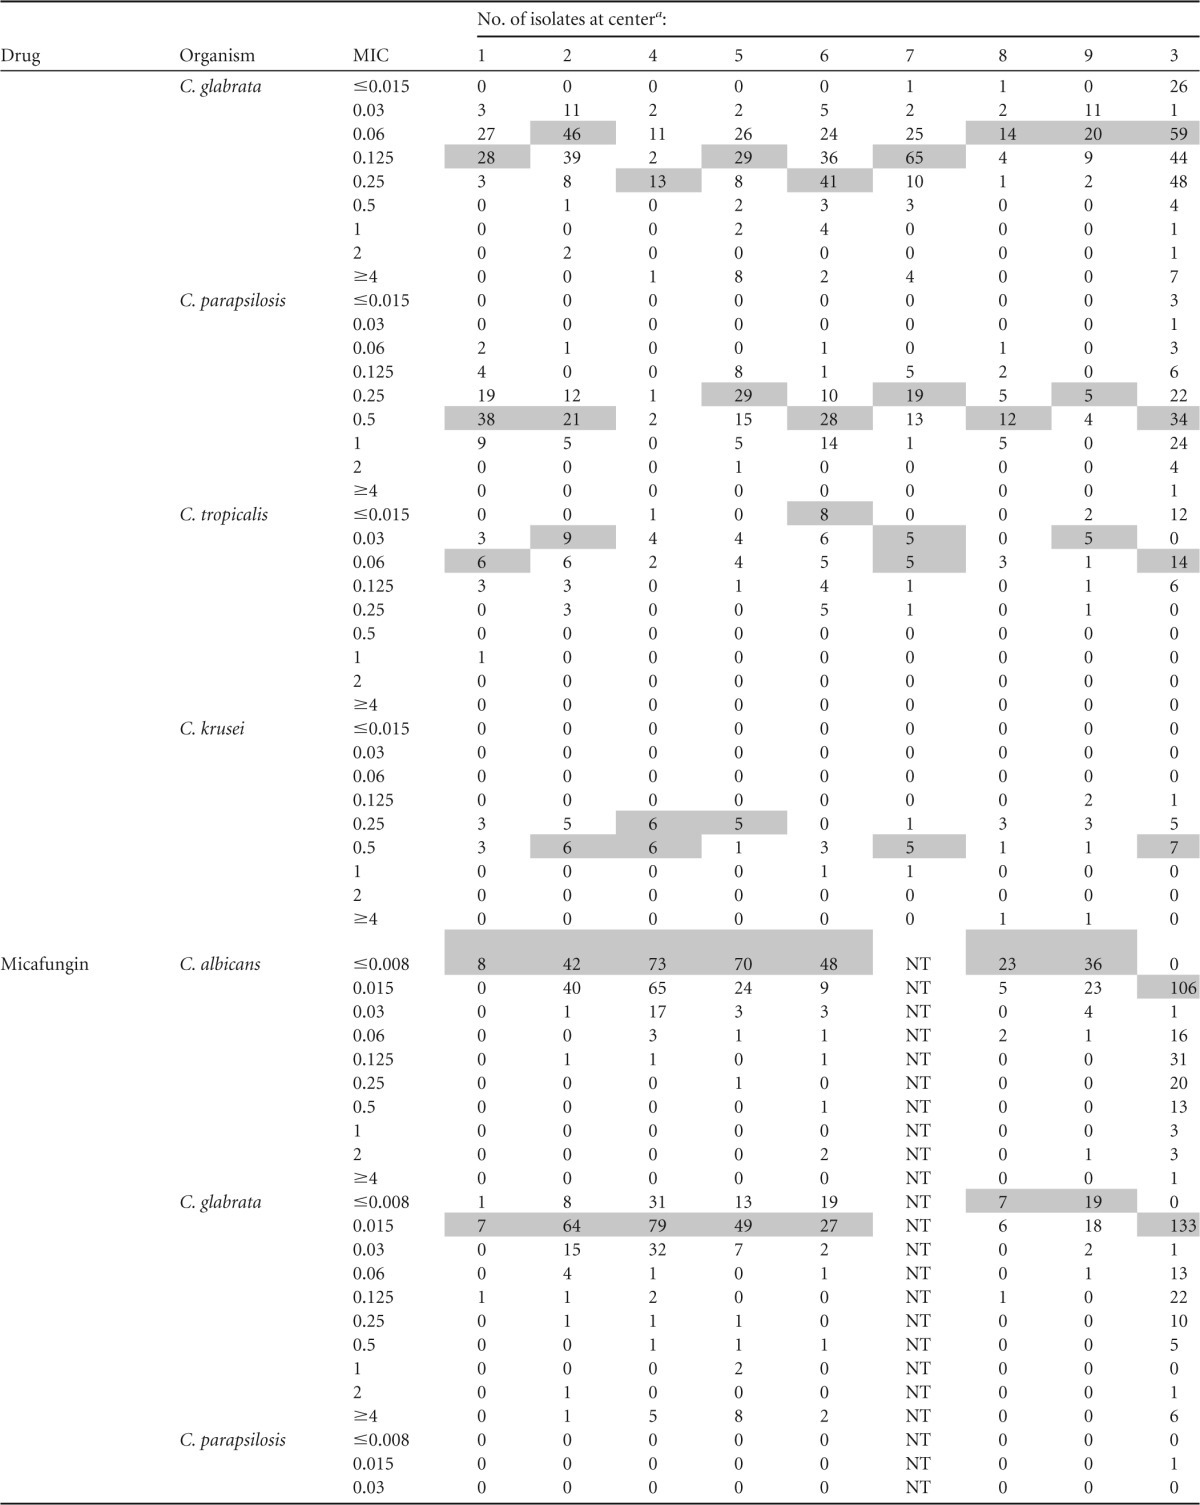
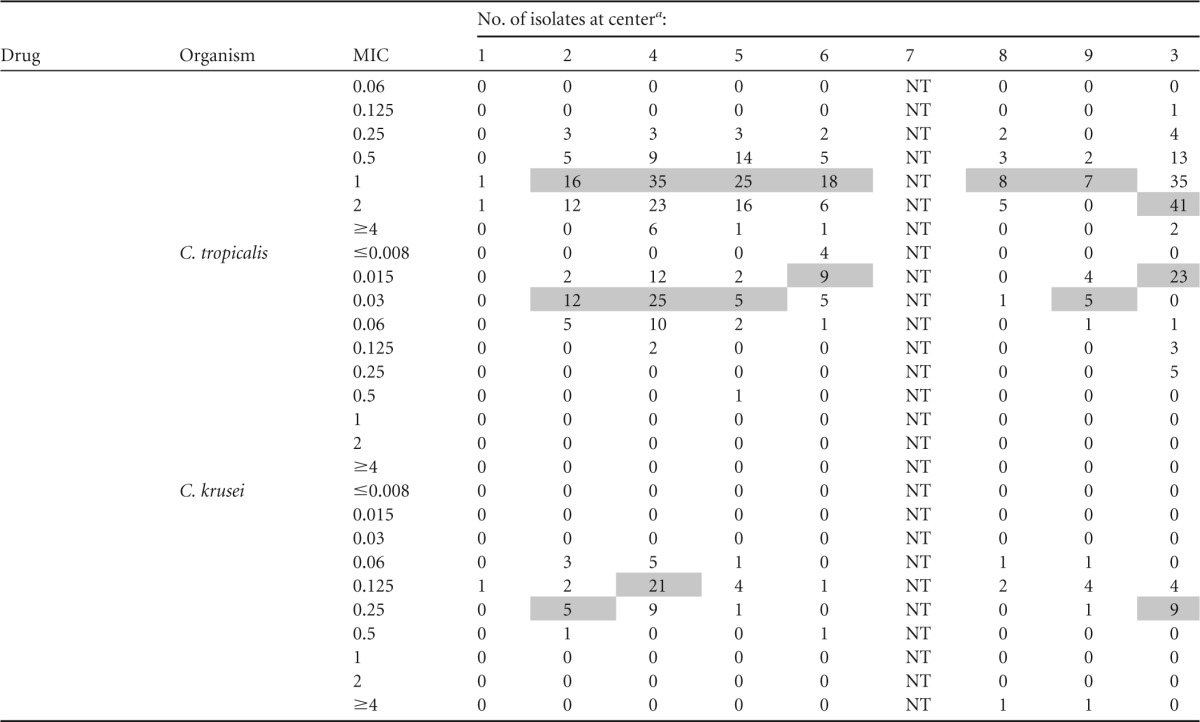
Modal MICs are shaded; modes are not indicated for institutions with <5 isolates. All centers utilized Sensititre YeastOne except center 3 (CLSI broth microdilution). NT, not tested.
The most notable differences in susceptibility between centers were with caspofungin against C. glabrata (Fig. 2). Resistance rates for the three agents were comparable across centers (range, 0 to 16%); however, intermediate rates varied more for caspofungin (5 to 45%) than anidulafungin (0 to 3.1%) or micafungin (0 to 11.5%). The interpretation of data for C. krusei is complicated by the small numbers of isolates at each center.
FIG 2.

C. glabrata susceptibility pattern by specific center. Center 7 tested only caspofungin. Center 4 tested only caspofungin and micafungin.
Categorical agreement among C. glabrata and C. krusei isolates.
Rates of categorical agreement for caspofungin-anidulafungin, caspofungin-micafungin, and micafungin-anidulafungin among C. glabrata isolates that were tested against both agents were 80%, 72%, and 89%, respectively (Fig. 3). The most common categorical discrepancies included 18% of the C. glabrata isolates that were anidulafungin susceptible and caspofungin nonsusceptible (caspofungin intermediate, 16%; caspofungin resistant, 2%) and 19% of isolates that were micafungin susceptible and caspofungin nonsusceptible (caspofungin intermediate, 17%; caspofungin resistant, 2%). Eight percent of C. glabrata isolates were anidulafungin susceptible and micafungin nonsusceptible (micafungin intermediate, 4%; micafungin resistant, 4%). Other categorical discrepancies were noted in ≤6% of C. glabrata isolates.
FIG 3.

Categorical agreement among C. glabrata and C. krusei. Percentages were essentially unchanged with data from center 3 removed from the analysis.
Rates of categorical agreement for caspofungin-anidulafungin, caspofungin-micafungin, and micafungin-anidulafungin among C. krusei isolates that were tested against both agents were 59%, 58%, and 93%, respectively (Fig. 3). The most common categorical discrepancies included 38% of C. krusei isolates that were anidulafungin susceptible and caspofungin nonsusceptible (caspofungin intermediate, 36%; caspofungin resistant, 2%) and 39% of the isolates that were micafungin susceptible and caspofungin nonsusceptible (all caspofungin intermediate). Other categorical discrepancies were noted in ≤4% of C. krusei isolates.
DISCUSSION
To our knowledge, this is the first multicenter study to report, evaluate, and compare the echinocandin MICs against clinical Candida bloodstream isolates, using data that were generated as part of routine patient care by clinical microbiology laboratories and reported to clinicians. With one exception, the clinical laboratories used the commercial YeastOne assay to measure MICs, rather than the CLSI/EUCAST broth microdilution methods typically used by reference and research laboratories. An important outcome of this study was that echinocandin MICs measured by YeastOne were distributed comparably against the various Candida species at the different centers and that the modal MICs of each agent fell within narrow ranges (≤2 dilutions). The results for caspofungin, in particular, were remarkable, differing dramatically from a recent international study of 24 laboratories that measured caspofungin MICs using CLSI- or EUCAST-recommended broth microdilution methods (8). In the latter study, there was extraordinary modal variability in caspofungin MICs between laboratories against C. albicans, C. glabrata, C. krusei, and C. tropicalis (ranges of 4 or 5 dilutions) (8). These data corroborated smaller reports of interlaboratory variability for caspofungin MICs by CLSI broth microdilution methods, most notably for C. glabrata (9, 13). A prospective, multicenter study is warranted to test whether YeastOne or other commercial tests may overcome the variability in caspofungin MICs that has been reported to date, particularly since a significant percentage of clinical laboratories are employing such methodologies.
A second important finding in this study was that clinical breakpoint MICs, as proposed by CLSI based upon data obtained using CLSI broth microdilution methodology, identified large percentages of C. glabrata (24%) and C. krusei (52%) isolates as caspofungin nonsusceptible. In contrast, anidulafungin and micafungin nonsusceptibility rates were only 8% and 12% among C. glabrata isolates, respectively, and 4% and 5% among C. krusei isolates. The rates of caspofungin, anidulafungin, and micafungin resistance did not differ significantly among C. glabrata (≤7.5%) and C. krusei (≤6%) isolates. Rather, more C. glabrata and C. krusei isolates were found to be intermediate to caspofungin (18% and 47%, respectively) than anidulafungin (2% and 4%, respectively) or micafungin (4% and 3%, respectively). Along these lines, the most common categorical discrepancies were described in caspofungin-intermediate C. glabrata and C. krusei isolates that were identified as anidulafungin and micafungin susceptible. For each of the agents, rates of nonsusceptibility against the other common Candida species were extremely low (<4%).
Overall, our data were similar to those in previous studies of commercial assays that used CLSI echinocandin breakpoints (11, 12). In one study, categorical agreement between YeastOne and broth microdilution MICs using CLSI breakpoints was excellent for all echinocandin-Candida species combinations, except for caspofungin-C. glabrata and caspofungin-C. krusei. Caspofungin nonsusceptibility rates by YeastOne were 16.1% and 23.5% against C. glabrata and C. krusei, respectively, compared to <5% for other echinocandins (11). In a study evaluating Etest methodology, the use of CLSI breakpoints misclassified 33% and 73% of putatively wild-type C. glabrata and C. krusei isolates, respectively, as caspofungin nonsusceptible (12). In both studies, the overwhelming majority of the nonsusceptible isolates were identified as caspofungin intermediate (11, 12).
The significance of classifying isolates as caspofungin intermediate and anidulafungin/micafungin susceptible is not clear. It is biologically unlikely that such large percentages of C. glabrata and C. krusei isolates are nonsusceptible to caspofungin but remain susceptible to anidulafungin and micafungin. Although there is emerging evidence that certain fks mutations may confer differential relative resistance to echinocandins that correlates with treatment responses in mice, the extent of this phenomenon and its clinical significance are unknown (14). Indeed, differences in clinical efficacy among the three echinocandins have never been demonstrated in clinical trials, and all of the members of the class are considered therapeutically equivalent (15). When setting the echinocandin breakpoints, CLSI acknowledged that as additional data are compiled, isolates currently classified as intermediate may need to be reclassified as susceptible or resistant (3).
A top priority in the future will be to validate proposed echinocandin breakpoints by systematically characterizing FKS genotypes of Candida isolates and correlating genetic variants with pharmacokinetic-pharmacodynamic data from mice and treatment responses among patients with candidiasis. Initial studies should be on C. glabrata and C. krusei isolates that are defined as caspofungin nonsusceptible but anidulafungin and micafungin susceptible by CLSI breakpoints. Afterwards, other Candida species that demonstrate discrepant susceptibility patterns should be evaluated. In pursuing future studies, researchers must be mindful of the fact that many, if not most, clinical microbiology laboratories will be employing commercial susceptibility assays, such as YeastOne, rather than reference broth microdilution methods. As such, comparative studies that include commercial assays will be particularly important.
It is imperative to resolve the ongoing uncertainties surrounding echinocandin susceptibility testing in Candida spp. and the clinical interpretation of breakpoint MICs. The performance of the YeastOne assay in this study argues that the shortcomings of CLSI/EUCAST broth microdilution methods are due to methodological considerations rather than lot-to-lot variations in caspofungin potency, as proposed previously (16). The clinical implications of failing to improve the performance of caspofungin susceptibility testing are clear from our data. Currently, MICs provided to clinicians by clinical laboratories may overstate the rates of caspofungin nonsusceptibility among C. glabrata and C. krusei isolates. Although echinocandin therapy for candidemia and other forms of invasive candidiasis caused by C. glabrata has not been shown to reduce mortality relative to other treatment options, it has been shown to result in higher rates of clinical response (17, 18). Therefore, if clinicians are discouraged from using caspofungin or other echinocandins due to the overstated reports of caspofungin nonsusceptibility, patient outcomes may be adversely impacted. In addition, uncertainties about the reproducibility and relevance of echinocandin susceptibility data may contribute to reluctance on the part of many hospitals to offer such testing. It was striking that only 53% of U.S. tertiary-care hospitals surveyed performed echinocandin susceptibility tests in house despite the importance of candidemia and candidiasis at such centers. The scientific implications of improving echinocandin testing are also significant, since accurate data are essential for epidemiologic studies and important in defining or determining differences in clinical activity and efficacy among these agents. In this regard, adopting either anidulafungin or micafungin susceptibility testing as a valid surrogate determinant for the echinocandin class is a less satisfactory course of action than developing and validating caspofungin testing methods that are more reliable than the current CLSI/EUCAST broth microdilution methods.
ACKNOWLEDGMENTS
We thank Diana Pakstis and Sue Sleiman for their assistance in the study.
M.H.N. has received investigator-initiated research funding from Pfizer, Merck, CSL Behring, and Biotherapies for Life. S.S. has received research funding from Pfizer, Merck, and Astellas. J.A.V. has received grant support from Forest, Pfizer, and Merck and has served on speaker bureaus for Pfizer and Astellas. R.K.S. is supported by the National Center for Advancing Translational Sciences of the National Institutes of Health under award number KL2TR000146 and has received investigator-initiated funding from Merck and Astellas. P.L.C. has received funding from Astellas (consulting and grant support) and Merck (grant support). S.C. has served on antifungal advisory boards for Merck, Gilead Sciences, and Pfizer (Australia) and has received grant support from Merck, Gilead Sciences, and Pfizer (Australia). C.J.C. has received grant support for investigator-initiated research projects from Pfizer, Merck, and AstraZeneca. We have no other disclosures to report.
The content is solely the responsibility of the authors and does not necessarily represent the official views of the National Institutes of Health.
Footnotes
Published ahead of print 6 January 2014
REFERENCES
- 1.Shields RK, Nguyen MH, Press EG, Updike CL, Clancy CJ. 2013. Caspofungin MICs correlate with treatment outcomes among patients with Candida glabrata invasive candidiasis and prior echinocandin exposure. Antimicrob. Agents Chemother. 57:3528–3535. 10.1128/AAC.00136-13 [DOI] [PMC free article] [PubMed] [Google Scholar]
- 2.Alexander BD, Johnson MD, Pfeiffer CD, Jimenez-Ortigosa C, Catania J, Booker R, Castanheira M, Messer SA, Perlin DS, Pfaller MA. 2013. Increasing echinocandin resistance in Candida glabrata: clinical failure correlates with presence of FKS mutations and elevated minimum inhibitory concentrations. Clin. Infect. Dis. 56:1724–1732. 10.1093/cid/cit136 [DOI] [PMC free article] [PubMed] [Google Scholar]
- 3.Clinical and Laboratory Standards Institute. 2012. Reference method for broth dilution antifungal susceptibility testing of yeasts; fourth informational supplement. CLSI document M27-S4 Clinical and Laboratory Standards Institute, Wayne, PA [Google Scholar]
- 4.Subcommittee on Antifungal Susceptibility Testing of the ESCMIDEuropean Committee for Antimicrobial Susceptibility Testing. 2008. EUCAST definitive document EDef 7.1: method for the determination of broth dilution MICs of antifungal agents for fermentative yeasts. Clin. Microbiol. Infect. 14:398–405. 10.1111/j.1469-0691.2007.01935.x [DOI] [PubMed] [Google Scholar]
- 5.Arendrup MC, Rodriguez-Tudela JL, Lass-Flörl C, Cuenca-Estrella M, Donnelly JP, Hope W, European Committee on Antimicrobial Susceptibility Testing Subcommittee on Antifungal Susceptibility Testing 2011. EUCAST technical note on anidulafungin. Clin. Microbiol. Infect. 17:E18–E20. 10.1111/j.1469-0691.2011.03647.x [DOI] [PubMed] [Google Scholar]
- 6.Arendrup MC, Cuenca-Estrella M, Lass-Flörl C, Hope WW, European Committee on Antimicrobial Susceptibility Testing Subcommittee on Antifungal Susceptibility Testing 2012. EUCAST technical note on the EUCAST definitive document EDef 7.2: method for the determination of broth dilution minimum inhibitory concentrations of antifungal agents for yeasts EDef 7.2 (EUCAST-AFST). Clin. Microbiol. Infect. 18:E246–E247. 10.1111/j.1469-0691.2012.03880.x [DOI] [PubMed] [Google Scholar]
- 7.Pfaller MA, Diekema DJ, Andes D, Arendrup MC, Brown SD, Lockhart SR, Motyl M, Perlin DS. 2011. Clinical breakpoints for the echinocandins and Candida revisited: integration of molecular, clinical, and microbiological data to arrive at species-specific interpretive criteria. Drug Resist. Updat. 14:164–176. 10.1016/j.drup.2011.01.004 [DOI] [PubMed] [Google Scholar]
- 8.Espinel-Ingroff A, Arendrup MC, Pfaller MA, Bonfietti LX, Bustamante B, Canton E, Chryssanthou E, Cuenca-Estrella M, Dannaoui E, Fothergill A, Fuller J, Gaustad P, Gonzalez GM, Guarro J, Lass-Flörl C, Lockhart SR, Meis JF, Moore CB, Ostrosky-Zeichner L, Pelaez T, Pukinskas SR, St-Germain G, Szeszs MW, Turnidge J. 2013. Interlaboratory variability of caspofungin MICs for Candida spp. using CLSI and EUCAST methods: should the clinical laboratory be testing this agent? Antimicrob. Agents Chemother. 57:5836–5842. 10.1128/AAC.01519-13 [DOI] [PMC free article] [PubMed] [Google Scholar]
- 9.Pfaller MA, Diekema DJ. 2007. Epidemiology of invasive candidiasis: a persistent public health problem. Clin. Microbiol. Rev. 20:133–163. 10.1128/CMR.00029-06 [DOI] [PMC free article] [PubMed] [Google Scholar]
- 10.Shields RK, Nguyen MH, Press EG, Updike CL, Clancy CJ. 2013. Anidulafungin and micafungin minimum inhibitory concentration breakpoints are superior to caspofungin for identifying FKS mutant Candida glabrata and echinoncandin resistance. Antimicrob. Agents Chemother. 57:6361–6365. 10.1128/AAC.01451-13 [DOI] [PMC free article] [PubMed] [Google Scholar]
- 11.Pfaller MA, Chaturvedi V, Diekema DJ, Ghannoum MA, Holliday NM, Killian SB, Knapp CC, Messer SA, Miskou A, Ramani R. 2012. Comparison of the Sensititre YeastOne colorimetric antifungal panel with CLSI microdilution for antifungal susceptibility testing of the echinocandins against Candida spp. using new clinical breakpoints and epidemiological cutoff values. Diagn. Microbiol. Infect. Dis. 73:365–368. 10.1016/j.diagmicrobio.2012.05.008 [DOI] [PubMed] [Google Scholar]
- 12.Arendrup MC, Pfaller MA, Danish Fungaemia Study Group 2012. Caspofungin Etest susceptibility testing of Candida species: risk of misclassification of susceptible isolates of C. glabrata and C. krusei when adopting the revised caspofungin CLSI breakpoints. Antimicrob. Agents Chemother. 56:3965–3968. 10.1128/AAC.00355-12 [DOI] [PMC free article] [PubMed] [Google Scholar]
- 13.Arendrup MC, Garcia-Effron G, Buzina W, Mortensen KL, Reiter N, Lundin C, Elvang Jensen H, Lass-Florl C, Perlin DS, Bruun B. 2009. Breakthrough Aspergillus fumigatus and Candida albicans double infection during caspofungin treatment: laboratory characteristics and implications for susceptibility testing. Antimicrob. Agents Chemother. 53:1185–1193. 10.1128/AAC.01292-08 [DOI] [PMC free article] [PubMed] [Google Scholar]
- 14.Arendrup MC, Perlin DS, Jensen RH, Howard SJ, Goodwin J, Hope W. 2012. Differential in vivo activities of anidulafungin, caspofungin, and micafungin against Candida glabrata isolates with and without FKS resistance mutations. Antimicrob. Agents Chemother. 56:2435–2442. 10.1128/AAC.06369-11 [DOI] [PMC free article] [PubMed] [Google Scholar]
- 15.Pappas PG, Kauffman CA, Andes D, Benjamin DK, Calandra TF, Edwards JE, Filler SG, Fisher JF, Kullberg BJ, Ostrosky-Zeichner L, Reboli AC, Rex JH, Walsh TJ, Sobel JD. 2009. Clinical practice guidelines for the management of candidiasis: 2009 update by the Infectious Diseases Society of America. Clin. Infect. Dis. 48:503–535. 10.1086/596757 [DOI] [PMC free article] [PubMed] [Google Scholar]
- 16.Arendrup CA, Garcia-Effron G, Lass-Florl C, Gomez-Lopez A, Rodriguez-Tudela JL, Cuenca-Estrella M, Perlin DS. 2010. Echinocandin susceptibility testing of Candida species: comparison of EUCAST EDef 7.1, CLSI M27-A3, Etest, disk diffusion, and agar dilution methods with RPMI and IsoSensitest Media. Antimicrob. Agents Chemother. 54:426–439. 10.1128/AAC.01256-09 [DOI] [PMC free article] [PubMed] [Google Scholar]
- 17.Andes DR, Safda N, Baddley JW, Playford G, Reboli AC, Rex JH, Sobel JD, Pappas PG, Kullberg BJ, Mycoses Study Group 2012. Impact of treatment strategy on outcomes in patients with candidemia and other forms of invasive candidiasis: a patient-level quantitative review of randomized trials. Clin. Infect. Dis. 54:1110–1122. 10.1093/cid/cis021 [DOI] [PubMed] [Google Scholar]
- 18.Eschenauer GA, Carver PL, Lin SW, Klinker KP, Chen YC, Potoski BA, Shields RK, Clancy CJ, Nguyen MH, Lam SW. 2013. Fluconazole versus an echinocandin for Candida glabrata fungaemia: a retrospective cohort study. J. Antimicrob. Chemother. 68:922–926. 10.1093/jac/dks482 [DOI] [PMC free article] [PubMed] [Google Scholar]