

Abstract
Insulin-like growth factor (IGF) signaling plays an important role in many tumors and overexpression of IGF Binding Protein (IGFBP) 2 has been associated with adverse outcome in childhood leukemia. Here, we evaluated IGFBP2 mRNA expression and its prognostic implications in 99 adult acute myeloid leukemia (AML) patients by quantitative real-time RT-PCR. High IGFBP2 was associated with a high incidence of primary resistant disease (IGFBP2 high 65%, IGFBP2 low 32%; P=0.02) and was independently predictive for therapy resistance [OR 3.6 (95% CI 1.2–11); P=0.02] in multivariate analyses. Gene-expression profiling revealed an up-regulation of genes implicated in leukemogenesis (MYB, MEIS1, HOXB3, HOXA9) and genes associated with adverse outcome (ERG, WT1) in patients with high IGFBP2 expression. Thus, our data suggest a role of IGFBP2 and IGF signaling in chemoresistance of AML. Patients with high IGFBP2 expression might benefit from molecular therapies targeting the IGF pathway.
Keywords: IGFBP2, acute myeloid leukemia, chemoresistance
Introduction
Clinical outcome of patients with acute myeloid leukemia (AML) remains poor with a long-term survival of 30–50% in younger patients [1]. The identification of aberrant signaling pathways in AML has elucidated mechanisms of disease pathogenesis and led to the development of new targeted therapies. Further characterization of potentially druggable and prognostically relevant signaling pathways might improve risk-assessment and therapeutic strategies for AML patients.
Alterations of the insulin-like growth factor (IGF) system have been demonstrated in different hematological and solid malignancies and provide a potential target for novel anticancer therapies. The IGF pathway is important for regulating proliferation, differentiation, and apoptosis in normal tissues and tumor cells [2]. In AML, the two ligands IGF-I and IGF-II are known to stimulate proliferation of leukemic blasts [3]. Furthermore, autocrine expression of IGF-I has been detected in AML cells in vitro [4]. Moreover, inhibition of the IGF axis by IGF-IR kinase inhibitors or anti-IGF-receptor antibodies revealed substantial antiproliferative effects in leukemic cells [4–6].
The functional activity of IGF-I and IGF-II is regulated by seven high-affinity IGF binding proteins (IGFBP1–7). They act as carrier proteins and modulate bioavailability and half-life of the IGFs. In addition, in vitro and in vivo findings suggest that IGFBPs promote cell growth independently of IGFs [7]. IGFBP2, one of the major IGFBPs, is aberrantly expressed in a variety of solid tumors, lymphomas, and in patients with acute lymphoblastic leukemia (ALL) and AML [8–10]. Although the functional role of IGFBP2 in acute leukemias and other types of cancer is still unknown, overexpression of IGFBP2 has been associated with higher tumor grade, tumorigenicity [8], and therapy resistance [11] in different human malignancies. In childhood AML, high expression of IGFBP2 mRNA was related to inferior event-free survival (EFS) and was independently predictive for a higher relapse rate in small studies of 13 and 35 patients, respectively [10, 12]. In addition, high IGFBP2 serum protein levels have been associated with a high risk of relapse after hematopoietic stem cell transplantation (SCT) in childhood AML [13]. In children with ALL, high IGFBP2 serum protein levels were associated with chemotherapy resistance, a high relapse rate, and inferior EFS [14].
The prognostic significance of IGFBP2 in children with acute leukemias prompted us to evaluate IGFBP2 mRNA expression and its prognostic implications in adult AML. We determined IGFBP2 mRNA expression in 99 adult patients with newly diagnosed AML in the context of established clinical and molecular risk factors. In addition, we analyzed gene-expression profiles (GEP) in an independent cohort of 61 adult cytogenetically normal (CN)-AML patients to gain insights into the functional role of IGFBP2 in leukemia.
Material and methods
Patients
We analyzed 99 adult patients with newly diagnosed AML admitted to the Charité Berlin (Germany) between 2003 and 2010. Only patients that were eligible for clinical trials using intensive induction chemotherapy regimens were included; thus, our patient cohort is not fully representative of all AML patients. Bone marrow (BM) samples were selected from consecutive patients that had sufficient material available. The median blast percentage in the BM specimens was 80%, with no significant difference between the IGFBP2 expression groups. In addition, IGFBP2 was determined in peripheral blood samples (PB; n=16), BM mesenchymal stromal cells (BMSC; n=9), and serum samples (n=23) in patients of the same cohort.
Patients with AML FAB M3 or M3v were excluded from this study. Patient's median age was 58 years (range 19–80). Cytogenetic risk groups were assigned as defined by the European LeukemiaNet (ELN) classification: favourable: t(8;21)(q22;q22)/RUNX1-RUNX1T1; inv(16)(p13.1q22) or t(16;16)(p13.1;q22)/CBFB-MYH11; mutated NPM1 without FLT3-ITD (normal karyotype); mutated CEBPA (normal karyotype), intermediate-I: FLT3-ITD (normal karyotype) or wildtype NPM1 without FLT3-ITD (normal karyotype), intermediate-II: t(9;11)(p22;q23)/MLLT3-MLL; cytogenetic aberrations not classified as favourable or adverse, adverse: inv(3)(q21q26.2) or t(3;3)(q21;q26.2)/RPN1-EVI1; t(6;9)(p23;q34)/DEK-NUP214; t(v;11)(v;q23)/MLL rearranged; −5 or del(5q); −7; abnl(17p); complex karyotype [15].
Patients received standard cytarabine/anthracycline-based intensive induction chemotherapies according to the following multicenter study protocols: AML 2003 Study Alliance Leukemia (SAL) protocol (n=54), AML 2004 East German Study Group Hematology and Oncology (OSHO) #069 (n=27), and AML SORAML SAL (n=18). Consolidation therapies included high dose cytarabine-based therapies and allogeneic SCT. For details please refer to the particular study protocol available in the European Leukemia Trial Registry [16].
Diagnostic analyses were performed on fresh pretreatment BM and PB samples. Morphologic and cytogenetic analyses were done in the institutional laboratories using standard procedures. FLT3-ITD mutations [17], NPM1 mutations [18], and BAALC expression [19] were determined as previously described. BMSC were generated as previously reported [20].
Healthy donors were used as controls (BM: n=8; PB: n=6; BMSC: n=9; serum: n=3). Informed consent was obtained from all patients and donors according to the Declaration of Helsinki. The studies were approved by the ethics board of the Universities of Dresden and Leipzig (Germany).
RNA isolation and synthesis of complementary DNA (cDNA)
BM and PB mononuclear cells from diagnostic AML samples and healthy controls were obtained by density-gradient centrifugation (Ficoll-PaquePlus; Amersham Biosciences, Uppsala, Sweden) and total RNA isolation was carried out using Trizol reagent (Invitrogen, Karlsruhe, Germany) following the manufacturer's instructions. Synthesis of cDNA was performed using 500ng of total RNA, AMV-reverse transcriptase, RNase inhibitor and oligo dT20-primer at 50°C for 60 min (Roche, Mannheim, Germany).
Real-time RT-PCR
IGFBP2 expression was determined by multiplex quantitative real-time reverse transcriptase polymerase chain reaction (RT-PCR) on the Rotorgene RG-3000 real time cycler (Corbett Research, Wasserburg, Germany). The housekeeping gene Glyceraldehyde-3-phosphate dehydrogenase (GAPDH) was coamplified to obtain relative expression levels. Primers for GAPDH and IGFBP2 were as follows: GAPDH probe 5′-HEX-ATGCCATCACTGCCACCCAGAAGAC-BHQ1, GAPDH forward 5′-GGTATCGTGGAAGGACTCATGAC, GAPDH reverse 5′-ATGCCAGTGAGCTTCCCGTTCAG; IGFBP2 probe 5′FAM-CCTGCCAGGACTCCCTGCCAAC-TAMRA, IGFBP2 forward 5′-CATCACCTTGGCCTGGAG, IGFBP2 reverse 5′-GGATGTGCAGGGAGTAGAGG. IGFBP2 expression was calculated with the mean of the cycle number difference of the two replicates (ΔCT = GAPDH-IGFBP2), expressed as 2μ(ΔCT). PCR assays were performed in duplicate and each assay included positive and negative controls. RNA from the cell line BE-13 was used to calibrate between runs. If amplification of GAPDH did not reach the threshold within 30 cycles, samples were excluded.
ELISA assay
Serum IGFBP2 was measured by ELISA using a microplate precoated with anti-human IGFBP2 antibodies (RayBiotech Inc., Norcross, GA, USA) following the manufacturer's instructions. Recombinant IGFBP2 at final concentrations from 0.16–10 ng/ml was used for calibration. Extinction was measured at 450 nm using a multiplate ELISA reader (Dynatech International, Chantilly, VA, USA).
Oligonucleotide microarray analyses
An independent cohort of 61 BM samples from adult patients aged less than 60 years with newly diagnosed, untreated CN-AML confirmed by central morphologic and karyotype reviews enrolled on the Cancer and Leukemia Group B (CALGB) treatment protocol 9621 [21] was used to generate a microarray-based IGFBP2-associated GEP. RNA samples were analyzed using Affymetrix U133 plus 2.0 GeneChips (Affymetrix, Santa Clara, CA, USA) as previously reported [21].
Data were pre-processed using GCOS software (Affymetrix, Santa Clara, CA, USA) and further analyzed with GeneSpring software version 4.2 (Silicon Genetics, Redwood City, CA, USA). Probe sets were included in the comparisons if they were called present by the Affymetrix data analyses in at least 75% of samples. IGFBP2 expression was represented by the probe set 202718_at and samples were divided into quartiles (q1–q4) according to IGFBP2 expression levels. The low IGFBP2 GEP group included samples of the lowest quartile q1 and the high IGFBP2 GEP group samples of q4 to assure a specific gene-expression signature that sufficiently discriminated between low and high IGFBP2 expressers. Probe sets were defined as differentially expressed if they exhibited at least a 2-fold change in expression. Statistical significance was calculated by the nonparametric Mann-Whitney U test (P value ≤ 0.001).
Statistical analyses
IGFBP2 mRNA expression levels of the 99 BM samples were grouped into quartiles (Q1–4) and divided into low IGFBP2 [Q1–3: (n=74)] and high IGFBP2 [Q4: (n=25)]. Q4 was chosen as cut point as the difference in CR rates was most relevant between Q1–3 and Q4 (P=0.01), compared to Q1 vs. Q2–4 (P=0.48), and Q1–2 vs. Q3–4 (P=0.32). Thus, after correction for searching 3 different cutpoint comparisons, the difference between Q1–3 and Q4 was still of statistical significance. IGFBP2 expression ranged between 0–1.26 with the following median expression levels for each quartile: 0.003 (Q1), 0.04 (Q2), 0.11 (Q3), 0.33 (Q4). Q1, Q2, Q3, and Q4 are capitalized to distinguish the data from microarray based expression (q1–q4).
Complete remission (CR) was defined by a granulocyte count of at least 1.5/nl, a platelet count of at least 100/nl, the absence of PB blasts, a BM cellularity of at least 20% with maturation of all cell lines and less than 5% blasts, and the absence of extramedullary leukemia. Primary resistant disease was defined as persistence of PB blasts or more than 5% blasts in BM after completion of induction therapy. Relapse was defined as reappearance of PB blasts, more than 5% blasts in BM, or reappearance/development of extramedullary leukemia after achievement of CR. Overall survival (OS) was measured from the beginning of therapy until date of death or last follow-up. Relapse-free survival (RFS) was determined from the date of first CR until relapse. Patients without reported relapse were censored on the date of last follow-up. Survival curves were calculated by the Kaplan-Meier-method with the log-rank comparing differences between survival curves. The median follow-up for all living patients was 33.2 months (range 1.2–74). Patients who received SCT were censored at the time of transplantation for survival analyses.
Clinical features across groups were compared using the χ2 or a two-sided Fisher's exact test for categorical data and the nonparametric Mann-Whitney U test for continuous variables. A P value ≤ 0.05 (two-sided) was considered significant. Multivariate analyses were performed using logistic regression with stepwise forward selection including the following variables in the full model: IGFBP2 expression [high (Q4) vs. low (Q1–3)], leukocyte count (1/nl increase), age (10 year increase), LDH (> 350 U/l vs. ≤ 350 U/l), type of AML (de novo AML vs. secondary (s) AML), cytogenetic risk groups (favourable, intermediate-I, intermediate-II, adverse). Secondary AML was defined as treatment-related AML or AML following myelodysplastic syndrome (MDS). SPSS software package (version 18.0 for Windows; SPSS Inc., Chicago, IL, USA) was used for calculations.
Results
Aberrant expression of IGFBP2 in AML
IGFBP2 mRNA expression was analyzed in pretreatment BM samples of 99 adult patients with newly diagnosed AML. In addition, IGFBP2 expression was determined in 16 PB samples and 9 BMSC samples, and IGFBP2 protein levels were analyzed in 23 serum samples of patients in this same cohort.
AML patients showed significantly higher IGFBP2 mRNA expression in BM (median: 0.07 vs. 0.04; P=0.037) and PB (median: 0.0002 vs. <0.00001; P=0.04) compared to healthy controls (Figure 1A). Moreover, IGFBP2 serum protein levels were significantly higher in AML patients compared to controls (median: 608 ng/ml vs. 180 ng/ml; P=0.002; Figure 1B). BM IGFBP2 mRNA expression was positively correlated with IGFBP2 serum protein levels (r=0.6; P=0.007). In contrast, BM and PB IGFBP2 mRNA expression levels were not significantly correlated (r=0.5; P=0.08), probably due to a high variation of the peripheral blast counts. BMSC showed about a 6-fold higher expression of IGFBP2 compared to hematopoietic cells, with no significant difference between BMSC derived from AML patients and healthy donors (median: 0.39 vs. 0.43; P=0.86; Figure 1A). Thus, elevated IGFBP2 serum protein levels found in AML patients might result from the high expression of IGFBP2 in leukemic blasts. Of note, the comparison of AML patients and healthy controls is potentially biased by differences in age (patients: mean 56 years; controls: mean 40 years) and different cell compositions in the BM samples (presumably more lymphocytes, monocytes, plasma cells, and differentiated myeloid cells in the control samples).
Figure 1. IGFBP2 expression in AML patients and healthy controls.
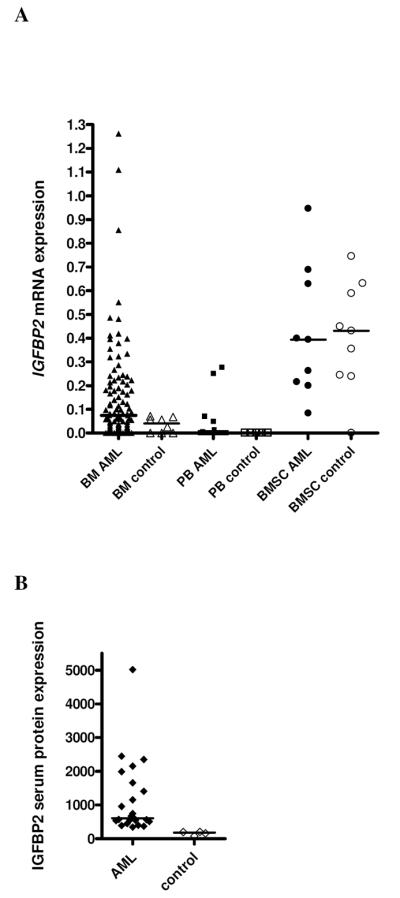
(A) mRNA expression (2μ(ΔCT)). (B) Serum protein levels (ng/ml).
IGFBP2 expression with respect to clinical and molecular characteristics
Patients were divided into IGFBP2 high (Q4) and IGFBP2 low (Q1–3) expression groups according to IGFBP2 BM mRNA expression levels as described in the statistical section. Low IGFBP2 expression was associated with FAB M4/M5 subtypes (P=0.008; Table 1). No other significant correlations with clinical or genetic characteristics were found between the IGFBP2 expression groups (Table 1). Furthermore, there was no significant difference regarding therapy regimens applied in high and low IGFBP2 expressers (Table 1).
Table 1.
Clinical and molecular characteristics of AML patients according to IGFBP2 expression groups
| Characteristic | IGFBP2 low n = 74 | IGFBP2 high n = 25 | P |
|---|---|---|---|
| Age [years] | 0.82 | ||
| Median | 58 | 57 | |
| Range | 23–80 | 19–79 | |
| Sex [%] | 0.35 | ||
| Male | 56 | 68 | |
| Leukocyte count [× 109/L] | 0.22 | ||
| Median | 7 | 31 | |
| Range | 0.5–368 | 0.5–385 | |
| LDH >350 U/l [%] | 57 | 60 | 0.82 |
| sAML [%] | 32 | 20 | 0.31 |
| BAALC expression, high [%]† | 49 | 53 | 1.0 |
| FAB Classification [no. (%)], n=89 | 66 | 23 | 0.04 |
| M0 | 5 (8) | 0 (0) | |
| M1 | 7 (11) | 5 (22) | |
| M2 | 8 (12) | 7 (30) | |
| M4eo | 4 (6) | 2 (9) | |
| M4 | 19 (29) | 4 (17) | |
| M5 | 20 (30) | 1 (4) | |
| M6 | 3 (5) | 3 (13) | |
| M7 | 0 (0) | 1 (4) | |
| FAB M4/M5 | 39 (59) | 5 (22) | 0.008 |
| Genetic risk groups‡ [no. (%)], n=91 | 68 | 23 | 0.90 |
| Favourable | 8 (12) | 4 (17) | 0.49 |
| Intermediate-I | 29 (43) | 10 (44) | 1.0 |
| Intermediate-II | 11 (16) | 3 (13) | 1.0 |
| Adverse | 20 (29) | 6 (26) | 1.0 |
| Therapy [no. (%)] | |||
| AML 2003 SAL | 40 (54) | 14 (56) | 1.0 |
| AML SORAML SAL | 13 (18) | 5 (20) | 0.77 |
| AML 2004 OSHO #069 | 21 (28) | 6 (24) | 0.80 |
| Allogeneic SCT | 30 (41) | 10 (40) | 1.0 |
| In CR1 | 13 (43) | 1 (10) | 0.07 |
FAB: French-American-British, SCT: stem cell transplantation, CR: complete remission.
According to median expression level; n=62.
According to ELN classification.
IGFBP2 expression and outcome in AML patients
High IGFBP2 expression was significantly associated with a higher incidence of primary resistant disease (IGFBP2 high 65%, IGFBP2 low 32%; P=0.02) and with a lower CR rate (IGFBP2 high 28%, IGFBP2 low 59%; P=0.01; Table 2). In multivariate analyses, high IGFBP2 expression was independently predictive for resistant disease [OR 3.6 (95% CI 1.2–11); P=0.02] and achievement of CR [OR 0.3 (95% CI 0.09–0.8); P=0.01; Table 3]. The only other significant variable was presence of sAML. There were no significant differences regarding deaths in induction therapy (P=0.52; Table 2), deaths in CR (P=1.0), relapse rate (P=0.66), RFS (P=0.67; data not shown), or OS (P=0.53; Table 2) between the IGFBP2 expression groups. No significant differences were observed in subgroup analyses stratifying for age and treatment protocols. Similar results regarding OS and RFS were obtained when patients who received allogeneic SCT were not censored at the time of transplantation (data not shown).
Table 2.
Clinical outcome according to IGFBP2 mRNA expression
| Clinical Outcome | IGFBP2 low | IGFBP2 high | P |
|---|---|---|---|
| Resistant disease† | |||
| Resistant/total [no. (%)] | 20/63 (32) | 13/20 (65) | 0.02 |
| Complete remission rate‡ | |||
| CR/total [no. (%)] | 43/73 (59) | 7/25 (28) | 0.01 |
| Death in induction therapy‡ | |||
| Death/total [no. (%)] | 10/73 (14) | 5/25 (20) | 0.52 |
| Relapse rate$ | |||
| Relapse/total [no. (%)] | 12/25 (48) | 2/6 (33) | 0.66 |
| Median remission duration¶ | |||
| [years (95% CI)] | 2.8 (1.9–3.8) | 3.0 (1.4–4.7) | 0.67 |
| Overall survival¶¶ | 0.53 | ||
| Alive at 2 years [% (95% CI)] | 57 (39–75) | 48 (18–78) | |
| Median survival [years (95% CI)] | 3.3 (2.5–4.2) | 2.8 (1.6–4.1) |
CR: complete remission, CI: confidence interval.
N=83. One patient who did not complete induction therapy and 15 patients who died during induction therapy were excluded.
N=98. One patient who did not complete induction therapy was excluded.
N=31. Patients who received SCT in first CR were excluded.
N=49. Patients who received SCT in first CR were censored at the time of transplantation.
N=98. One patient with development of second neoplasia was excluded. Patients who received SCT in first CR were censored at the time of transplantation.
Table 3.
Multivariate analysis of IGFBP2 mRNA expression for response to induction therapy
| Variable† | OR | 95% CI | P |
|---|---|---|---|
| Resistant disease | |||
| IGFBP2 high vs. low | 3.6 | 1.2–11 | 0.02 |
| sAML | 3.1 | 1.1–8.8 | 0.04 |
| CR | |||
| IGFBP2 high vs. low | 0.3 | 0.09–0.8 | 0.01 |
| sAML | 0.3 | 0.09–0.7 | 0.01 |
OR: odds ratio, CI: confidence interval, CR: complete remission.
Variables considered for model inclusion are described in the statistical section. The final model is shown.
IGFBP2-associated GEP in CN-AML
To gain insights into the underlying biological pathways of IGFBP2 and its potential role in drug resistance, a microarray-based GEP analysis using an independent cohort of 61 patients with CN-AML treated on the CALGB protocol 9621 [21] was performed. Samples were grouped into high and low IGFBP2 (q4 vs. q1) according to the microarray expression data as described in the statistical section. The median IGFBP2 probe set expression was 60-fold higher in q4 as compared to q1. Between the two IGFBP2 expression groups, 576 differentially expressed probe sets corresponding to 415 genes and hypothetical proteins were identified (Figure 2). Among these, 181 were up-regulated and 234 were down-regulated (Table S1).
Figure 2. Heat map of differentially expressed probe sets between high and lowIGFBP2 expression groups.

Columns represent samples ordered by IGFBP2 expression and rows represent genes ordered by hierarchical cluster analysis. Colors indicate relative expression of each gene with respect to the median expression level (red above, yellow equal, blue below the median value).
Up-regulated genes in patients with high IGFBP2 expression included genes that were previously shown to be up-regulated in high-risk leukemic subgroups including FLT3-ITD AML (MEIS1, HOXB3, WT1) [22], MLL-rearranged leukemias (HOXA9, MYB, MEIS1) [23–25], and BCR-ABL ALL (CTNND1) [26]. Moreover, the transcription factor ERG, an adverse prognostic factor in acute leukemias [21, 27], was found to be up-regulated in the high IGFBP2 group. Differentially down-regulated genes in patients with high IGFBP2 expression included putative tumor suppressor genes (CEBPD, G0S2, KLF4, KLF11) [28–31], and the growth regulation and DNA repair gene GADD45B. Among the down-regulated genes we further identified RGS2 that has been associated with a favourable outcome in AML [32]. This IGFBP2-derived GEP signature indicates a more aggressive, resistant leukemic phenotype associated with high IGFBP2 expression.
Discussion
The identification of prognostic factors and aberrant signaling pathways in AML is important for the development of new molecular therapies and might improve risk-adapted therapeutic strategies for AML patients. Here, we have demonstrated aberrant expression of IGFBP2 in adult AML and identified overexpression of IGFBP2 as a novel marker for chemoresistance in these patients. High IGFBP2 expression independently predicted primary therapy resistance and achievement of CR in adult AML patients. The risk for primary resistant disease was about 4-fold higher in patients with high IGFBP2 expression compared to low IGFBP2 expressers.
High IGFBP2 expression has already been associated with inferior EFS and a higher relapse rate in children with AML in small studies with less than 40 patients [10, 12]. In adult AML, high levels of IGFBP2 serum protein have been related to an inferior response to induction therapy in a study of 22 patients [33]. Here, we have for the first time evaluated the prognostic significance of IGFBP2 mRNA expression in adult AML. Our results strengthen the association of IGFBP2 expression on chemotherapy resistance in acute leukemias.
The role of IGFBP2 in cancer cells is still poorly understood. In vitro studies have demonstrated both inhibitory and stimulatory effects of IGFBP2 protein on cell growth in different tumor cells [8]. The impact of IGFBP2 on leukemic cells has not been evaluated yet. Elmlinger et al. found that secretion of IGFBP2 protein is induced by autocrine expression of IGF-II in leukemic T-cells [34]. It has been postulated that IGFBP2 may provide a storage pool of IGFs in the BM microenvironment resulting in a growth advantage of leukemic cells [9]. Thus, elevated IGFBP2 expression in leukemic blasts could either be an epiphenomenon of an activated IGF pathway or might be directly involved in a pathogenetic role of aberrant IGF signaling in acute leukemias.
To elucidate the biological function of IGFBP2 in AML, we analyzed an IGFBP2-associated GEP in an independent cohort of CN-AML. Patients with high IGFBP2 expression revealed an up-regulation of MYB, MEIS1, HOXB3, and HOXA9, genes that are known to collaborate in leukemic transformation [24, 35, 36], while putative tumor suppressor genes (CEBPD, G0S2, KLF4, KLF11) [28–31] were down-regulated. Interestingly, one of the markedly up-regulated genes in the high IGFBP2 group was WT1, a gene considered as a downstream target of IGF-I [37]. Overexpression and mutations of the WT1 gene have been associated with adverse outcome in AML and ALL patients [38–40]. WT1 was shown to be highly expressed in chemoresistant leukemic stem cells [41] and WT1 mutations have been associated with resistant disease in CN-AML [42]. Surprisingly, we did not find up-regulation of other IGF target genes on the mRNA expression level; this however does not exclude that activation of downstream targets occurred on the protein level not captures by GEP.
High IGFBP2 expression was also associated with up-regulation of ERG, an independent adverse prognostic factor both in CN-AML [21] and T-ALL [27]. The two Krüppel-like transcription factor family members KLF4 and KLF11 were among the down-regulated genes in the high IGFBP2 group. KLF4 has been reported to induce cell-cycle arrest and apoptosis in leukemic cells [30] and was found hypermethylated in adult T-cell leukemia [43]. KLF11, also a negative regulator of cell growth [31], was shown to be frequently epigenetically inactivated in patients with MDS [44]. Among the down-regulated genes we further found RGS2, previously reported to be down-regulated in B-precursor ALL patients with high BAALC expression and a high incidence of resistant disease [45].
Hence, the IGFBP2-derived GEP signature marks a chemoresistant and proliferative subgroup of CN-AML patients less than 60 years of age. This data supports the clinical finding of a resistant leukemic phenotype associated with high IGFBP2 expression in our more heterogeneous AML patient cohort that differs in cytogenetic features and age. Our results are further highlighted by the overlap of the IGFBP2-associated GEP with expression profiles derived from other high-risk subgroups like FLT3-ITD, MLL-rearrangement, BCR-ABL, or leukemias with high BAALC expression. The differentially expressed candidate genes found in patients with high IGFBP2 expression might provide a basis for further investigating the functional role of IGFBP2 in acute leukemias.
These high-risk patients characterized by high IGFBP2 expression should be considered for new molecular drugs, particularly drugs targeting the IGF pathway [6], to overcome primary therapy resistance. In recent years, different prognostic markers that could potentially direct new therapeutic strategies have been identified in AML, like OGG1 [46], CXCR4 [47], ANG-2 [48], or heat shock proteins [49]. With the increasing number of molecular markers, prospective studies are needed to investigate the independent prognostic significance of each new marker in relation to other molecular markers and known risk factors and to evaluate the predictive value of these markers for specific therapies.
In conclusion, this is the first study evaluating IGFBP2 expression in adult AML with respect to clinical features, therapy response, and gene-expression profiling. Our data support a role of IGFBP2 and IGF signaling in chemoresistance of AML. Determination of IGFBP2 expression might help to allocate AML patients with an unfavourable chemotherapy response to alternative first line treatment protocols. The prognostic significance of IGFBP2 in adult AML will have to be further evaluated in larger prospective trials.
Supplementary Material
Acknowledgements
This study was supported by a grant from the Gutermuth Stiftung to C.D. Baldus and grants no. CA140158 and CA101140 from the U.S. National Cancer Institute and the Coleman Leukemia Research Foundation. We want to thank Liliana Mochmann for critical reading of the manuscript.
Footnotes
Publisher's Disclaimer: This is a PDF file of an unedited manuscript that has been accepted for publication. As a service to our customers we are providing this early version of the manuscript. The manuscript will undergo copyediting, typesetting, and review of the resulting proof before it is published in its final citable form. Please note that during the production process errors may be discovered which could affect the content, and all legal disclaimers that apply to the journal pertain.
Contributions: A.K.: performed research, analyzed data, and wrote the manuscript; M.K., L.F., S.H.: contributed to the analysis of this study; M.N., M.R.: contributed to the GEP analysis; G.M.: provided GEP data; C.D.B.: provided GEP data, contributed to the analysis of this study, and to the writing of this manuscript; W.-K.H.: contributed to the analysis of this study and to the writing of this manuscript; E.T.: contributed to the writing of this manuscript; C.D.Baldus.: contributed to the design of the research, the analysis of this study, and to the writing of this manuscript.
Conflict-of-interest disclosure: The authors declare no competing financial interests.
References
- 1.Rowe JM, Tallman MS. How I treat acute myeloid leukemia. Blood. 2010;116:3147–56. doi: 10.1182/blood-2010-05-260117. [DOI] [PubMed] [Google Scholar]
- 2.LeRoith D, Roberts CT., Jr The insulin-like growth factor system and cancer. Cancer Lett. 2003;195:127–37. doi: 10.1016/s0304-3835(03)00159-9. [DOI] [PubMed] [Google Scholar]
- 3.Shimon I, Shpilberg O. The insulin-like growth factor system in regulation of normal and malignant hematopoiesis. Leuk Res. 1995;19:233–40. doi: 10.1016/0145-2126(94)00133-u. [DOI] [PubMed] [Google Scholar]
- 4.Doepfner KT, Spertini O, Arcaro A. Autocrine insulin-like growth factor-I signaling promotes growth and survival of human acute myeloid leukemia cells via the phosphoinositide 3-kinase/Akt pathway. Leukemia. 2007;21:1921–30. doi: 10.1038/sj.leu.2404813. [DOI] [PubMed] [Google Scholar]
- 5.Baier TG, Jenne EW, Blum W, Schonberg D, Hartmann KK. Influence of antibodies against IGF-I, insulin or their receptors on proliferation of human acute lymphoblastic leukemia cell lines. Leuk Res. 1992;16:807–14. doi: 10.1016/0145-2126(92)90160-9. [DOI] [PubMed] [Google Scholar]
- 6.Chapuis N, Tamburini J, Cornillet-Lefebvre P, Gillot L, Bardet V, Willems L, et al. Autocrine IGF-1/IGF-1R signaling is responsible for constitutive PI3K/Akt activation in acute myeloid leukemia: therapeutic value of neutralizing anti-IGF-1R antibody. Haematologica. 2009;95:415–23. doi: 10.3324/haematol.2009.010785. [DOI] [PMC free article] [PubMed] [Google Scholar]
- 7.Pollak MN, Schernhammer ES, Hankinson SE. Insulin-like growth factors and neoplasia. Nat Rev Cancer. 2004;4:505–18. doi: 10.1038/nrc1387. [DOI] [PubMed] [Google Scholar]
- 8.Hoeflich A, Reisinger R, Lahm H, Kiess W, Blum WF, Kolb HJ, et al. Insulin-like growth factor-binding protein 2 in tumorigenesis: protector or promoter? Cancer Res. 2001;61:8601–10. [PubMed] [Google Scholar]
- 9.Wex H, Vorwerk P, Mohnike K, Bretschneider D, Kluba U, Aumann V, et al. Elevated serum levels of IGFBP-2 found in children suffering from acute leukaemia is accompanied by the occurrence of IGFBP-2 mRNA in the tumour clone. Br J Cancer. 1998;78:515–20. doi: 10.1038/bjc.1998.525. [DOI] [PMC free article] [PubMed] [Google Scholar]
- 10.Dawczynski K, Steinbach D, Wittig S, Pfaffendorf N, Kauf E, Zintl F. Expression of components of the IGF axis in childhood acute myelogenous leukemia. Pediatr Blood Cancer. 2008;50:24–8. doi: 10.1002/pbc.21294. [DOI] [PubMed] [Google Scholar]
- 11.Bubendorf L, Kolmer M, Kononen J, Koivisto P, Mousses S, Chen Y, et al. Hormone therapy failure in human prostate cancer: analysis by complementary DNA and tissue microarrays. J Natl Cancer Inst. 1999;91:1758–64. doi: 10.1093/jnci/91.20.1758. [DOI] [PubMed] [Google Scholar]
- 12.Hattori H, Matsuzaki A, Suminoe A, Koga Y, Tashiro K, Hara T. Identification of novel genes with prognostic value in childhood leukemia using cDNA microarray and quantitative RT-PCR. Pediatr Hematol Oncol. 2006;23:115–27. doi: 10.1080/08880010500457780. [DOI] [PubMed] [Google Scholar]
- 13.Dawczynski K, Kauf E, Schlenvoigt D, Gruhn B, Fuchs D, Zintl F. Elevated serum insulin-like growth factor binding protein-2 is associated with a high relapse risk after hematopoietic stem cell transplantation in childhood AML. Bone Marrow Transplant. 2006;37:589–94. doi: 10.1038/sj.bmt.1705281. [DOI] [PubMed] [Google Scholar]
- 14.Vorwerk P, Mohnike K, Wex H, Rohl FW, Zimmermann M, Blum WF, et al. Insulin-like growth factor binding protein-2 at diagnosis of childhood acute lymphoblastic leukemia and the prediction of relapse risk. J Clin Endocrinol Metab. 2005;90:3022–7. doi: 10.1210/jc.2004-0461. [DOI] [PubMed] [Google Scholar]
- 15.Dohner H, Estey EH, Amadori S, Appelbaum FR, Buchner T, Burnett AK, et al. Diagnosis and management of acute myeloid leukemia in adults: recommendations from an international expert panel, on behalf of the European LeukemiaNet. Blood. 2010;115:453–74. doi: 10.1182/blood-2009-07-235358. [DOI] [PubMed] [Google Scholar]
- 16.European Leukemia Net European Leukemia Trial Registry. http://www.leukemia-net.org/content/leukemias/aml/aml_trials/database/
- 17.Thiede C, Steudel C, Mohr B, Schaich M, Schakel U, Platzbecker U, et al. Analysis of FLT3-activating mutations in 979 patients with acute myelogenous leukemia: association with FAB subtypes and identification of subgroups with poor prognosis. Blood. 2002;99:4326–35. doi: 10.1182/blood.v99.12.4326. [DOI] [PubMed] [Google Scholar]
- 18.Thiede C, Koch S, Creutzig E, Steudel C, Illmer T, Schaich M, et al. Prevalence and prognostic impact of NPM1 mutations in 1485 adult patients with acute myeloid leukemia (AML) Blood. 2006;107:4011–20. doi: 10.1182/blood-2005-08-3167. [DOI] [PubMed] [Google Scholar]
- 19.Baldus CD, Thiede C, Soucek S, Bloomfield CD, Thiel E, Ehninger G. BAALC expression and FLT3 internal tandem duplication mutations in acute myeloid leukemia patients with normal cytogenetics: prognostic implications. J Clin Oncol. 2006;24:790–7. doi: 10.1200/JCO.2005.01.6253. [DOI] [PubMed] [Google Scholar]
- 20.Blau O, Hofmann WK, Baldus CD, Thiel G, Serbent V, Schumann E, et al. Chromosomal aberrations in bone marrow mesenchymal stroma cells from patients with myelodysplastic syndrome and acute myeloblastic leukemia. Exp Hematol. 2007;35:221–9. doi: 10.1016/j.exphem.2006.10.012. [DOI] [PubMed] [Google Scholar]
- 21.Marcucci G, Baldus CD, Ruppert AS, Radmacher MD, Mrozek K, Whitman SP, et al. Overexpression of the ETS-related gene, ERG, predicts a worse outcome in acute myeloid leukemia with normal karyotype: a Cancer and Leukemia Group B study. J Clin Oncol. 2005;23:9234–42. doi: 10.1200/JCO.2005.03.6137. [DOI] [PubMed] [Google Scholar]
- 22.Whitman SP, Maharry K, Radmacher MD, Becker H, Mrozek K, Margeson D, et al. FLT3 internal tandem duplication associates with adverse outcome and gene- and microRNA-expression signatures in patients 60 years of age or older with primary cytogenetically normal acute myeloid leukemia: a Cancer and Leukemia Group B study. Blood. 2010;116:3622–6. doi: 10.1182/blood-2010-05-283648. [DOI] [PMC free article] [PubMed] [Google Scholar]
- 23.Faber J, Krivtsov AV, Stubbs MC, Wright R, Davis TN, van den Heuvel-Eibrink M, et al. HOXA9 is required for survival in human MLL-rearranged acute leukemias. Blood. 2009;113:2375–85. doi: 10.1182/blood-2007-09-113597. [DOI] [PMC free article] [PubMed] [Google Scholar]
- 24.Jin S, Zhao H, Yi Y, Nakata Y, Kalota A, Gewirtz AM. c-Myb binds MLL through menin in human leukemia cells and is an important driver of MLL-associated leukemogenesis. J Clin Invest. 2010;120:593–606. doi: 10.1172/JCI38030. [DOI] [PMC free article] [PubMed] [Google Scholar]
- 25.Kumar AR, Li Q, Hudson WA, Chen W, Sam T, Yao Q, et al. A role for MEIS1 in MLL-fusion gene leukemia. Blood. 2009;113:1756–8. doi: 10.1182/blood-2008-06-163287. [DOI] [PMC free article] [PubMed] [Google Scholar]
- 26.Juric D, Lacayo NJ, Ramsey MC, Racevskis J, Wiernik PH, Rowe JM, et al. Differential gene expression patterns and interaction networks in BCR-ABL-positive and -negative adult acute lymphoblastic leukemias. J Clin Oncol. 2007;25:1341–9. doi: 10.1200/JCO.2006.09.3534. [DOI] [PubMed] [Google Scholar]
- 27.Baldus CD, Burmeister T, Martus P, Schwartz S, Gokbuget N, Bloomfield CD, et al. High expression of the ETS transcription factor ERG predicts adverse outcome in acute T-lymphoblastic leukemia in adults. J Clin Oncol. 2006;24:4714–20. doi: 10.1200/JCO.2006.06.1580. [DOI] [PubMed] [Google Scholar]
- 28.Huang AM, Montagna C, Sharan S, Ni Y, Ried T, Sterneck E. Loss of CCAAT/enhancer binding protein delta promotes chromosomal instability. Oncogene. 2004;23:1549–57. doi: 10.1038/sj.onc.1207285. [DOI] [PubMed] [Google Scholar]
- 29.Welch C, Santra MK, El-Assaad W, Zhu X, Huber WE, Keys RA, et al. Identification of a protein, G0S2, that lacks Bcl-2 homology domains and interacts with and antagonizes Bcl-2. Cancer Res. 2009;69:6782–9. doi: 10.1158/0008-5472.CAN-09-0128. [DOI] [PMC free article] [PubMed] [Google Scholar]
- 30.Kharas MG, Yusuf I, Scarfone VM, Yang VW, Segre JA, Huettner CS, et al. KLF4 suppresses transformation of pre-B cells by ABL oncogenes. Blood. 2007;109:747–55. doi: 10.1182/blood-2006-03-011106. [DOI] [PMC free article] [PubMed] [Google Scholar]
- 31.Fernandez-Zapico ME, Mladek A, Ellenrieder V, Folch-Puy E, Miller L, Urrutia R. An mSin3A interaction domain links the transcriptional activity of KLF11 with its role in growth regulation. Embo J. 2003;22:4748–58. doi: 10.1093/emboj/cdg470. [DOI] [PMC free article] [PubMed] [Google Scholar]
- 32.Schwable J, Choudhary C, Thiede C, Tickenbrock L, Sargin B, Steur C, et al. RGS2 is an important target gene of Flt3-ITD mutations in AML and functions in myeloid differentiation and leukemic transformation. Blood. 2005;105:2107–14. doi: 10.1182/blood-2004-03-0940. [DOI] [PubMed] [Google Scholar]
- 33.El-Naggar AA, Mahmoud BF, Abou Shamaa LA, Salama MA. Changes of serum growth factors (IGF-I & IGFBP-2) and prediction of response to chemotherapy in patients with acute myeloid leukemia. Egypt J Immunol. 2008;15:73–80. [PubMed] [Google Scholar]
- 34.Elmlinger MW, Sanatani MS, Bell M, Dannecker GE, Ranke MB. Elevated insulin-like growth factor (IGF) binding protein (IGFBP)-2 and IGFBP-4 expression of leukemic T-cells is affected by autocrine/paracrine IGF-II action but not by IGF type I receptor expression. Eur J Endocrinol. 1998;138:337–43. doi: 10.1530/eje.0.1380337. [DOI] [PubMed] [Google Scholar]
- 35.Kroon E, Krosl J, Thorsteinsdottir U, Baban S, Buchberg AM, Sauvageau G. Hoxa9 transforms primary bone marrow cells through specific collaboration with Meis1a but not Pbx1b. Embo J. 1998;17:3714–25. doi: 10.1093/emboj/17.13.3714. [DOI] [PMC free article] [PubMed] [Google Scholar]
- 36.Thorsteinsdottir U, Kroon E, Jerome L, Blasi F, Sauvageau G. Defining roles for HOX and MEIS1 genes in induction of acute myeloid leukemia. Mol Cell Biol. 2001;21:224–34. doi: 10.1128/MCB.21.1.224-234.2001. [DOI] [PMC free article] [PubMed] [Google Scholar]
- 37.Bentov I, LeRoith D, Werner H. The WT1 Wilms' tumor suppressor gene: a novel target for insulin-like growth factor-I action. Endocrinology. 2003;144:4276–9. doi: 10.1210/en.2003-0400. [DOI] [PubMed] [Google Scholar]
- 38.Garg M, Moore H, Tobal K, Liu Yin JA. Prognostic significance of quantitative analysis of WT1 gene transcripts by competitive reverse transcription polymerase chain reaction in acute leukaemia. Br J Haematol. 2003;123:49–59. doi: 10.1046/j.1365-2141.2003.04552.x. [DOI] [PubMed] [Google Scholar]
- 39.Paschka P, Marcucci G, Ruppert AS, Whitman SP, Mrozek K, Maharry K, et al. Wilms' tumor 1 gene mutations independently predict poor outcome in adults with cytogenetically normal acute myeloid leukemia: a cancer and leukemia group B study. J Clin Oncol. 2008;26:4595–602. doi: 10.1200/JCO.2007.15.2058. [DOI] [PMC free article] [PubMed] [Google Scholar]
- 40.Heesch S, Goekbuget N, Stroux A, Tanchez JO, Schlee C, Burmeister T, et al. Prognostic implications of mutations and expression of the Wilms tumor 1 (WT1) gene in adult acute T-lymphoblastic leukemia. Haematologica. 2010;95:942–9. doi: 10.3324/haematol.2009.016386. [DOI] [PMC free article] [PubMed] [Google Scholar]
- 41.Saito Y, Kitamura H, Hijikata A, Tomizawa-Murasawa M, Tanaka S, Takagi S, et al. Identification of therapeutic targets for quiescent, chemotherapy-resistant human leukemia stem cells. Sci Transl Med. 2010;2:17–9. doi: 10.1126/scitranslmed.3000349. [DOI] [PMC free article] [PubMed] [Google Scholar]
- 42.Virappane P, Gale R, Hills R, Kakkas I, Summers K, Stevens J, et al. Mutation of the Wilms' tumor 1 gene is a poor prognostic factor associated with chemotherapy resistance in normal karyotype acute myeloid leukemia: the United Kingdom Medical Research Council Adult Leukaemia Working Party. J Clin Oncol. 2008;26:5429–35. doi: 10.1200/JCO.2008.16.0333. [DOI] [PubMed] [Google Scholar]
- 43.Yasunaga J, Taniguchi Y, Nosaka K, Yoshida M, Satou Y, Sakai T, et al. Identification of aberrantly methylated genes in association with adult T-cell leukemia. Cancer Res. 2004;64:6002–9. doi: 10.1158/0008-5472.CAN-04-1422. [DOI] [PubMed] [Google Scholar]
- 44.Potapova A, Hasemeier B, Romermann D, Metzig K, Gohring G, Schlegelberger B, et al. Epigenetic inactivation of tumour suppressor gene KLF11 in myelodysplastic syndromes. Eur J Haematol. 2010;84:298–303. doi: 10.1111/j.1600-0609.2009.01389.x. [DOI] [PubMed] [Google Scholar]
- 45.Kühnl A, Gökbuget N, Stroux A, Burmeister T, Neumann M, Heesch S, et al. High BAALC expression predicts chemoresistance in adult B-precursor acute lymphoblastic leukemia. Blood. 2010;115:3737–44. doi: 10.1182/blood-2009-09-241943. [DOI] [PubMed] [Google Scholar]
- 46.Liddiard K, Hills R, Burnett AK, Darley RL, Tonks A. OGG1 is a novel prognostic indicator in acute myeloid leukaemia. Oncogene. 2010;29:2005–12. doi: 10.1038/onc.2009.462. [DOI] [PubMed] [Google Scholar]
- 47.Tavernier-Tardy E, Cornillon J, Campos L, Flandrin P, Duval A, Nadal N, et al. Prognostic value of CXCR4 and FAK expression in acute myelogenous leukemia. Leuk Res. 2009;33:764–8. doi: 10.1016/j.leukres.2008.10.014. [DOI] [PubMed] [Google Scholar]
- 48.Hou HA, Chou WC, Lin LI, Tang JL, Tseng MH, Huang CF, et al. Expression of angiopoietins and vascular endothelial growth factors and their clinical significance in acute myeloid leukemia. Leuk Res. 2008;32:904–12. doi: 10.1016/j.leukres.2007.08.010. [DOI] [PubMed] [Google Scholar]
- 49.Thomas X, Campos L, Mounier C, Cornillon J, Flandrin P, Le QH, et al. Expression of heat-shock proteins is associated with major adverse prognostic factors in acute myeloid leukemia. Leuk Res. 2005;29:1049–58. doi: 10.1016/j.leukres.2005.02.010. [DOI] [PubMed] [Google Scholar]
Associated Data
This section collects any data citations, data availability statements, or supplementary materials included in this article.