

Abstract
Complex I (CI) of the electron transport chain, a large membrane-embedded NADH dehydrogenase, couples electron transfer to the release of protons into the mitochondrial inner membrane space to promote ATP production through ATP synthase. In addition to being a central conduit for ATP production, CI activity has been linked to neurodegenerative disorders, including Parkinson's disease. CI is built in a stepwise fashion through the actions of several assembly factors. We employed interaction proteomics to interrogate the molecular associations of 15 core subunits and assembly factors previously linked to human CI deficiency, resulting in a network of 101 proteins and 335 interactions (edges). TIMMDC1, a predicted 4-pass membrane protein, reciprocally associated with multiple members of the MCIA CI assembly factor complex and core CI subunits and was localized in the mitochondrial inner membrane, and its depletion resulted in reduced CI activity and cellular respiration. Quantitative proteomics demonstrated a role for TIMMDC1 in assembly of membrane-embedded and soluble arms of the complex. This study defines a new membrane-embedded CI assembly factor and provides a resource for further analysis of CI biology.
INTRODUCTION
In mammals, the primary source of cellular ATP is oxidative phosphorylation (OXPHOS), a process controlled by five macromolecular complexes embedded in the mitochondrial inner membrane. Complexes I to IV (CI to CIV) function in electron transport in a process that converts molecular oxygen to water and creates a pH gradient across the inner mitochondrial membrane that is used to drive ATP synthesis from ADP and inorganic phosphate via complex V (ATP synthase). Complex I (NADH dehydrogenase) and complex II (succinate dehydrogenase) employ NADH and succinate as electron donors, respectively, and transfer these electrons to ubiquinone. Complex III (coenzyme Q-cytochrome c reductase) employs ubiquinol to reduce cytochrome c, and electrons in the reduced cytochrome c are then used by complex IV (cytochrome c oxidase) to reduce molecular oxygen to water. Reactions catalyzed by CI, CIII, and CIV result in the release of protons in the inner membrane space, thereby creating the proton gradient needed for ATP synthase activity (1). Accumulating evidence suggests that CI, CIII, and CIV interact to form a supercomplex, which increases electron transport chain (ETC) efficiency (2, 3). Environmental toxins, such as rotenone, that inhibit CI have been linked to idiopathic forms of Parkinson's disease.
Mammalian CI is the largest and arguably the most complex component of the ETC. Previous studies have identified 44 subunits in an ∼1-MDa complex, 7 of which are encoded by the mitochondrial genome (4). Much of our structural understanding of CI is based on high-resolution structures of Thermus thermophilus CI (5) and of a lower resolution structure of the complex from Yarrowia lipolytica yeast (6). Broadly speaking, CI is composed of hydrophilic (matrix) and hydrophobic (membrane) arms. The hydrophilic matrix arm houses both the N module, responsible for binding and oxidizing NADH, and the Q module, which transfers electrons to ubiquinone (7). The N-Q module interacts with the hydrophobic membrane-embedded P module, which binds ubiquinone and pumps protons into the inner membrane space (7). All of the mitochondrial-DNA-encoded CI subunits are components of the P module (7). The formation of CI involves distinct subcomplexes that assemble through the actions of several assembly factors in discrete steps and involves assembly of proteins, both within the membrane and in the soluble phase (8–10). A variety of studies have examined assembly intermediates and the involvement of particular components in the process (11). These data have been integrated into a more refined model that takes into account data from multiple studies and proposes roles for various assembly factors in the sequential formation and integration of CI modules (11). However, the structural and mechanistic basis for assembly of intermediates and how specificity is achieved remain poorly understood.
Given this complexity and the critical role of CI in the ETC, it is not surprising that numerous mitochondrial diseases, such as Leigh's syndrome, result from mutations in mitochondrial DNA (mtDNA)- or nuclear-DNA-encoded CI subunits, as well as assembly factors (12). Thus far, at least 33 genes encoding either CI subunits or assembly factors have been associated with genetic defects in CI deficiency (13). They include the genes encoding NDUFAF1, NDUFAF2, NDUFAF3, NDUFAF4, and ACAD9 (1, 13), which function in various assembly steps. Moreover, additional components required for CI function have been recently identified using either sequencing-based candidate gene discovery (e.g., FOXRED1 and C20orf7) (14) or “complexome” proteomics profiling of mitochondrial proteins (TMEM126B) (15). To further explore CI architecture and assembly, we performed an interaction proteomics-based analysis of CI disease genes, including 15 core subunits or assembly factors. This analysis resulted in the development of a CI interaction landscape containing 101 proteins and 335 interactions (edges), including significant connectivity between assembly factors and core subunits. Among the previously unrecognized proteins was TIMMDC1 (also called C3orf1), which was found to reciprocally associate with multiple components of the ECSIT-TMEM126B-ACAD9-NDUFAF1 assembly factor complex (MCIA complex), as well as subunits of the soluble and matrix arms. TIMMDC1, a predicted 4-pass transmembrane protein with sequence similarity to the TIM17-TIM22-TIM23 protein family, localized to the mitochondrial inner membrane but did not associate with components of the inner membrane translocon (TIMM17 or TIMM23) in our immunoprecipitation (IP)-mass spectrometry (MS) analysis, and its depletion did not affect the architecture of the inner translocon complex. To examine the hypothesis that TIMMDC1 functions together with the MCIA complex in CI assembly, we coupled stable isotopic labeling by amino acids in culture (SILAC) with size-based fractionation of mitochondria purified from cells with or without TIMMDC1, thereby providing a quantitative view of CI assembly and intermediates. We found that depletion of TIMMDC1 leads to accumulation of CI subcomplexes characteristic of defects in MCIA, with ensuing defects in CI activity and cellular respiration and decreased stability of a subset of CI subunits. This work identifies a previously unrecognized transmembrane component of the MCIA complex required for assembly of functional CI and provides a resource for further analysis of CI architecture and assembly.
MATERIALS AND METHODS
Cell culture and flow cytometry.
HCT116, HeLa, and HEK293T cells were grown in Dulbecco's modified Eagle's medium (DMEM) supplemented with 10% fetal calf serum (FCS) and maintained in a 5% CO2 incubator at 37°C. Mitochondrial mass was measured by flow cytometry, using Mitotracker green FM (Invitrogen) to label mitochondria. Mitochondrial polarization was measured by flow cytometry using Mitotracker Red CMXRos (Invitrogen) to detect depolarized mitochondria.
Cell line generation and plasmid and siRNA transfections.
For plasmid transfection, Lipofectamine 2000 (Invitrogen) or X-tremeGene HP DNA Transfection reagent (Roche) was used for transfection of HeLa or HCT116 cells, and TransIT-293 (Mirus) was used for transfection of HEK293T cells according to the manufacturers' specifications. The transfected cells were harvested ∼48 h posttransfection for further analysis. Viral particles were generated in HEK293T cells through the transfection of a pHAGE lentiviral vector (16) containing the gene of interest and a C-terminal hemagglutinin (HA)-Flag tag and four helper vectors (vesicular stomatitis virus G [VSVG], Tat1b, Mgpm2, and cytomegalovirus [CMV]-Rev) (17). Virus-containing supernatants were used to infect HCT116 cells. Cells stably expressing the tagged proteins were selected with puromycin (Invitrogen) for at least 1 week. For the generation of stable knockdown cell lines, we used miR-30-based short hairpin RNA (shRNA) constructs and VSVG and gag-pol helper vectors. Cells were selected for at least 1 week in puromycin. For small interfering RNA (siRNA) transfection, Lipofectamine RNAiMax was used to transfect the 20 nM indicated siRNA into the indicated cell lines. The transfected cells were analyzed ∼48 h after transfection. The siRNA and shRNA sequences used in the study were TIMMDC1 siRNA_1, 5′-GAAGUACUCUGGUGAGACU-3′; TIMMDC1 siRNA_2, 5′-CUAGAAACCCUUCAGUAAU-3′; TIMMDC1 shRNA_1, 5′-CACGGGAAGTCTTTTTAGGATA-3′; and TIMMDC1 shRNA_2, 5′-TTCGCAAAAGATTAAAGTTGAA-3′.
IP and proteomic analysis.
Cells were lysed in lysis buffer (50 mM Tris-HCl [pH 7.5], 150 mM NaCl, 1% digitonin supplemented with protease inhibitors [Roche]) for 30 min on ice to obtain whole-cell extracts. The lysates were cleared by centrifugation at 4°C for 15 min at maximum speed. Approximately 0.5 mg of mitochondrial lysate was used for endogenous IP and incubated with 10 μl of solid beads coupled to the indicated antibody or control IgG overnight at 4°C. Protein A resin (10 μl) was then added to the IP reaction mixture and incubated for a further 2 h at 4°C. The beads were washed three times with lysis buffer. After washing, 2× SDS loading buffer was added, and the samples were boiled for 5 min. The samples were separated on an SDS-PAGE gel prior to immunoblot analysis. For IPs of ectopically expressed proteins, agarose beads conjugated with HA or Flag antibodies (Sigma) were used. Affinity purification (AP)-MS and CompPASS analysis were performed as previously described (18, 19). Briefly, cells (∼107) were lysed for AP-MS using anti-HA beads. After washing, proteins were eluted with HA peptide, subjected to trichloroacetic acid precipitation, and trypsinized prior to passage through stage tips. Samples were analyzed in technical duplicate on a Thermo LTQ mass spectrometer (Thermo Scientific), and spectra were searched with Sequest prior to target-decoy peptide filtering and linear discriminant analysis to control the peptide level false-positive rate (20). Peptides were assembled into proteins using principles of parsimony to account for peptides that could be assigned to more than one protein in the database. The number of peptide spectral matches observed for each protein averaged across technical duplicate analyses was taken as a measure of its abundance in each immunoprecipitation. Peptides were identified with a false-discovery rate of <2.0%. Peptide data expressed as average peptide spectral matches (APSMs) summed for each protein were uploaded into the CompPASS algorithm housed within the CORE environment. For CompPASS analysis of HCT116 cells, we employed APSM data from 214 unrelated bait proteins analyzed in an analogous manner. The CompPASS system identifies high-confidence candidate interacting proteins (HCIPs) based on the normalized and weighted D score (NWD score) which incorporates the frequency with which they are identified within the stats table, the abundance (APSMs) when found, and the reproducibility of identification in technical replicates and also determines a z-score based on APSMs (18, 19). Proteins with NWD scores of >1.0 are considered HCIPs, although we also note that some proteins that may be bona fide interacting proteins may not reach the strict threshold set by an NWD score of >1.0 (see Table S1 in the supplemental material). This corresponds to a false-discovery rate of ∼2%, as configured in CompPASS (18). Candidate proteins not known to be localized to mitochondria based on Mitocarta (www.broadinstitute.org/pubs/MitoCarta/) and Mitoproteome (www.mitoproteome.org) were omitted from the interaction maps (see Table S2 in the supplemental material for the filtered data). Complex I subunits with NWD scores above 0.5 and below 1 are also included in Table S2.
Antibodies.
The antibodies used in this work include anti-TIMMDC1 (Sigma HPA053214 and Santa Cruz G-14), anti-complex I (Abcam ab109711), anti-ECSIT (Abcam ab21288), anti-NDUFA13 (Abcam ab110240), anti-SDHA (Abcam ab14715), anti-TIMM23 (BD-Biosciences 611222), anti-UQCRC2 (Abcam ab14745), anti-NDUFA9 (Abcam ab14713), anti-PCNA (Santa Cruz sc-56), anti-HSP90 (Epitomics 3363-1), anti-TOMM70 (Epitomics T1677), anti-Flag (Sigma SLB6631), anti-HA (Covance D13CF00834), anti-MT-CO1 (Abcam 1D6E1A8), and anti-C1QBP1 (Cell Signaling Technologies 5734BC).
Mitochondrion isolation.
Mitochondria were isolated by differential centrifugation. Cells were resuspended in mito-isolation buffer (200 mM mannitol, 68 mM sucrose, 10 mM HEPES-KOH at pH 7.4, 10 mM KCl, 1 mM EDTA, 1 mM EGTA, and 0.1% bovine serum albumin [BSA]) and ruptured with 30 to 40 passes through a prechilled homogenizer or 30 s of sonication at the lowest setting. The homogenized cellular extract was then centrifuged at 600 × g to obtain a postnuclear supernatant. Mitochondria were pelleted by centrifugation at 10,000 × g for 10 min and washed twice in SEM buffer (250 mM sucrose, 1 mM EDTA, 10 mM MOPS [morpholinepropanesulfonic acid]-KOH, pH 7.2).
Quantitative proteomics of CI assembly.
HCT116 stable cell lines expressing shRNA targeting firefly luciferase (shFF2) or shTIMMDC1 were grown in light medium (medium containing lysine labeled with 12C6 [K0 medium]) or heavy medium (medium containing lysine labeled with 13C6 [K8 medium]), and equal numbers of the cells were mixed prior to purification of mitochondria. Mitochondria were lysed with 1% digitonin, and protein complexes were fractionated by blue native (BN)-PAGE or size exclusion chromatography (SEC) (Superose 6 column). Gel bands were excised, fast protein liquid chromatography (FPLC) fractions were collected, and the proteins were subjected to reduction, alkylation, and trypsinization either in gel or in solution. Tryptic peptides were analyzed using an LTQ Orbitrap Elite mass spectrometer (Thermo Scientific). Peptides were quantified using MaxQuant software (http://www.maxquant.org/ ).
RNA extraction, reverse transcription, and qPCR.
Total RNA was obtained using a NucleoSpin RNA II (Macherey-Nagel) RNA kit according to the manufacturer's protocol. The extracted RNA was then used for reverse transcription using Superscript III (Invitrogen). The cDNA obtained was used for quantitative PCR (qPCR) with gene-specific primers and SYBR green for detection on a LightCycler 480 system (Roche). Primers specific to TUBB were used for normalization. The primer sequences are as follows: TUBB_F, CTGGACCGCATCTCTGTGTA; TUBB_R, CCCAGGTTCTAGATCCACCA; NDUFA13_F, TGGGCCCATCGACTACAAAC; NDUFA13_R, CCAATCCCTATGGCCAGCAT; ECSIT_F, AGCTGCTCAACATCTTCCCC; ECSIT_R, CATCACACCGTGGTTCTCCA; NDUFA9_F, TTGTCCGGGTCCTGTCAATG; NDUFA9_R, CCACCTTTCCCATGAGGCAT; NDUFAF4_F, GAGCACTAGTGATTCGCGGT; NDUFAF4_R, GCGACAGAGGGCTTCATCTT; NDUFA11_F, AAAGCCTACAGCACCACCAG; NDUFA11_R, TGTCCAACCTTAGCCACTCC; TIMM21_F, TCCTGAGGTGATCGGTGTCT; TIMM21_R, ACGTGTGTTTCAGCCCATCT; TIMMDC1_F, TAATTGCAGGAGCTGTCACG; and TIMMDC1_R, CCAGCAAGGCTCCAATTATG.
BN-PAGE.
Mitochondria were purified as described above and lysed in 1% digitonin prior to separation by 4% to 16% BN-PAGE as previously described (21). Proteins were transferred to polyvinylidene difluoride (PVDF) membranes and detected using the indicated antibodies. Immunoblot signals were quantified by densitometry.
Complex I and complex IV activities.
Complex I and complex IV activities were measured as previously described (14). Briefly, dipstick activity assays were performed on 10 μg (complex I) and 15 μg (complex IV) of cleared cell lysates from HCT116 stable cell lines expressing shFF2 or two different shRNAs targeting TIMMDC1 according to the manufacturer's protocol (Mitosciences). Densitometry was measured by the use of a flatbed scanner and quantified with ImageJ. Measurements were performed in biological triplicates, each one measured in technical triplicates.
Oxygen consumption.
The oxygen consumption rate (OCR) was measured using an XF24 extracellular analyzer (Seahorse Bioscience). Mouse C2C12 or HeLa cells transiently transfected with control or TIMMDC1 siRNA were seeded in 24-well assay plates (BD Bioscience) at a concentration of 20,000 cells per well. After 24 h, the cells were loaded into the machine for O2 concentration determinations. The cells were sequentially exposed to oligomycin (1 μM), carbonylcyanide p-trifluoromethoxyphenylhydrazone (FCCP) (150 nM), and antimycin A (10 μM). After each injection, the OCR was measured for 3 min, and the medium was mixed and again measured for 3 min twice. Every point represents the average of 6 (C2C12) or 12 (HeLa) different wells.
TMT labeling.
Isobaric labeling of the peptides with 6-plex tandem mass tagging (TMT) reagents (Thermo Scientific) was performed as described previously (22). The reagents (0.8 mg) were dissolved in 40 μl acetonitrile, and 10 μl of the solution was added to tryptic peptides dissolved in 100 μl of 200 mM HEPES, pH 8.5. After 1 h at room temperature, the reaction was quenched by adding 8 μl of 5% hydroxylamine. The labeled peptides were acidified, pooled, and desalted with C18 stage tips. Reporter ions were quantified from triple-stage MS (MS3) spectra acquired on an LTQ Orbitrap Velos mass spectrometer (Thermo Scientific) (22).
Electron microscopy.
Control and TIMMDC1 knockdown HCT116 stable cell lines were grown to 60% confluence in 6-cm culture dishes and fixed with 2% paraformaldehyde and 2.5% glutaraldehyde in 0.1 M cacodylate buffer, pH 7.4, for 5 min at room temperature. The fixed samples were submitted to the Harvard Medical School electron microscopy (EM) facility and subsequently processed for imaging using a Tecnai G2 Spirit BioTwin transmission electron microscope.
Carbonate extraction, osmotic shock, and proteinase K treatment.
Mitochondria were isolated and subjected to alkaline extraction in freshly prepared 0.1 M Na2CO3 (pH 11). Membranes were pelleted at 100,000 × g for 30 min at 4°C, and the supernatants were precipitated by the addition of 1/5 volume of 72% trichloroacetic acid and washed four times with cold acetone. After the treatments, soluble (S, supernatant) and insoluble (P, pellet) fractions were subjected to SDS-PAGE and Western blot analysis using antibodies against C1QBP, TIMMDC1, TOMM70, and TIMM23. Isolated mitochondria from HCT116 cells were subjected to proteinase K (50 μg/ml) proteolysis to digest exposed proteins. Osmotic shock (25 mM sucrose, 10 mM MOPS-KOH, pH 7.2) was used to disrupt the outer mitochondrial membrane. After treatments as indicated, proteinase K activity was blocked with phenylmethylsulfonyl fluoride (PMSF) (2 mM), and fractions were subjected to SDS-PAGE and Western blot analysis using antibodies against TIMMDC1, TOMM70, and TIMM23.
Immunofluorescence.
Cells grown on 15-mm glass coverslips or 384-well clear-bottom plates were fixed with PBS, 4% paraformaldehyde (PFA), and 4% sucrose for 10 min; permeabilized with phosphate-buffered saline (PBS)–0.1% Triton X-100 for 3 min, blocked with PBS-1% BSA for 30 min, and incubated with anti-TOMM20 (1:100; Santa Cruz) and anti-HA (1:200; Covance) in PBS-1% BSA for 1 h at room temperature. After extensive washing, the fixed cells were incubated with Alexa Fluor 488–chicken anti-rabbit and Alexa Fluor 594–goat anti-mouse (1:10,000) secondary antibodies for 1 h at room temperature. Images were acquired with a Nikon Ti with spinning disk confocal microscope with a 100× oil objective.
Statistical analysis.
Statistical significance was calculated using the one-way analysis of variance (ANOVA) test; P values are provided in the figure legends.
RESULTS
Systematic proteomic analysis of CI and its assembly apparatus.
We set out to systematically express subunits of CI and its assembly apparatus previously linked to CI disease in order to perform interaction proteomics (Fig. 1A). Fifteen open reading frames (Fig. 1B) were C-terminally tagged with an HA-FLAG epitope in a lentiviral vector and either stably expressed in HCT116 cells (for proteomics) (Fig. 1A) or transiently expressed in HeLa cells (for localization analysis) (Fig. 1C). The use of a C-terminal tag was expected to minimally affect mitochondrial localization, given that mitochondrial targeting sequences are typically located near the N terminus. Confocal imaging of HeLa cells after α-HA immunostaining verified that each protein was targeted to mitochondria (Fig. 1C).
FIG 1.

Systematic interaction proteomic analysis of 11 CI subunits and 4 assembly factors. (A) Schematic representation of the experimental work flow utilized for the identification of HCIPs for CI subunits and assembly factors. (B) Schematic illustration of CI topology. The schematic representation is based on a previously proposed model, but ambiguity exists in the locations of some subunits (44). Proteins tagged for immunoprecipitation are highlighted in red. Assembly factors are represented separately in the inset. The subunits with asterisks are mutated in patients with CI deficiency. (C) Immunofluorescence analysis of the subcellular localization of tagged proteins. HeLa cells transiently expressing the indicated baits fused with a C-terminal HA-Flag tag were stained with anti-HA (red) and the mitochondrial marker anti-TOMM20 (green). Scale bars, 10 μm (applies to all images). (D) Overview of the CI interaction network obtained from IP-MS analysis of 15 baits (red nodes) consisting of 4 assembly factors and 11 core subunits. Subnetworks representing discrete functional groups are color coded. Interactions with TIMMDC1 are indicated by red lines. Solid lines indicate an NWD score >1, and dotted lines indicate an NWD score between 0.5 and 1.0.
To examine interaction partners of CI subunits and to identify HCIPs, we employed a modified version of the previously described CompPASS platform (19) (Fig. 1A) (see Materials and Methods for a description of the CompPASS method). To enhance detection of membrane-associated proteins, we employed 1% digitonin, and the proteins were purified using anti-HA beads. After extensive washing, complexes were trypsinized prior to proteomic analysis. The interaction data are summarized in Fig. 1D (Table S1 in the supplemental material contains the entire data set). Overall, the interaction network is composed primarily of a core CI module and 2 distinct assembly factor modules, but in total, it contained 101 proteins and 335 interactions (edges) after filtering for known mitochondrial proteins (see Table S2 in the supplemental material). From the 11 core CI subunits used as bait, we identified 23 additional core CI subunits, including 5 subunits encoded by the mitochondrial genome (MT-ND1, MT-ND2, MT-ND4, MT-ND5, and MT-ND6). In total, 207 edges linked the 38 CI core subunits, indicating extensive connectivity (Fig. 1D), as expected based on the known architecture of CI (11). Many additional known CI subunits were detected but did not pass the strict NWD score employed for HCIP determination (see Table S1 in the supplemental material). Consistent with detection of ETC supercomplex interactions, we also identified 7 edges linked with 5 CIV subunits and 14 edges linked with 6 CIII subunits emanating from 6 core CI subunits (Fig. 1D). Several core subunits were also associated with 4 mitochondrial proteases (Fig. 1D).
The 4 assembly factor subunits analyzed—ECSIT, ACAD9, NDUFAF1, and NDUFAF3—showed extensive reciprocal connectivity with each other (Fig. 1D). ECSIT, ACAD9, and NDUFAF1 also associated with TMEM126B (15), indicating that our method is able to retrieve all known subunits of the MCIA complex with high confidence. As expected, several core subunits associated with one or more members of the MCIA complex, including NDUFS5, NDUFA13, and NDUFS3. NDUFAF3 associated with NDUFAF4, but unexpectedly, we also observed NDUFAF3 association with C20orf7. C20orf7 is mutated in patients with CI deficiency (23), and these mutations result in defects in CI assembly and reduced CI activity in cultured cells. Association of C20orf7 with the NDUFAF3-NDUFAF4 module suggests a functional connection in early assembly steps not currently built into existing models (11). Two additional poorly characterized CI assembly factors—FOXRED1 and AIFM1 (14, 24)—also associated with subunits of the soluble arm of CI.
Identification of TIMMDC1 as a novel CI-interacting protein.
Within the assembly factor module, our attention was drawn to a previously uncharacterized protein, TIMMDC1 (also called C3orf1), which was detected in association with ECSIT, ACAD9, NDUFAF1, and NDUFAF3 subunits, as well as with NDUFA13 and NDUFS5 core subunits (Fig. 1D). As an initial approach for validating the interaction of TIMMDC1 with CI core and assembly factor components, TIMMDC1 was C terminally tagged with an HA-FLAG epitope and stably expressed in HCT116 cells, followed by IP-MS analysis. As shown in Fig. 2A, we identified 20 core CI subunits and 6 assembly factor subunits in association with TIMMDC1, including all 4 subunits of the MCIA complex (ECSIT-ACAD9-NDUFAF1-TMEM126B) after filtering for known mitochondrial proteins (see Tables S1 and S2 in the supplemental material). These components are known to contribute to particular subcomplexes, which suggests that TIMMDC1 engages Q module, N module, and membrane arm components of CI, in addition to the assembly factors (15, 25–27) (Fig. 2A). To further validate this interaction, we first employed antibodies directed at endogenous CI for IP-Western analysis and detected endogenous TIMMDC1 in the CI complex (Fig. 2B, lanes 1 and 2). While the anti-CI antibody employed depleted NDUFA9 from the extract based on analysis of the IP supernatant, TIMMDC1 was not depleted (Fig. 2B, lanes 3 and 4), indicating that a pool of TIMMDC1 is not associated with CI. In addition, using either NDUFA9-HA-FLAG or NDUFAF1-HA-FLAG for IP-Western analysis, we detected endogenous TIMMDC1, and depletion of TIMMDC1 with 2 different siRNAs validated the specificity of the antibody employed (Fig. 2C and D, compare lane 2 with lanes 3 and 4). Moreover, endogenous ECSIT was detected by IP-Western analysis in complexes with TIMMDC1-HA-FLAG immune complexes using anti-FLAG capture (Fig. 2E, lane 3). Taken together, these data provide strong evidence that TIMMDC1 associates tightly with components of the MCIA complex, as well as core components of CI.
FIG 2.

TIMMDC1 interaction network. (A) IP-MS followed by CompPASS analysis of C-terminally tagged TIMMDC1. The bait (TIMMDC1) is represented by a red node, and HCIPs are represented in gray. Distinct functional protein groups are color coded. (B) Endogenous interaction between TIMMDC1 and CI. An antibody directed against the fully assembled form of endogenous CI was used to capture CI from mitochondrial lysates. Western blot analysis was performed with anti-NDUFA9 as a control for CI pulldown efficiency and with antibodies against endogenous TIMMDC1. (C and D) C-terminally tagged NDUFA9 and NDUFAF1 were immunopurified from 293T cells, and Western blot analysis was performed to detect the interaction with endogenous TIMMDC1. TIMMDC1 siRNA-mediated depletion was used to confirm the specificity of the interaction. (E) C-terminally tagged TIMMDC1 was immunopurified from 293T cells, and Western blot analysis was performed to detect an interaction with endogenous ECSIT.
TIMMDC1 is a multipass mitochondrial inner membrane protein.
TIMMDC1 orthologs were identified in all vertebrates analyzed, and in addition, we detected an obvious ortholog in Drosophila but not in Caenorhabditis elegans (Fig. 3A). Further sequence analysis revealed that TIMMDC1 is a member of the TIM17-TIM22-TIM23 family of 4-pass transmembrane proteins (Fig. 3B). TIMM23-Tim23p and TIMM17-Tim17p form the translocon channel for transport of proteins into the inner mitochondrial membrane (28). Given that TIMMDC1 associates with CI, which resides in the inner mitochondrial membrane, we examined the localization of TIMMDC1. First, TIMMDC1-HA-FLAG was found to colocalize with endogenous TOMM20 in both 293T and HeLa cells, as determined by confocal microscopy (Fig. 3C). Second, endogenous TIMMDC1 was detected by Western blotting of purified mitochondria from 293T cells, with a level of enrichment similar to that found with the mitochondrial outer membrane protein marker TOMM70 (Fig. 3D, lane 2) and was enriched in the pellet fraction of purified mitochondria treated with sodium carbonate, pH 11, indicating membrane localization (Fig. 3E, lane 2).
FIG 3.

TIMMDC1 is a conserved mitochondrial inner membrane protein. (A) Amino acid conservation of TIMMDC1 across species. An alignment was performed using Clustal O. Dm, Drosophila melanogaster; Hs, Homo sapiens; Mm, Mus musculus; Dr, Danio rerio; Xlt, Xenopus laevis tropicalis. Black shading, identical residue; gray shading, >50% identical. (B) Alignment of TIMMDC1 with other members of the Tim17-23 protein family (generated with the MAFFT algorithm [http://mafft.cbrc.jp/alignment/server/]) and prediction of TIMMDC1 transmembrane helices (represented by H). (C) Immunofluorescence images showing subcellular localization of C-terminally tagged TIMMDC1 in 293T and HeLA cells. Exogenous TIMMDC1 was stained with anti-HA antibody and mitochondria with an anti-TOMM20 antibody. Scale bars, 10 μm (applies to all images). (D) Cytoplasmic (Cyto) and mitochondrial (Mito) fractions from HCT116 were separated by differential centrifugation. anti-HSP90 antibody was used as a cytoplasm marker, and anti-TOMM70 antibody was used as a mitochondrial marker. Endogenous TIMMDC1 is shown in the mitochondrial fraction with an anti-TIMMDC1 antibody. (E) Carbonate extraction of mitochondrial membrane proteins. Antibodies against endogenous C1QBP, TIMM23, and TOMM70 were used to identify matrix and inner and outer membrane compartments, respectively. TIMMDC1 is shown in the mitochondrial membrane fraction with an anti-TIMMDC1 antibody. (F) TIMMDC1 localizes to the inner membrane compartment. Proteinase K was used to digest the outer membrane proteins of isolated mitochondria. Osmotic shock was performed in order to break the outer membrane and make the inner membrane compartment accessible to proteinase K digestion. TOMM70 and TIMM23 antibodies were used to decorate the outer and inner membrane compartments, respectively. (G) BN-PAGE, followed by immunotransfer to a nitrocellulose membrane, was probed with an antibody directed against endogenous TIMM23. Molecular mass markers (kDa) are shown on the left for panels D to G.
To examine whether TIMMDC1 is localized in the mitochondrial inner membrane, we incubated mitochondria with or without osmotic shock and in combination with proteinase K treatment. In intact mitochondria, proteins localized on the mitochondrial inner membrane are expected to be protected from proteinase K digestion. Indeed, while TOMM70 is degraded within 10 min after proteinase K treatment, TIMM23 and TIMMDC1 were protected from degradation (Fig. 3F, lane 4). On the other hand, proteins localized on the mitochondrial inner membrane are expected to be accessible to proteinase K only in the presence of osmotic shock. We found lower-molecular-weight products of TIMMDC1, as well as TIMM23 used as a positive control, in the presence of proteinase K and osmotic stress but not in their absence (Fig. 3F, compare lanes 2 and 4). The finding that TIMMDC1 is related to the TIM17-TIM22-TIM23 family suggested the possibility that TIMMDC1 functions in some way with the mitochondrial inner membrane translocon. Two lines of evidence argue against this. First, neither TIMM17 nor TIMM23 was found to associate with TIMMDC1 in the IP-MS experiments (Fig. 2A). Second, the mobility of the TIMM23 complex was unaltered in BN-PAGE of mitochondria from cells depleted of TIMMDC1 with 2 distinct shRNAs (Fig. 3G, compare lane 1 with lanes 2 and 3).
Loss of TIMMDC1 affects ETC function.
Association of TIMMDC1 with components of the ETC led us to examine whether its depletion by RNA interference (RNAi) altered CI activity. HCT116 cells were transduced with retroviruses expressing a control shRNA (shFF2) or 2 independent shRNAs targeting TIMMDC1 (Fig. 4A and B). These established cell lines expressed ∼10% of the levels of TIMMDC1 found in shFF2-expressing cells (Fig. 4C, compare lane 1 with lanes 2 and 3). Of note, we were unable to generate cells that stably expressed lower levels of TIMMDC1, suggesting that TIMMDC1 may be required for cell viability (data not shown). Using an NADH oxidation assay (see Materials and Methods), we observed a substantial loss of CI activity that correlated with the extent of TIMMDC1 depletion (Fig. 4A). In contrast, no loss of CIV activity was detected (Fig. 4B). We then examined oxygen consumption upon depletion of TIMMDC1 using siRNAs in both HeLa cells and C2C12 myoblasts, with the latter displaying higher basal respiration rates. Depletion of TIMMDC1 (Fig. 4D and E, compare lanes 1 with 2 and 3) resulted in a substantial reduction in respiration (Fig. 4F and G), indicating an important role for TIMMDC1 in ETC output.
FIG 4.

Altered CI function and mitochondrial morphology in cells depleted of TIMMDC1. (A and B) Histograms showing CI (A) and CIV (B) activities measured in stable cell lines expressing shFF2 or two different shRNAs targeting TIMMDC1. The bars (with standard errors of the mean [SEM]) show the means of 3 biological replicates, each one performed in technical triplicates. *, P < 0.05 (one-way ANOVA). (C) Western blot analysis showing TIMMDC1 stable knockdown efficiencies for two different shRNAs in HCT116 cells used for CI and CIV activity measurements. PCNA was used as a loading control. (D) Western blot analysis showing TIMMDC1 depletion efficiency after TIMMDC1 siRNA transfection in C2C12 cells. (E) Western blot analysis showing TIMMDC1 depletion efficiency after TIMMDC1 siRNA transfection in HeLa cells. (F) Oxygen consumption was measured in C2C12 cells transfected with control or TIMMDC1 siRNA. The oxygen consumption rate (pmol/min) was measured under baseline conditions and after oligomycin, FCCP, and antimycin A injections, as indicated by the arrowheads. (G) Oxygen consumption was measured as for panel D with HeLa cells depleted of TIMMDC1 using two siRNAs. (H) Transmission electron micrographs showing mitochondrial morphology in HCT116 stable cell lines expressing shFF2 or TIMMDC1 shRNA (arrowheads, mitochondria with normal crista structure; arrows, mitochondria with dirsupted crista structure). Scale bars, 500 nm. Molecular mass markers (kDa) are shown on the left for panels C to E.
Loss of ETC activity is often associated with altered mitochondrial morphology (29, 30). In cells depleted of TIMMDC1 analyzed by electron microscopy, control cells displayed the expected mitochondrial morphology, including well-defined crista structures (Fig. 4H, arrowheads). In contrast, mitochondria in cells depleted of TIMMDC1 often had a swollen appearance and altered crista structure (Fig. 4H, arrows). Taken together, these data suggest an important role for TIMMDC1 in CI function and mitochondrial homeostasis.
BN-PAGE of TIMMDC1 complexes.
The interaction of TIMMDC1 with both CI core subunits and assembly factors (Fig. 2A) raised the question of whether TIMMDC1 is a previously unknown core CI subunit or, alternatively, whether it functions as part of the assembly complex, which is known to bind to various intermediates but to dissociate from fully formed CI. Using BN-PAGE analysis, TIMMDC1 was detected in several complexes ranging from ∼0.8 to 0.3 MDa (Fig. 5A). Thus, TIMMDC1 appears to be primarily associated with CI subcomplexes that are smaller than fully assembled CI migrating at >1 MDa (Fig. 5E and F) (see Discussion).
FIG 5.
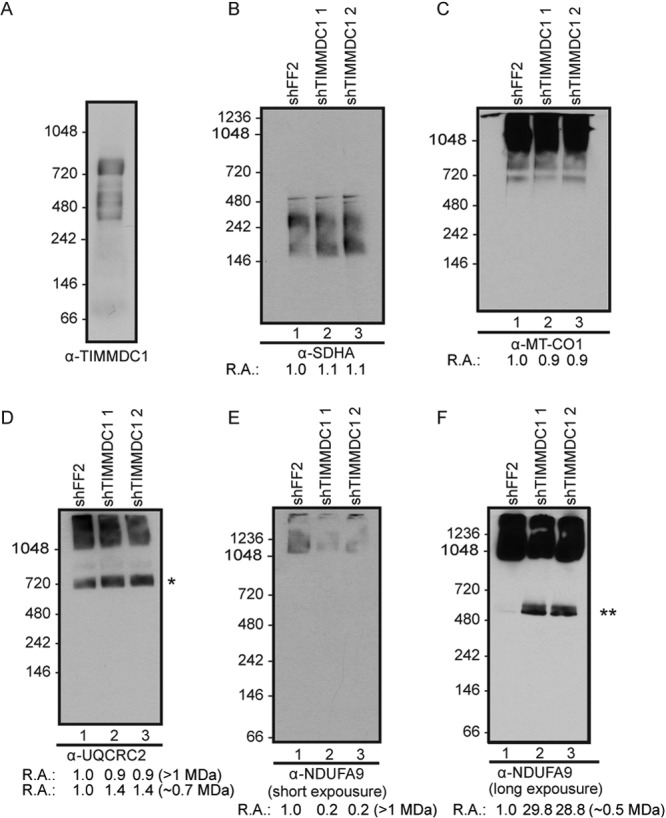
TIMMDC1 depletion affects complex I assembly. BN-PAGE was followed by immunotransfer to nitrocellulose membranes and probing with antibodies directed against endogenous TIMMDC1, UQCRC2, MT-CO1, SDHA, and NDUFA9, as indicated, in HCT116 wild-type mitochondria (A) or stable cell lines (B to F) expressing shFF2 or two different shRNAs targeting TIMMDC1. In panel D, the asterisk denotes an anti-UQCRC2-positive complex with a size expected for CIII plus CIV, and in panel F, the double asterisk indicates a CI intermediate containing NDUFA9 formed upon TIMMDC1 depletion. Quantification of complexes (relative abundance [R.A.]) is provided under the immunoblots (see Materials and Methods). Molecular mass markers (kDa) are shown on the left.
Depletion of TIMMDC1 affects CI assembly.
BN-PAGE is a commonly employed approach for examining the assembly state of ETC complexes. Mitochondria from HCT116 cells stably expressing shFF2 or two independent shRNAs targeting TIMMDC1 were isolated and subjected to BN-PAGE and immunoblotting with core subunits of ETC complexes. anti-SDHA (CII) was used as a loading control, as it does not associate tightly with other ETC components, and little change in CII was seen (Fig. 5B). Likewise, little change in CIV was observed, as was seen using anti-MT-CO1 antibodies (Fig. 5C). In contrast, immunoblotting with the Q module subunit NDUFA9 revealed a reduction in the abundance of the fully formed CI at ∼1 MDa with concomitant accumulation of an NDUFA9-positive subcomplex migrating at ∼0.48 MDa by BN-PAGE (Fig. 5E and F, compare lanes 1 with lanes 2 and 3). These data indicated that TIMMDC1 functions at one or more steps in CI assembly of the Q module. Interestingly, depletion of TIMMDC1 led to a small (∼40%) increase in the abundance of an ∼0.7-MDa anti-UQCRC2-positive (CIII) complex (likely CIII and CIV) and a concomitant diminution of a >1-MDa anti-UQCRC2-positive complex we interpret as the ETC supercomplex (Fig. 5D).
Analysis of the role of TIMMDC1 in CI assembly using quantitative proteomics.
While BN-PAGE approaches coupled with immunoblotting allow detection of assembly intermediates, it is difficult to elucidate the components of these intermediates using this approach, in part due to the paucity of antibodies against individual components that recognize the antigen within the BN-PAGE context. Recent work employed a spectral counting approach coupled with native gel fractionation to examine the role of the MCIA component TMEM126B in CI assembly (15). In order to provide a more quantitative approach for monitoring CI complex assembly and to examine in greater detail the assembly intermediates formed upon TIMMDC1 depletion, we developed a SILAC approach. Briefly, light HCT116 cells (cells grown in K0 medium) expressing shFF2 and heavy cells (cells grown in K8 medium) expressing shTIMMDC1 were mixed 1:1, and mitochondria were isolated (Fig. 6A). After lysis in 1% digitonin to preserve the complexes, proteins were either separated by SEC (Fig. 6B) or subjected to BN-PAGE (Fig. 6C). For SEC, fractions were reduced, alkylated, trypsinized, and subjected to liquid chromatography-tandem MS (LC–MS-MS) (Fig. 6A). For the BN-PAGE separation, 24 gel slices ranging from >1 MDa to ∼0.1 MDa were excised, and the proteins were reduced, alkylated, trypsinized, and subjected to proteomic analysis (Fig. 6A). The SILAC ratios of heavy and light peptides for each protein in each of the two experiments were independently plotted as a heat map organized nominally based on known CI architecture (Fig. 6B and C, where an increase in the heavy-to-light [H/L]ratio is shown in red and a reduction in the H/L ratio is shown in green). We observed a decrease in the fully assembled CI (Fig. 6B and C). We also observed a dramatic increase in the abundances of numerous core CI subunits in smaller complexes upon TIMMDC1 depletion. One cluster at ∼0.5 to 0.7 MDa in the BN-PAGE experiment contained NDUFB1, NDUFB3, NDUFB5, NDUFB6, NDUFB9, NDUFB10, NDUFB11, NDUFA4, MT-ND4, and MT-ND5, and several of these subunits were also detected in the SEC experiment at a similar molecular mass (Fig. 6B and C). Moreover, several components of the Q module (NDUFS2, NDUFS3, NDUFS7, NDUFS8, NDUFA5, and NDUFA9) were detected in a complex centered at ∼0.3 MDa (Fig. 6B and C). Additionally, subunits of the N module (dehydrogenase) (NDUFV1, NDUFV2, and NDUFS1) were also found in a complex at ∼0.25 MDa (Fig. 6B and C). Based on these data and existing models for CI assembly, our quantitative-proteomics data suggest that TIMMDC1 plays a role in merging the membrane-embedded MT-ND1–NDUFS2NDUFS3–NDUFS7–NDUFS8–NDUFA5–NDUFA9 complex with the partially membrane-embedded complex containing MT-ND4, MT-ND5, and NDUFB6 (Fig. 6D). These results are placed in the context of current models for assembly of CI below (see Discussion).
FIG 6.

Quantitative proteomics analysis of CI assembly. (A) Schematic representation of the SILAC-based quantitative mass spectrometry approach to analyzing CI assembly defects. Light (K0) labeled shFF2 and heavy (K8) labeled shTIMMDC1 stable cell lines were mixed at a 1:1 ratio, and mitochondria were subsequently isolated and lysed with 1% digitonin. (B and C) Mitochondrial protein complexes were separated either by FPLC gel filtration (B) in a Superose 6 column or using BN-PAGE (C) and sliced into 24 gel pieces. The proteins were subjected to tryptic digestion and analyzed by quantitative mass spectrometry. Heavy-to-light (H:L) ratios were calculated for CI subunits and assembly factors. The ratios were plotted in heat maps, where values of <1 are represented in green and values of >1 are represented in red. (D and E) Proposed model for the TIMMDC1 mechanism of action during CI assembly and the effect of TIMMDC1 depletion on the assembly process. Assembly intermediates observed to accumulate upon TIMMDC1 depletion in panel E are color coded to match the boxes of the same colors in panel C. The schematic representation is based on a previously proposed assembly model (11).
Multiplex proteomics analysis of ETC components in mitochondria upon TIMMDC1 depletion.
Previous studies suggested that the abundances of particular subunits of CI are reduced upon inhibition of assembly, including MT-ND1, MT-ND2, and Q module subunits (31–33). To examine the effect of TIMMDC1 depletion on the total abundance of ETC components, we performed a 6-plex TMT experiment. Tryptic peptides of mitochondria derived from HCT116 cells stably expressing shFF2 or shTIMMDC1 in triplicate were each labeled with one of 6 isobaric TMT reagents, which provide reporter ions for quantification of the relative levels of each peptide identified over the 6 samples in a single LC-MS3 experiment (22) (Fig. 7A). We then determined the TMT reporter ion intensities for all the peptides for each detected protein in the ETC. Nineteen of 34 CI core subunits or assembly factors displayed a reduction in abundance ranging from 10% to 45% under conditions where TIMMDC1 was depleted by 90% (Fig. 7B). MT-ND1, MT-ND2, NDUFA7, and NDUFB4 displayed the greatest reductions in abundance (Fig. 7B). A reduction in protein levels for NDUFA13 was confirmed by immunoblotting with 2 independent siRNAs (Fig. 7C, compare lane 1 with lanes 2 and 3). In contrast, the abundances of two subunits of CII, five subunits of CIII, 11 subunits of CIV, 13 subunits of CV, and 5 subunits of the TIMM translocon complex were not significantly reduced upon TIMMDC1 depletion (Fig. 7D). The absence of general defects in the abundances of nuclear-DNA-encoded CII to CV subunits provides further evidence that depletion of TIMMDC1 does not affect translocation through the TIMM23-TIMM17 translocon and indicates that the reduction in CI subunits reflects defects in assembly. To ensure that the reduced levels of CI subunits were posttranscriptional, we selected several subunits with reduced protein levels for qPCR analysis, including core components (NDUFA9 and NDUFA13); the assembly factor NDUFAF4; NDUFA11, containing a TIM17-TIM22-TIM23 domain (34); and TIMM21, which has been shown by qPCR analysis to control OXPHOS stability (35). However, depletion of TIMMDC1 with 2 independent shRNAs did not affect transcript levels by qPCR (Fig. 7E).
FIG 7.

Quantitative proteomic analysis of mitochondrial lysates reveals a selective decrease in CI subunit abundance upon TIMMDC1 depletion. (A) Schematic representation of the TMT-based quantitative mass spectrometry analysis of the total protein content in mitochondria isolated from shFF2 control or shTIMMDC1 HCT116 stable cell lines. (B and D) Bar graphs showing TMT intensities for subunits and assembly factors in CI (B) or complexes II to V and the TIM inner membrane translocase (D) in TIMMDC1 stably depleted cells relative to an shFF2 control. The bars (with SEM) show the means of 3 technical replicates. (C) Immunoblot analysis of NDUFA13 protein levels in 293T cells transfected with control siRNA or two different siRNAs targeting TIMMDC1. The knockdown efficiency was analyzed with anti-TIMMDC1 antibody, NDUFA13 protein levels were analyzed with anti-NDUFA13 antibody, and anti-PCNA was used as a loading control. Molecular mass markers (kDa) are shown on the left. (E) Histogram showing qPCR analysis of expression of NDUFA13, ECSIT, NDUFA9, NDUFAF4, NDUFA11, TIMM21, and TIMMDC1 in shFF2 control or shTIMMDC1 HCT116 stable cell lines. The bars (with SEM) show the means of 3 biological replicates.
DISCUSSION
In this study, we employed interaction proteomics to systematically identify proteins associated with complex I of the electron transport chain and its assembly machinery. In addition to many core and mitochondrial-DNA-encoded subunits, we also identified subunits of CIII and CIV, as well as several mitochondrial proteases and more than 2 dozen proteins not known to associate with CI. Among the previously uncharacterized proteins was TIMMDC1 (C3orf1), which associated with multiple assembly factors and core CI subunits in a reciprocal manner. TIMMDC1 contains 4 predicted transmembrane domains and is related structurally to the TIM17-TIM22-TIM23 family of proteins. TIMM23's N-terminal and C-terminal extensions are localized in the mitochondrial matrix, and we anticipate that the topology of TIMMDC1 is analogous to that of TIMM23. However, TIMMDC1 does not appear to interact with components of the inner membrane translocon, and its depletion did not affect the abundances of a wide array of ETC components in mitochondria.
The previously described MCIA CI assembly complex is composed of ECSIT, ACAD9, NDUFAF1, and TMEM126B (15, 25, 26), and our data now suggest that TIMMDC1 is also physically associated with the MCIA complex and functions in CI assembly. Depletion of TIMMDC1 leads to defects in CI activity and reduced respiration in tissue culture cells, as also occurs with loss of activity of other MCIA components. Neither stable expression nor stable knockdown of TIMMDC1 in 293T cells had an obvious effect on mitochondrial mass or membrane potential (data not shown).
CI assembly is a multistep process and involves coordinated production of both soluble matrix and hydrophobic membrane-embedded subassemblies (reviewed in reference 11). The early assembly factor C20orf7 promotes incorporation of the membrane arm MT-ND1 subunit into the membrane (23, 36), which then joins with a soluble arm subcomplex containing NDUFS2, NDUFS3, NDUFS7, NDUFS8, and NDUFA9 (37) with the assistance of the NDUFAF3-NDUFAF4 assembly complex to produce an ∼0.4-MDa complex (38) (Fig. 6D). An independently formed membrane arm subcomplex containing MT-ND2, MT-ND3, MT-ND6, and NDUFB6 (∼0.5 MDa) then assembles with the ∼0.4-MDa complex to generate an ∼0.8-MDa intermediate (10, 11). Subsequently, components of the N module, including NDUFV1, NDUFV2, NDUFV3, NDUFS1, NDUFS4, NDUFS6, and NDUFA12, are added (11, 39, 40). The assembly factors are thought to remain associated with the various intermediates until the final step, where they dissociate to yield functional CI (Fig. 6D) (11).
To probe TIMMDC1's role in CI assembly, we employed two independent quantitative-proteomics approaches, SILAC and TMT, to examine the effects of TIMMDC1 depletion on CI assembly. Using BN-PAGE or gel filtration to separate complexes and intermediates prior to proteomics analysis, we identified a number of components that accumulate in distinct subcomplexes indicative of assembly intermediates. We have interpreted our data in the context of existing models (11); however, several subunits have not yet been placed into the assembly pathway, and ambiguity currently exists for a subset of CI components. We observed the accumulation of 3 major species upon TIMMDC1 depletion (Fig. 6B and C). First, by BN-PAGE, we observed an ∼0.3-MDa complex containing several components of the Q module, including NDUFS2, NDUFS3, NDUFS7, NDUFS8, and NDUFA5,9 (Fig. 6D and E). The apparent mass of this complex, together with the identification of NDUFAF4 accumulation in the same size range (Fig. 6C), indicates that this intermediate likely corresponds to intermediate 4 (Fig. 6D and E). This complex was also dramatically increased in the gel filtration/SILAC analysis (Fig. 6B). Second, in the BN-PAGE experiment, we observed strong accumulation of components of the N module, including NDUFV1, NDUFV2, and NDUFS1, at ∼0.25 MDa, suggesting that the block in assembly due to TIMMDC1 depletion occurs prior to addition of the N module, which is thought to be a late step in the process (Fig. 6D and E). Third, we observed an ∼0.5- to 0.6-MDa complex containing several B subunits, including NDUFB6, known to be present in the independently assembled membrane arm (Fig. 6D and E, b), as well as NDUFB1, NDUFB3, NDUFB5, NDUFB9, NDUFB10, and NDUFB11. MT-ND4 and MT-ND5 also accumulated in the same size range (Fig. 6B and C). Previous studies have suggested that MT-ND4 and MT-ND5 are added after assembly of the two membrane-embedded intermediates (Fig. 6D) (11), but our results suggest the possibility that these two subunits have the potential to assemble with the NDUFB6 complex when assembly of the MT-ND1-Q module is blocked.
Components of the MCIA complex (ECSIT-TMEM126B-NDUFAF1-ACAD9) are known to associate with the ∼0.46-MDa NDUFB6-positive complex (Fig. 6D), and depletion of TMEM126B leads to accumulation of the Q module–MT-ND1 intermediate 4 (15). In addition, depletion of ECSIT leads to the accumulation of an ∼0.5-MDa complex by BN-PAGE containing MT-ND1 and NDUFS3 (25), which likely corresponds to the Q module–MT-ND1 intermediate 4, which we also observed with TIMMDC1 depletion (Fig. 6C to E). In addition, TMEM126B depletion also leads to accumulation of an ∼0.3-MDa intermediate containing NDUFB6 and NDUFB5 (15), which may be related to the ∼0.5-MDa complex we detected that also contains these subunits (Fig. 6C to E).
While precise information on the architecture of CI intermediates upon depletion of previously characterized MCIA components is limited, the available data are consistent with TIMMDC1 working together with MCIA to unite the Q module–MT-ND1 intermediate with the membrane arm intermediate b (Fig. 6D and E). This is borne out by the interaction proteomics analysis of TIMMDC1-associated proteins (Fig. 2A). First, TIMMDC1 interacts with 4 subunits of the MCIA complex. Second, TIMMDC1 associated with 4 subunits of the Q module (NDUFA9, NDUFS8, NDUFS7, and NDUFS2) and the Q module assembly complex (NDUFAF3 and NDUFAF4), as well as MT-ND1. Third, TIMMDC1 associates with several components of the ∼0.46-MDa membrane intermediate, including MT-ND4, NDUFB4, NDUFB5, NDUFB6, NDUFB8, NDUFB9, and NDUFB10. Fourth, TIMMDC1 associates with components of the N module, as well as NDUFS5, both of which assemble at a late step (Fig. 6D). Thus, as with other CI assembly factors, it appears that TIMMDC1 remains associated with the growing complex throughout the process (Fig. 6D). Further studies are required to define the effects of TIMMDC1 loss on assembly of the supercomplex, but our results suggest less CIII subunit UQCRC2 in BN-PAGE complexes of >1 MDa (Fig. 5D), which would be consistent with an inability to fully form CI with TIMMDC1 depletion (Fig. 5E).
Among MCIA components, TMEM126B is also predicted to be a transmembrane protein. We speculate that TIMMDC1 and TMEM126B function as membrane anchors that assemble additional components of the MCIA complex, together with both the Q module components and the major membrane arm (Fig. 6D and E), and they may also function laterally in the membrane to organize intermediates into a productive assembly pathway. In this regard, the homology of TIMMDC1 with TIM17-TIM22-TIM23 is intriguing and raises the possibility that TIMMDC1 functions to insert hydrophobic domains from CI subunits into the membrane. In addition to sequence similarity within predicted transmembrane domain 2, TIMMDC1 also contains a hydrophilic loop region found in the TIM17-TIM22-TIM23 family (Fig. 3B). Interestingly, the membrane arm CI subunit NDUFA11 also contains sequence similarity to the transmembrane motifs in TIM17-TIM22-TIM23 and TIMMDC1 and possibly plays a role in integration of transmembrane peptides into the membrane.
Previous studies have indicated that defects in early assembly can also be associated with reduced levels of particular CI subunits, at least in part through the mitochondrial inner membrane protease AFG3L2 (31). In particular, depletion of NDUFAF3 results in a decrease in MT-ND1 protein levels (31), and loss of NDUFAF1 leads to loss of MT-ND2 and components of the b intermediate (Fig. 6D). Using multiplex quantitative proteomics of CI, we observed reduced levels of several CI components (Fig. 7B). In particular, the levels of MT-ND1, MT-ND2, and NDUFA9—components of intermediate 4, prominent in TIMMDC1-depleted cells (Fig. 6D)—were reduced by 40 to 45%. Several additional A, B, S, and V subunits were also affected to similar or lesser degrees (Fig. 7B). Thus, loss of assembly via TIMMDC1 may indirectly lead to proteolytic loss of CI subunits. Further studies are necessary to understand the fate of mitochondria displaying defects in CI assembly, including the possibility that these damaged mitochondria are degraded through mitophagy, as is found for cells deficient in coenzyme Q (41). As several CI assembly factors are mutated in CI deficiency (reviewed in references 1 and 11), it is possible that TIMMDC1 is also mutated in such diseases. Thus far, exome sequencing for mitochondrial proteins in a limited number of patients has apparently not led to the identification of mutations (42), and additional studies are likely warranted, given the data reported here. Consistent with our inability to create cell lines that substantially lack TIMMDC1, Drosophila TIMMDC1 has been reported to be essential for viability (43), suggesting a crucial role in mitochondrial function. Moreover, a complete understanding of CI assembly will likely require the development of reconstituted systems with sufficient resolution to provide mechanistic clarity of the assembly process. This will likely require a complete understanding of the components involved, aided here by the identification of TIMMDC1, and may also be advanced through the further development of quantitative proteomics, as employed here.
Supplementary Material
ACKNOWLEDGMENTS
We thank Marcia Haigis (Harvard Medical School) for access to a Seahorse instrument and Kay Hofmann (Cologne University) for advice on sequence alignments. We thank the Nikon Imaging Center and the Conventional Electron Microscopy Facility at Harvard Medical School for assistance with microscopy.
This work was supported by NIH grants GM095567 and NS083524 to J.W.H. and by HG006673 to J.W.H. and S.P.G.
Footnotes
Published ahead of print 16 December 2013
Supplemental material for this article may be found at http://dx.doi.org/10.1128/MCB.01551-13.
REFERENCES
- 1.Smeitink J, van den Heuvel L, DiMauro S. 2001. The genetics and pathology of oxidative phosphorylation. Nat. Rev. Genet. 2:342–352. 10.1038/35072063 [DOI] [PubMed] [Google Scholar]
- 2.Moreno-Lastres D, Fontanesi F, García-Consuegra I, Martín MA, Arenas J, Barrientos A, Ugalde C. 2012. Mitochondrial complex I plays an essential role in human respirasome assembly. Cell Metab. 15:324–335. 10.1016/j.cmet.2012.01.015 [DOI] [PMC free article] [PubMed] [Google Scholar]
- 3.Lapuente-Brun E, Moreno-Loshuertos R, Acín-Pérez R, Latorre-Pellicer A, Colás C, Balsa E, Perales-Clemente E, Quirós PM, Calvo E, Rodríguez-Hernández MA, Navas P, Cruz R, Carracedo Á, López-Otín C, Pérez-Martos A, Fernández-Silva P, Fernández-Vizarra E, Enríquez JA. 2013. Supercomplex assembly determines electron flux in the mitochondrial electron transport chain. Science 340:1567–1570. 10.1126/science.1230381 [DOI] [PubMed] [Google Scholar]
- 4.Carroll J, Shannon RJ, Fearnley IM, Walker JE, Hirst J. 2002. Definition of the nuclear encoded protein composition of bovine heart mitochondrial complex I: identification of two new subunits. J. Biol. Chem. 277:50311–50317. 10.1074/jbc.M209166200 [DOI] [PubMed] [Google Scholar]
- 5.Baradaran R, Berrisford JM, Minhas GS, Sazanov LA. 2013. Crystal structure of the entire respiratory complex I. Nature 494:443–448. 10.1038/nature11871 [DOI] [PMC free article] [PubMed] [Google Scholar]
- 6.Hunte C, Zickermann V, Brandt U. 2010. Functional modules and structural basis of conformational coupling in mitochondrial complex I. Science 329:448–451. 10.1126/science.1191046 [DOI] [PubMed] [Google Scholar]
- 7.Lazarou M, Thorburn DR, Ryan MT, Mckenzie M. 2009. Assembly of mitochondrial complex I and defects in disease. Biochim. Biophys. Acta 1793:78–88. 10.1016/j.bbamcr.2008.04.015 [DOI] [PubMed] [Google Scholar]
- 8.Ugalde C, Vogel R, Huijbens R, Van Den Heuvel B, Smeitink J, Nijtmans L. 2004. Human mitochondrial complex I assembles through the combination of evolutionary conserved modules: a framework to interpret complex I deficiencies. Hum. Mol. Genet. 13:2461–2472. 10.1093/hmg/ddh262 [DOI] [PubMed] [Google Scholar]
- 9.Tucker EJ, Compton AG, Calvo SE, Thorburn DR. 2011. The molecular basis of human complex I deficiency. IUBMB Life 63:669–677. 10.1002/iub.495 [DOI] [PubMed] [Google Scholar]
- 10.Dieteren CEJ, Willems PHGM, Vogel RO, Swarts HG, Fransen J, Roepman R, Crienen G, Smeitink JA, Nijtmans MLGJ, Koopman WJH. 2008. Subunits of mitochondrial complex I exist as part of matrix- and membrane-associated subcomplexes in living cells. J. Biol. Chem. 283:34753–34761. 10.1074/jbc.M807323200 [DOI] [PMC free article] [PubMed] [Google Scholar]
- 11.Mckenzie M, Ryan MT. 2010. Assembly factors of human mitochondrial complex I and their defects in disease. IUBMB Life 62:497–502. 10.1002/iub.335 [DOI] [PubMed] [Google Scholar]
- 12.Hoefs SJG, Rodenburg RJ, Smeitink JA, van den Heuvel MLP. 2012. Molecular base of biochemical complex I deficiency. Mitochondrion 12:520–532. 10.1016/j.mito.2012.07.106 [DOI] [PubMed] [Google Scholar]
- 13.Mimaki M, Wang X, McKenzie M, Thorburn DR, Ryan MT. 2012. Understanding mitochondrial complex I assembly in health and disease. Biochim. Biophys. Acta 1817:851–862. 10.1016/j.bbabio.2011.08.010 [DOI] [PubMed] [Google Scholar]
- 14.Calvo SE, Tucker EJ, Compton AG, Kirby DM, Crawford G, Burtt NP, Rivas M, Guiducci C, Bruno DL, Goldberger OA, Redman MC, Wiltshire E, Wilson CJ, Altshuler D, Gabriel SB, Daly MJ, Thorburn DR, Mootha VK. 2010. High-throughput, pooled sequencing identifies mutations in NUBPL and FOXRED1 in human complex I deficiency. Nat. Genet. 42:851–858. 10.1038/ng.659 [DOI] [PMC free article] [PubMed] [Google Scholar]
- 15.Heide H, Bleier L, Steger M, Ackermann J, Dröse S, Schwamb B, Zörnig M, Reichert AS, Koch I, Wittig I, Brandt U. 2012. Complexome profiling identifies TMEM126B as a component of the mitochondrial complex I assembly complex. Cell Metab. 16:538–549. 10.1016/j.cmet.2012.08.009 [DOI] [PubMed] [Google Scholar]
- 16.Murphy GJ, Mostoslavsky G, Kotton DN, Mulligan RC. 2006. Exogenous control of mammalian gene expression via modulation of translational termination. Nature Med. 12:1093–1099. 10.1038/nm1376 [DOI] [PubMed] [Google Scholar]
- 17.Wilson AA, Kwok LW, Hovav A-H, Ohle SJ, Little FF, Fine A, Kotton DN. 2008. Sustained expression of alpha1-antitrypsin after transplantation of manipulated hematopoietic stem cells. Am. J. Respir. Cell. Mol. Biol. 39:133–141. 10.1165/rcmb.2007-0133OC [DOI] [PMC free article] [PubMed] [Google Scholar]
- 18.Behrends C, Sowa ME, Gygi SP, Harper JW. 2010. Network organization of the human autophagy system. Nature 466:68–76. 10.1038/nature09204 [DOI] [PMC free article] [PubMed] [Google Scholar]
- 19.Sowa ME, Bennett EJ, Gygi SP, Harper JW. 2009. Defining the human deubiquitinating enzyme interaction landscape. Cell 138:389–403. 10.1016/j.cell.2009.04.042 [DOI] [PMC free article] [PubMed] [Google Scholar]
- 20.Huttlin EL, Jedrychowski MP, Elias JE, Goswami T, Rad R, Beausoleil SA, Villén J, Haas W, Sowa ME, Gygi SP. 2010. A tissue-specific atlas of mouse protein phosphorylation and expression. Cell 143:1174–1189. 10.1016/j.cell.2010.12.001 [DOI] [PMC free article] [PubMed] [Google Scholar]
- 21.McKenzie M, Lazarou M, Thorburn DR, Ryan MT. 2006. Mitochondrial respiratory chain supercomplexes are destabilized in Barth Syndrome patients. J. Mol. Biol. 361:462–469. 10.1016/j.jmb.2006.06.057 [DOI] [PubMed] [Google Scholar]
- 22.Ting L, Rad R, Gygi SP, Haas W. 2011. MS3 eliminates ratio distortion in isobaric multiplexed quantitative proteomics. Nature Methods 8:937–940. 10.1038/nmeth.1714 [DOI] [PMC free article] [PubMed] [Google Scholar]
- 23.Sugiana C, Pagliarini DJ, Mckenzie M, Kirby DM, Salemi R, Abu-Amero KK, Dahl HH, Hutchison WM, Vascotto KA, Smith SM, Newbold RF, Christodoulou J, Calvo S, Mootha VK, Ryan MT, Thorburn DR. 2008. Mutation of C20orf7 disrupts complex I assembly and causes lethal neonatal mitochondrial disease. Am. J. Hum. Genet. 83:468–478. 10.1016/j.ajhg.2008.09.009 [DOI] [PMC free article] [PubMed] [Google Scholar]
- 24.Vahsen N, Candé C, Brière J-J, Bénit P, Joza N, Larochette N, Mastroberardino PG, Pequignot MO, Casares N, Lazar V, Feraud O, Debili N, Wissing S, Engelhardt S, Madeo F, Piacentini M, Penninger JM, Schägger H, Rustin P, Kroemer G. 2004. AIF deficiency compromises oxidative phosphorylation. EMBO J. 23:4679–4689. 10.1038/sj.emboj.7600461 [DOI] [PMC free article] [PubMed] [Google Scholar]
- 25.Vogel RO, Janssen RJRJ, van den Brand MAM, Dieteren CEJ, Verkaart S, Koopman WJH, Willems PHGM, Pluk W, van den Heuvel LPWJ, Smeitink JAM, Nijtmans LGJ. 2007. Cytosolic signaling protein Ecsit also localizes to mitochondria where it interacts with chaperone NDUFAF1 and functions in complex I assembly. Genes Dev. 21:615–624. 10.1101/gad.408407 [DOI] [PMC free article] [PubMed] [Google Scholar]
- 26.Nouws J, Nijtmans L, Houten SM, van den Brand M, Huynen M, Venselaar H, Hoefs S, Gloerich J, Kronick J, Hutchin T, Willems P, Rodenburg R, Wanders R, van den Heuvel L, Smeitink J, Vogel RO. 2010. Acyl-CoA dehydrogenase 9 is required for the biogenesis of oxidative phosphorylation complex I. Cell Metab. 12:283–294. 10.1016/j.cmet.2010.08.002 [DOI] [PubMed] [Google Scholar]
- 27.Vogel RO, Janssen RJRJ, Ugalde C, Grovenstein M, Huijbens RJ, Visch H-J, van den Heuvel LP, Willems PH, Zeviani M, Smeitink JA, Nijtmans MLGJ. 2005. Human mitochondrial complex I assembly is mediated by NDUFAF1. FEBS J. 272:5317–5326. 10.1111/j.1742-4658.2005.04928.x [DOI] [PubMed] [Google Scholar]
- 28.Schmidt O, Pfanner N, Meisinger C. 2010. Mitochondrial protein import: from proteomics to functional mechanisms. Nat. Rev. Mol. Cell. Biol. 11:655–667. 10.1038/nrm2959 [DOI] [PubMed] [Google Scholar]
- 29.Huang G, Lu H, Hao A, Ng DCH, Ponniah S, Guo K, Lufei C, Zeng Q, Cao X. 2004. GRIM-19, a cell death regulatory protein, is essential for assembly and function of mitochondrial complex I. Mol. Cell. Biol. 24:8447–8456. 10.1128/MCB.24.19.8447-8456.2004 [DOI] [PMC free article] [PubMed] [Google Scholar]
- 30.Sheftel AD, Stehling O, Pierik AJ, Netz DJA, Kerscher S, Elsässer H-P, Wittig I, Balk J, Brandt U, Lill R. 2009. Human ind1, an iron-sulfur cluster assembly factor for respiratory complex I. Mol. Cell. Biol. 29:6059–6073. 10.1128/MCB.00817-09 [DOI] [PMC free article] [PubMed] [Google Scholar]
- 31.Zurita Rendón O, Shoubridge EA. 2012. Early complex I assembly defects result in rapid turnover of the ND1 subunit. Hum. Mol. Genet. 21:3815–3824. 10.1093/hmg/dds209 [DOI] [PMC free article] [PubMed] [Google Scholar]
- 32.Dunning CJR, McKenzie M, Sugiana C, Lazarou M, Silke J, Connelly A, Fletcher JM, Kirby DM, Thorburn DR, Ryan MT. 2007. Human CIA30 is involved in the early assembly of mitochondrial complex I and mutations in its gene cause disease. EMBO J. 26:3227–3237. 10.1038/sj.emboj.7601748 [DOI] [PMC free article] [PubMed] [Google Scholar]
- 33.McKenzie M, Tucker EJ, Compton AG, Lazarou M, George C, Thorburn DR, Ryan MT. 2011. Mutations in the gene encoding C8orf38 block complex I assembly by inhibiting production of the mitochondria-encoded subunit ND1. J. Mol. Biol. 414:413–426. 10.1016/j.jmb.2011.10.012 [DOI] [PubMed] [Google Scholar]
- 34.Berger I, Hershkovitz E, Shaag A, Edvardson S, Saada A, Elpeleg O. 2008. Mitochondrial complex I deficiency caused by a deleterious NDUFA11 mutation. Ann. Neurol. 63:405–408. 10.1002/ana.21332 [DOI] [PubMed] [Google Scholar]
- 35.Mick DU, Dennerlein S, Wiese H, Reinhold R, Pacheu-Grau D, Lorenzi I, Sasarman F, Weraarpachai W, Shoubridge EA, Warscheid B, Rehling P. 2012. MITRAC links mitochondrial protein translocation to respiratory-chain assembly and translational regulation. Cell 151:1528–1541. 10.1016/j.cell.2012.11.053 [DOI] [PubMed] [Google Scholar]
- 36.Gerards M, Sluiter W, van den Bosch BJC, de Wit LEA, Calis CMH, Frentzen M, Akbari H, Schoonderwoerd K, Scholte HR, Jongbloed RJ, Hendrickx ATM, de Coo IFM, Smeets HJM. 2010. Defective complex I assembly due to C20orf7 mutations as a new cause of Leigh syndrome. J. Med. Genet. 47:507–512. 10.1136/jmg.2009.067553 [DOI] [PMC free article] [PubMed] [Google Scholar]
- 37.Vogel RO, Dieteren CEJ, van den Heuvel LPWJ, Willems PHGM, Smeitink JAM, Koopman WJH, Nijtmans LGJ. 2007. Identification of mitochondrial complex I assembly intermediates by tracing tagged NDUFS3 demonstrates the entry point of mitochondrial subunits. J. Biol. Chem. 282:7582–7590. 10.1074/jbc.M609410200 [DOI] [PubMed] [Google Scholar]
- 38.Saada A, Vogel RO, Hoefs SJ, van den Brand MA, Wessels HJ, Willems PH, Venselaar H, Shaag A, Barghuti F, Reish O, Shohat M, Huynen MA, Smeitink JA, van den Heuvel MLP, Nijtmans LG. 2009. Mutations in NDUFAF3 (C3ORF60), encoding an NDUFAF4 (C6ORF66)-interacting complex I assembly protein, cause fatal neonatal mitochondrial disease. Am. J. Hum. Genet. 84:718–727. 10.1016/j.ajhg.2009.04.020 [DOI] [PMC free article] [PubMed] [Google Scholar]
- 39.Dieteren CEJ, Koopman WJH, Swarts HG, Peters JGP, Maczuga P, van Gemst JJ, Masereeuw R, Smeitink JAM, Nijtmans LGJ, Willems PHGM. 2012. Subunit-specific incorporation efficiency and kinetics in mitochondrial complex I homeostasis. J. Biol. Chem. 287:41851–41860. 10.1074/jbc.M112.391151 [DOI] [PMC free article] [PubMed] [Google Scholar]
- 40.Lazarou M, McKenzie M, Ohtake A, Thorburn DR, Ryan MT. 2007. Analysis of the assembly profiles for mitochondrial- and nuclear-DNA-encoded subunits into complex I. Mol. Cell. Biol. 27:4228–4237. 10.1128/MCB.00074-07 [DOI] [PMC free article] [PubMed] [Google Scholar]
- 41.Rodríguez-Hernández A, Cordero MD, Salviati L, Artuch R, Pineda M, Briones P, Gómez Izquierdo L, Cotán D, Navas P, Sánchez-Alcázar JA. 2009. Coenzyme Q deficiency triggers mitochondria degradation by mitophagy. Autophagy 5:19–32. 10.4161/auto.5.1.7174 [DOI] [PubMed] [Google Scholar]
- 42.Lieber DS, Calvo SE, Shanahan K, Slate NG, Liu S, Hershman SG, Gold NB, Chapman BA, Thorburn DR, Berry GT, Schmahmann JD, Borowsky ML, Mueller DM, Sims KB, Mootha VK. 2013. Targeted exome sequencing of suspected mitochondrial disorders. Neurology 80:1762–1770. 10.1212/WNL.0b013e3182918c40 [DOI] [PMC free article] [PubMed] [Google Scholar]
- 43.Escarceller M, Pluvinet R, Sumoy L, Estivill X. 2000. Identification and expression analysis of C3orf1, a novel human gene homologous to the Drosophila RP140-upstream gene. DNA Seq. 11:335–338 [DOI] [PubMed] [Google Scholar]
- 44.Nouws J, Calvaruso MA, Nijtmans L. 2012. A structural perspective on respiratory complex IA structural perspective on human complex I: structure and function of NADH:ubiquinhone oxidoreductase, p 198–217 Springer, Dordrecht, Netherlands [Google Scholar]
Associated Data
This section collects any data citations, data availability statements, or supplementary materials included in this article.