

Abstract
Mitochondrial degeneration is considered to play an important role in the development of diabetic peripheral neuropathy in humans. Mitochondrial degeneration and the corresponding protein regulation associated with the degeneration were studied in an animal model of diabetic neuropathy. PGC-1α and its-regulated transcription factors including TFAM and NRF1, which are master regulators of mitochondrial biogenesis, are significantly downregulated in streptozotocin diabetic dorsal root ganglion (DRG) neurons. Diabetic mice develop peripheral neuropathy, loss of mitochondria, decreased mitochondrial DNA content and increased protein oxidation. Importantly, this phenotype is exacerbated in PGC-1α (−/−) diabetic mice, which develop a more severe neuropathy with reduced mitochondrial DNA and a further increase in protein oxidation. PGC-1α (−/−) diabetic mice develop an increase in total cholesterol and triglycerides, and a decrease in TFAM and NRF1 protein levels. Loss of PGC-1α causes severe mitochondrial degeneration with vacuolization in DRG neurons, coupled with reduced state 3 and 4 respiration, reduced expression of oxidative stress response genes and an increase in protein oxidation. In contrast, overexpression of PGC-1α in cultured adult mouse neurons prevents oxidative stress associated with increased glucose levels. The study provides new insights into the role of PGC-1α in mitochondrial regeneration in peripheral neurons and suggests that therapeutic modulation of PGC-1α function may be an attractive approach for treatment of diabetic neuropathy.
Keywords: neuropathy, mitochondria, diabetes, oxidative stress
Introduction
Diabetes-induced-oxidative damage in neurons, axons, and Schwann cells has been proposed as a unifying mechanism for diabetic neuropathy (Anjaneyulu et al., 2008; Christianson et al., 2003; Coppey et al., 2006; He et al., 2002; Ho et al., 2006; Kishi et al., 2002; Obrosova 2002; Obrosova et al., 2005; Russell et al., 2008; Sasaki et al., 1997; Song et al., 2003; Vincent et al., 2004; Vincent et al., 2006; Yagihashi et al., 2001). One mechanism for generation of oxidative stress is that an increased metabolic influx into mitochondria (Mt) increases respiration and results in a high proton gradient, leading to increased production of reactive oxygen species (ROS). Consistent with this notion, there is an increase in Mt inner membrane depolarization and degeneration of Mt in diabetic neuropathy (Huang et al., 2003; Kishi et al., 2002; Russell et al., 2002; Vincent et al., 2004). These impaired Mt may be rescued by the activation of Mt biogenesis or regeneration of new Mt. Thus, activation of Mt biogenesis may be protective under conditions where significant Mt degeneration is present.
Peroxisome proliferator-activated receptor-gamma co-activator 1α (PGC-1α) is a transcriptional co-activator and a master regulator for Mt biogenesis in many tissues including the nervous system (Lehman et al., 2000; Lin et al., 2002; Puigserver et al., 1998; St Pierre et al., 2006). PGC-1α is a promising target for therapy for neurological disease. For example, the pan-PPAR agonist, bezafibrate, upregulates PGC-1α and exerts beneficial effects in a transgenic mouse model of Huntington’s disease (Johri et al., 2012). PGC-1α activates transcriptional factors such as nuclear respiratory factor 1 (NRF1) and Mt transcription factor A (TFAM), which in turn induce Mt respiration proteins and lead to replication of the Mt genome (Kelly and Scarpulla 2004; Puigserver and Spiegelman 2003; Wu et al., 1999). PGC-1α has been mapped to chromosome 4P15.1, a region associated with basal insulin levels in Pima Indians that are at high risk of developing diabetes and diabetic related complications (Esterbauer et al., 1999). Furthermore, common polymorphisms of PGC-1α are associated with conversion from impaired glucose tolerance to diabetes (Andrulionyte et al., 2007). Thus, it is likely that PGC-1α and its downstream signaling intermediates are important in normal Mt regulation in diabetic subjects (Mootha et al., 2003).
PGC-1α has been clearly demonstrated in human brain and other neurons (Cowell et al., 2007; Cowell et al., 2009), and knockout of this gene in mice is associated with CNS neurodegeneration that includes the formation of large vacuoles in the neuropil and defects in energy metabolism (Leone et al., 2005; Lin et al., 2004). However, despite these findings in the CNS and other tissues, the roles of PGC-1α in Mt biogenesis in the peripheral nervous system (PNS) and specifically in diabetic neuropathy are completely unknown. Given the importance of PGC-1α in regulating Mt function of CNS neurons and evidence of downregulation of PGC-1α in diabetes, we sought to determine whether loss of PGC-1α by genetic ablation or diabetic stress causes peripheral nervous system dysfunction and if overexpression of PGC-1α can prevent oxidative injury. We hypothesize that impairment of PGC-1α mediated Mt regulation could contribute to the pathogenesis of diabetic neuropathy and that PGC-1α may serve as a target for treatment.
Material and Methods
Animals
All animal procedures were approved by the Institutional Animal Care and Use Committee of the University of Maryland at Baltimore. Male C57Bl/6J mice (Jackson Laboratory, Bar Harbor, ME) were housed in a certified animal care facility and fed standard chow (Harlan Teklad, #7001, Madison, WI) with a 12-h light/dark cycle and free access to food and water. At 3 months of age, hyperglycemia was induced via serial intraperitoneal injections of streptozotocin (STZ) over 6 days and were given sucrose water and small amounts of food throughout the STZ treatment as follows: day 1-remove food for up to 6 hours, day 2 – 85 mg/kg STZ injection, day 3 – 70 mg/kg STZ, day 4 – 55 mg/kg STZ, day 5 - regular water and food, day 6 - check glucose and give 55 mg/kg more STZ to mice with serum glucose levels below 300 mg/dl. Mice having blood glucose levels of 300 mg/dl (16.7 mM) or greater were considered to be diabetic. Age-matched non-diabetic control male mice were injected with vehicle instead of STZ. PGC-1α (+/+) mice were tested at 1, 4 and 6 months after induction of diabetes. PGC-1α (−/−) and WT controls were tested after 4 and 8 weeks of STZ diabetes. In this experiment, there were 4 groups of mice at each time point. Four week diabetic and control mice: PGC-1α (−/−) (n = 10), PGC-1α (−/−) with diabetes (n = 14), PGC-1α (+/+) (n = 13), PGC-1α (+/+) with diabetes (n = 14). Eight week diabetic and control mice: PGC-1α (−/−) (n = 13), PGC-1α (−/−) with diabetes (n = 13), PGC-1α (+/+) (n= 16), PGC-1α (+/+) with diabetes (n = 16).
Evaluation of Nerve Conduction Velocity and Von-Frey Sensory Testing
For nerve conduction studies, mice were anesthetized either with ketamine 80–90mg/kg, and Xylazine 5–10 mg/kg or isoflurane at 4–5% for induction and 1–2% for maintenance. Isoflurane was dispensed from a precision vaporizer with charcoal scavenger. The animal was provided with thermal support and warming lamps. Electrodes were placed adjacent to the nerve to obtain near nerve recordings using a 60–80 mA square wave stimulus for 0.1–0.3 msec. Tail nerve conduction studies were measured over a 4 cm distance from the base of the tail (Vincent et al., 2007b) and sciatic nerve conductions were measured similar to methods described in rat studies (Anjaneyulu et al., 2008; Russell et al., 2008). Orthodromic tail compound muscle action potentials (CMAP) were obtained by recording at the tip of the tail and orthodromic sensory potentials by recording at the base of the tail. Sensory responses were averaged until the sensory nerve action potential response was stable. In the hind limb, dorsal foot triphasic CMAP responses were recorded with stimulation at the malleolus, and proximally in the sciatic notch. Tail and limb temperatures were maintained between 32–33 °C. The onset latency and peak amplitude were measured.
Mechanical allodynia was assessed using Somedic von Frey monofilaments using the Semmes-Weinstein series (Somedic Sales AB). Ordinal numbers above 4 were applied gently on the fat part of the both plantar heels until the hair started to bend and maintained for approximately 2 seconds. The threshold was defined as the minimal bending force of the thinnest filament sensed by the mouse in an ascending and descending series of applications. Animals were acclimatized at least 2 days on the testing mesh floor before the final experiment. The hair was applied only when the mouse was stationary and standing on all four paws. A withdrawal response is considered valid only if the hind paw is completely removed from the platform. A trial consisted of application of a von Frey hair to the hind paw five times at 5 s intervals or as soon as the hind paw was placed appropriately on the platform. If withdrawal did not occur during five applications of a particular hair, the next larger hair in the series was applied over three successive trials. Second and third testing sessions were run for each of the left and right hind paws.
Fiber Morphometry
The L5 DRG from diabetic and control mice, at six months after induction of STZ diabetes, was harvested from perfusion fixed animals, post-fixed and semithin sections (0.5 microns thick) prepared as previously described (Russell et al., 1999). Sections were stained with 1% toluidine blue and 1% sodium borate for approximately 30 seconds at 60°C. The nerve root sections were obtained as closely to the DRG capsule as possible. Sections were evaluated under oil immersion (60X objective) on an Olympus microscope. Ten randomly selected regions from each fascicle were counted using a MetaMorph® Imaging System (Universal Imaging Corporation, Downingtown, PA) and fiber density was determined as the number of fibers within the area of the measured region, averaged over the whole fascicle. Myelin and axon area, myelin thickness and g-ratio (defined as axon diameter/total fiber diameter) were measured.
Quantitative Real-Time PCR Measurement of Mt DNA and Other Genes
RNA and DNA were isolated from DRG samples using a standard Invitrogen protocol. The ratio of mitochondrial DNA (mtDNA) to nuclear DNA (nDNA) was determined using a quantitative PCR method. The Ct (cycle threshold) values of mtDNA and nDNA were determined using the protocol developed to quantify mtDNA and nDNA from small samples (Andreasson et al., 2002; Anjaneyulu et al., 2008). We used the Ct values to calculate the relative mtDNA copy number in DRG neurons. Relative ratio of NADPH dehydrogenese subunit 1 (ND1, encoded on the Mt genome) over lipoprotein lipase (LPL, encoded on the nuclear genome) was determined as described previously (Bogacka et al., 2005). Primers for mouse ND1 and LPL (Applied Biosystems) sequences were as follows. ND1 Primers: forward: CAGCCTGACCCATAGCCATAATAT, reverse: TGATTCTCCTTCTGTCAGGTCGAA, probe: CCCTAGCAGAAACAAAC. LPL1 Primers: forward: GAGTGGTGCTCTCTGAATAAGGTT, reverse: GAAAGAGGCAGTTCCATAGATGACA, probe: CCATGCAGGATTCATGC.
For other real-time PCR experiments, primers (Applied Biosystems) assay IDs are:- PGC1α: Mm01208835_m1, NRF1: Mm01135609_m1, TFAM: Mm00447485_m1, manganese superoxide dismutase (MnSOD/SOD2): Mm00449726_m1, glutathione peroxidase (GPX1): Mm00656767-g1. Individual genes were run against β-actin.
PGC-1α Knockout (−/−) Mice
Mice were generated as previously described (Leone et al., 2005). Mice used in experiments have been backcrossed at least 7 times on to the C57Bl6/J WT strain to generate mice with >90% purity on this background. Homozygous PGC-1α knock out (PGC-1α −/−) mice were used in experiments. Sex- and age-matched or littermate controls were used.
Skin Biopsy
Staining for intraepidermal nerve fiber density (IENFD) and measurement was performed as previously described (Anjaneyulu et al., 2008; Lauria et al., 2005a). The mean intraepidermal nerve fibers density (IENFD) and length were measured using standardized measurement protocols and compared to controls (Lauria et al., 2005b). IENFD was determined by the number of complete baseline crossings of nerve fibers at the dermo-epidermal junction divided by the calculated length of the epidermal surface. In addition to the IENFD, the mean dermal nerve fiber density (DNFD) was determined by measuring the average number of fibers per mm in the dermal layer lying just below the dermo-epidermal junction.
Western Blot Analysis and DNP Derivatization
DRG neurons were homogenized in lysis buffer (50 mM Tris-HCl, pH 7.4, 1% SDS, 1%Triton X-100, and 150 mM NaCl). Proteins (25 μg) were derivatized and SDS-PAGE gels prepared as previously described (Choi et al., 2002). Nitrocellulose membranes were probed with anti-PGC-1α (provided by Dr. Daniel Kelly’s lab, 1:15000), anti-TFAM (Novus Bio. CO, 1:16,000), anti-NRF1 (Santa Cruz Biotechnology, CA, 1:1000), anti-DNP (Molecular Probes, CA, 1:16,000), and anti-actin antibodies (Chemicon, MA). Antibody binding was detected using the SuperSignal chemiluminescence’s kit (Pierce) and an Alpha Innotech imaging system.
Mt Morphometry using Electron Microscopy
L5 DRG neurons were embedded and 90 nm sections were used for electron microscopy analysis as previously described (Russell et al., 1999). Imaging of samples at 32,000 times magnification was performed on a Philips CM-100 transmission electron microscope equipped with a Kodak 1.6 Megaplus high-resolution digital camera. Mt were defined as vacuolar structures in which a double membrane and cristae could be clearly observed. Mt from ten adjacent sections were measured from the L5 DRG of each animal and were averaged across the individual sections and across all the sections for each mouse.
Mt Oxygen Consumption
Oxygen consumption was measured using a thermostatically-controlled Clark-type O2 electrode (Hansatech Instruments, Norfolk, England) as previously described (Schuh et al., 2005). Respiratory substrates, 5 mM L-malate and 5 mM L-glutamate plus 1 mM MgCl2 and 0.8 mM ADP in potassium chloride buffer (37°C) containing 125 mM KCl ultrapure (J.T. Baker, Philipsburg, NJ), 20 mM Hepes, 2 mM K2HPO4, and 0.01 mM EGTA (pH 7.0), were placed in the chamber. Isolated Mt from mouse DRG were added to the chamber 2 min later and state 3 respiration was measured. Approximately 2 min later, state 3 was terminated and state 4 respiration (resting) was initiated with the addition of the ATP synthase inhibitor oligomycin (1.25 μg/ml). The maximal rate of uncoupled respiration was subsequently measured by titration with 54 nM carbonyl cyanide 4-(trifluoromethoxy)phenylhydrazone (FCCP).
Adult Mouse Neuron Culture and Measurement of Oxidative Stress and Cellular Injury
DRG were collected from adult WT C57Bl/6J mice. DRG were placed in Leibovitz’s L-15 media, centrifuged to pellet, and 0.5 mL of Papain (2mg/ml in Hanks Balanced Solution) and 0.5 mL collagenase (2.5% in sterile water, Worthington) were added and incubated for 30 minutes at 37°C. After 30 minutes, 2 mls of FBS (Atlanta Biological) was added to inhibit the enzymes, cells were centrifuged, and plating media was added (DMEM with high glucose, 4.5 g/L (Invitrogen), 10% FBS (Atlanta Biologicals), 10% F-12 (Invitrogen). Dissociated neurons were resuspended (0.5 mls) to ensure equal cell numbers in each well and were then added to 24 well poly-ornithine (Sigma) coated plates. Cells were incubated for 24 hours with 5% CO2 at 37°C. After 24h, DRG plating media was removed and replaced with DRG feeding media containing DMEM with 1 g/L glucose (Lonza), B27 medium without anti-oxidants (Invitrogen), 40 μM (final concentration) of 5-flouro-2′-deocyuridine (FUDR, Sigma), 2 mM (final concentration) of GlutaMAX (Invitrogen), and penicillin-streptomycin-neomycin mixture (Invitrogen). After 24 hours, DRG feeding media was replaced with selenium-hydrocortisone-transferin-estradiol (SHTE) media for 24 hours. The final concentration of media components was as follows: selenium 5.2 μg/ml, hydrocortisone 7.6 μg/ml (Sigma), transferin 10 μg/ml (Sigma), estradiol 5.4 μg/ml (Sigma), FUDR (Sigma), penicillin-streptomycin (Invitrogen). After 24 hours in SHTE, cells were infected with PGC-1α adenovirus (MOI 4000:1 virus), GFP adenovirus (Ad.GFP) (MOI 4000:1) diluted in 150 μl of SHTE media. After a 90 minute incubation, 300 μl of SHTE media was added to each well. After 24 hours of viral infection, control cells were cultured in a total of 5.5 mM glucose and high glucose treated neurons in 25 mM glucose. As a measure of oxidative stress, DCF was measured as previously described (Berent-Spillson and Russell 2007). Using similar conditions, DRG neurons from C57Bl/6J mice were cultured in normal glucose (total of 5 mM) or high glucose (total 30 mM). DHE was used to assess real-time formation of superoxide as previously described (Berent-Spillson and Russell 2007).
Cleaved caspase-3 and DAPI staining and measurement was completed as previously described (Berent-Spillson and Russell 2007). Cleaved caspase-3 (Asp175) antibody detects endogenous levels of the large fragment (17/19 kDa) of activated caspase-3 resulting from cleavage adjacent to Asp175.
Statistics
Comparison of dependent variables was performed on transformed data using factorial analysis of variance (ANOVA), and individual comparisons were made using students T-test, assuming unequal variances (Russell et al., 2002; Russell et al., 2008). Levels of significance were determined from 2-tailed T-tests. An observer blinded to the experimental condition made measurements. Bar graphs illustrate the mean ± standard error of the mean.
Results
Nerve Conduction and Morphometry in Acute and Chronically Diabetic Mice
To determine if there was evidence of axonal degeneration in C57Bl/6J (PGC-1α +/+) STZ diabetic mice associated with the biochemical changes in the corresponding DRG, we assessed nerve conduction studies and nerve axonal morphometry in the L5 DRG sensory nerve roots after 6 months of STZ diabetes. Fasting glucose data at 1, 4 and 6 months are indicated in Table 1. In 6-month diabetic mice, glycosylated hemoglobin was significantly increased in diabetic mice, 13.40 ± 1.15%, compared to non-diabetic mice, 4.71 ± 0.13%, indicating prolonged hyperglycemia. Nerve conduction studies in diabetic compared to non-diabetic animals over 6 months show a significant and progressive difference in the sciatic motor conduction velocity (Table 1). Importantly, there are clear differences in nerve conduction studies even at 1 month. The earliest time point that we were able to detect evidence of neuropathy after induction of diabetes with STZ, was at two weeks. The corresponding sciatic nerve conduction velocity was 55.667 ± 3.20 m/s in non-diabetic animals and 32.065 ± 4.18 m/s in diabetic mice (P <0.01).
Table 1.
Glucose and Nerve Conduction Changes in Chronically Diabetic C57Bl/6J Mice.
| Diabetes Duration | 1 month n=24 |
4 months n=18 |
6 months n=8 |
|
|---|---|---|---|---|
| Fasting Blood Glucose (mg/dl) | Nondiabetic | 129.06±2.19 | 133.00±2.71 | 135.75±7.24 |
| Diabetic | 444.7±12.30# | 411.61±21.01# | 500.67±31.94# | |
| Tail-motor (latency, msec) | Non-diabetic | 1.79±0.03 | 2.26±0.02 | 2.06±0.02 |
| Diabetic | 1.95±0.03* | 2.74±0.11** | 2.57±0.12** | |
| Tail-sensory (velocity, m/sec) | Non-diabetic | 30.7±0.9 | 26.9±0.7 | 29.2±0.5 |
| Diabetic | 29.5±0.7 | 23.2±1.2* | 26.3±0.7** | |
| Sciatic-motor (velocity, m/sec) | Non-diabetic | 45.5±2.2 | 55.0±5.7 | 59.4±7.5 |
| Diabetic | 38.4±1.2* | 39.6±1.4* | 42.6±1.6** | |
Data are expressed as mean ± SEM.
: P<0.05,
: P<0.01 diabetic versus non-diabetic,
P<0.001 diabetic versus non-diabetic.
For morphometry, about 100–150 axons were measured in each animal (Table 2). Compared to non-diabetic mice, morphometry of DRG nerve root in 6 month STZ diabetic mice indicated no statistically significant difference in the mean fiber density (Table 2). However, there was a significant decrease in the ratio of both small and large fiber groups in diabetic mice (Figure 1). Specifically, a significant reduction in the ratio of the largest myelinated fibers (defined as those fibers with a diameter > 10 μm, P=0.02) and of small myelinated fibers (defined as those fibers with a diameter < 7 μm, P <0.001), was observed in chronically STZ diabetic mice after 6 months of diabetes.
Table 2.
Neuropathy After 6 Months of Diabetes in the Adult C57Bl/6J Mouse is Characterized by Loss of the Largest Myelinated Fibers.
| Myelinated Fiber Counts | Non-Diabetic (n=7) | Diabetic (n=5) | Significance |
|---|---|---|---|
| Fiber density (/mm2) | 12,888 ± 2,300 | 11,548 ± 1,600 | NS |
| Fascicular Area (mm2) | 1.199 ± 0.037.10−3 | 1.254 ± 0.075.10−3 | NS |
| Axon Area (μm2) | 33.4 ± 6.41 | 30.64 ± 3.53 | NS |
| Axon Diameter (μm2) | 5.47 ± 0.61 | 5.39 ± 0.38 | NS |
| Myelin thickness (μm) | 1.67 ± 0.09 | 1.52 ± 0.08 | NS |
| g-ratio | 0.61 ± 0.03 | 0.64 ± 0.01 | NS |
| Ratio of fibers >10 μm Diam. | 0.13 | 0.069 | p=0.02 |
NS: not significant
Figure 1. Myelinated fibers are reduced in Chronically Diabetic Mice.

Fiber density histograms for non-diabetic (A) and diabetic (B) C57Bl/6J mice (6 months of diabetes) showing that there is a reduction in both larger myelinated fibers as indicated in Table 2, as well as smaller myelinated fibers.
Altered Mt Regeneration in DRG Neurons of Diabetic Mice
To determine whether the observed diabetic neuropathy is associated with altered Mt regeneration, we measured Mt density, Mt size, and Mt DNA content in DRG neurons of WT PGC-1α (+/+) mice after 6 months of diabetes using electron microscopy and real-time PCR methods. Five diabetic and five non-diabetic control mice were compared, with 10 sections and approximately 80–140 Mt per animal by using electron microscopy. There was a significant decrease in the total number of Mt measured in each of the diabetic compared to the control mice (Figure 2A), while the mean size of Mt in diabetic compared to control mice was significantly increased (Figure 2B). To measure Mt DNA copy number in DRG neurons, we used real-time PCR to obtain a relative ratio of ND1 (a gene coded on the Mt genome) over LPL (a gene coded on nuclear genome), an indicator for relative Mt DNA copy number. The results showed a significant decrease in ND1 while LPL remained stable, and there was a significant decrease in the ratio of ND1 to LPL in the DRG neurons of diabetic compared with non-diabetic mice at 6 months (Figure 2C). A similar decrease in Mt DNA was obtained from diabetic DRG at 4 months (data not shown, P <0.05).
Figure 2. Reduced Mt number and DNA in DRG neurons of chronically STZ diabetic mice compared with non-diabetic controls.
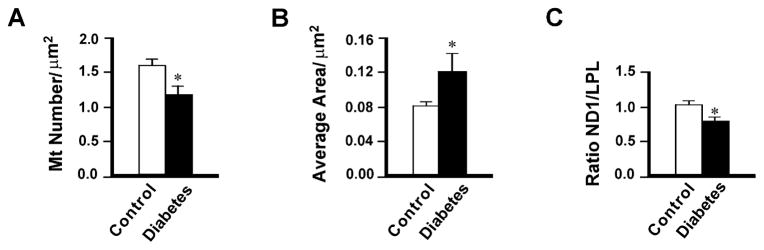
Mt density (A) and Mt size (B) were determined in mouse DRG using electron microscopy. Data are expressed as mean ± SEM. n=5. *P <0.05 between non-diabetic and diabetic mice. For measurement of Mt DNA content (C), total DNA was isolated from non-diabetic control and diabetic mice at 6 months and run for quantitative real-time PCR to obtain a relative ratio of ND1 (a gene coded on the Mt genome) over LPL (a gene coded on nuclear genome), an indicator for relative Mt DNA copy number. Data are normalized to controls and expressed as mean ± SEM. *P<0.05 by t-test between non-diabetic and diabetic mice. There is a decreased Mt density (A) and Mt DNA (C), and increased Mt size (B) in DRG neurons of diabetic mice compared with non-diabetic animals.
We determined if there was a decrease in Mt DNA content in DRG from STZ diabetic mice at the earliest time point that we were able to detect neuropathy (based on a decrease in the sciatic motor conduction velocity). After 2 weeks of diabetes, the ND1/LPL ratio was 0.78 in diabetic DRG when corrected to a non-diabetic control ratio of 1.0.
Characteristics of PGC-1α (+/+) and PGC-1α (−/−) in Control and Diabetic Mice
The body weight, blood glucose levels, and lipid levels are shown in animal groups at 4 and 8 weeks after starting the experiment (Table 3). Both PGC-1α (+/+) diabetic and PGC-1α (−/−) diabetic mice lost a significant amount of weight. Fasting blood glucose and hemoglobin A1C were significantly elevated and insulin was decreased in both PGC-1α (+/+) diabetic and PGC-1α (−/−) diabetic mice but were not significantly different between the diabetic groups. Hemoglobin A1C and insulin levels were similar in PGC-1α (−/−) compared PGC-1α (+/+) mice. However, total cholesterol and triglycerides were significantly increased in PGC-1α (−/−) compared to PGC-1α (+/+) animals, and in PGC-1α (−/−) diabetic vs. PGC-1α (+/+) diabetic animals.
Table 3.
Metabolic and Nerve Conduction Values in PGC1α +/+, PGC1α −/− Non-Diabetic and Diabetic Mice
| Non-Diabetic vs 4 Week Diabetic Animals
| ||||||||
|---|---|---|---|---|---|---|---|---|
| Significance
|
||||||||
| PGC-1α +/+ (1) | PGC-1α +/+ DIAB (2) | PGC-1α −/− (3) | PGC-1 α −/− DIAB (4) | 1 vs 2 | 3 vs 4 | 1 vs 3 | 2 vs 4 | |
| n=10 | n=13 | n=14 | n=14 | |||||
| Weight (grams) | 28.70 ± 0.70 | 25.60 ± 0.60 | 31.90 ± 1.30 | 24.91 ± 0.70 | <0.001 | <0.001 | <0.05 | NS |
| Blood Glucose (mg/dl) | 154.20 ± 10.20 | 500.50 ± 37.10 | 114.50 ± 5.60 | 443.90 ± 35.50 | <0.01 | <0.001 | <0.01 | NS |
| Hemoglobin A1C(%) | 5.83 ± 0.50 | 11.41 ± 0.73 | 5.78 ± 0.13 | 11.04 ± 0.52 | <0.01 | <0.01 | NS | NS |
| Insulin (μU/ml) | 4.50 ± 0.17 | 2.12 ± 0.27 | 4.82 ± 0.92 | 1.96 ± 0.24 | <0.01 | <0.05 | NS | NS |
| Total cholesterol (mg/dl) | 84.70 ± 4.20 | 120.30 ± 19.20 | 139.80 ± 13.60 | 220.80 ± 22.50 | NS | <0.05 | <0.01 | <0.01 |
| Triglyceride (mg/dl) | 58.00 ± 8.40 | 133.20 ± 20.90 | 112.00 ± 11.40 | 176.30 ± 55.50 | <0.05 | NS | <0.01 | NS |
| Sciatic MCV (ms−1) | 52.20 ± 3.00 | 41.80 ± 2.40 | 47.70 ± 2.60 | 39.10 ± 1.60 | <0.05 | <0.01 | <0.05 | <0.05 |
| Tail SL (ms) | 1.06 ± 0.01 | 1.12 ± 0.02 | 1.14 ± 0.02 | 1.19 ± 0.02 | <0.05 | NS | <0.01 | <0.05 |
| Tail ML (ms) | 2.23 ± 0.05 | 2.42 ± 0.06 | 2.42 ± 0.04 | 2.52 ± 0.06 | <0.05 | NS | <0.01 | NS |
| Non-Diabetic vs 8 Week Diabetic Animals
| ||||||||
|---|---|---|---|---|---|---|---|---|
| Significance | ||||||||
| PGC-1α +/+ (1) | PGC-1α +/+ DIAB (2) | PGC-1α −/− (3) | PGC-1 α −/− DIAB (4) | 1 vs 2 | 3 vs 4 | 1 vs 3 | 2 vs 4 | |
|
|
||||||||
| n=13 | n=13 | n=16 | n=16 | |||||
| Weight (grams) | 32.40 ± 0.80 | 27.80 ± 0.60 | 31.50 ± 0.90 | 23.60 ± 0.70 | <0.001 | <0.001 | NS | NS |
| Blood Glucose (mg/dl) | 115.40 ± 11.00 | 550.50 ± 53.10 | 118.70 ± 9.00 | 542.80 ± 44.60 | <0.001 | <0.001 | NS | NS |
| Insulin (μU/ml) | 6.45 ± 0.15 | 2.93 ± 0.68 | 3.44 ± 0.73 | 2.00 ± 0.00 | <0.01 | <0.05 | NS | NS |
| Hemoglobin A1C(%) | 6.20 ± 0.14 | 12.20 ± 0.50 | 5.88 ± 0.18 | 11.46 ± 0.88 | <0.01 | <0.01 | NS | NS |
| Total cholesterol (mg/dl) | 86.00 ± 17.00 | 104.00 ± 6.00 | 135.80 ± 21.50 | 205.00 ± 29.00 | <0.05 | <0.05 | <0.01 | <0.01 |
| Triglyceride (mg/dl) | 45.50 ± 7.50 | 55.30 ± 9.00 | 75.80 ± 6.40 | 169.00 ± 12.50 | NS | <0.01 | <0.05 | <0.01 |
| Sciatic MCV (ms−1) | 49.10 ± 1.70 | 43.30 ± 1.90 | 45.30 ± 1.70 | 38.10 ± 2.10 | <0.05 | <0.05 | <0.05 | <0.05 |
| Tail SL (ms) | 1.04 ± 0.01 | 1.11 ± 0.02 | 1.15 ± 0.02 | 1.22 ± 0.03 | <0.01 | <0.05 | <0.001 | <0.01 |
| Tail ML (ms) | 2.13 ± 0.03 | 2.35 ± 0.04 | 2.36 ± 0.05 | 2.56 ± 0.07 | <0.001 | <0.05 | <0.01 | <0.05 |
MCV=motor conduction velocity, SL=sensory latency, ML=motor latency, NS=not significant
Diabetic and PGC-1α (−/−) Mice have Nerve Conduction and Sensory Testing Evidence of Neuropathy
Comparison of nerve conduction studies in PGC-1α (+/+) diabetic and non-diabetic mice, and PGC-1α (−/−) diabetic and non-diabetic mice after 4 and 8 weeks of diabetes are shown in Table 3. There was slowing of tail and sciatic nerve conduction values in PGC-1α (+/+) diabetic, PGC-1α (−/−) diabetic, and PGC-1α (−/−) non-diabetic mice compared to PGC-1α (+/+) non-diabetic mice. Statistical comparisons between each of the columns for each of the conditions are shown in Table 3: PGC-1α +/+ WT (column 1), PGC-1α +/+ diabetic (column 2), PGC-1α −/− knock out (column 3), PGC-1α −/− diabetes (column 4). In general, nerve conduction studies were worse in diabetic PGC-1α (−/−) animals than WT PGC-1α (+/+) diabetic animals consistent with the concept that PGC-1α knockout worsens neuropathy. Von-Frey sensory testing at 8 weeks is shown in Figure 3. Mechanical allodynia was greater in PGC-1α (−/−) diabetic animals compared to PGC-1α (+/+) diabetic mice, consistent with more severe neuropathy in PGC-1α (−/−) diabetic compared to PGC-1α (+/+) diabetic mice. Because of the high variance, this result was not statistically different.
Figure 3. von Frey mechanical allodynia in STZ diabetic and PGC-1α (−/−) mice.
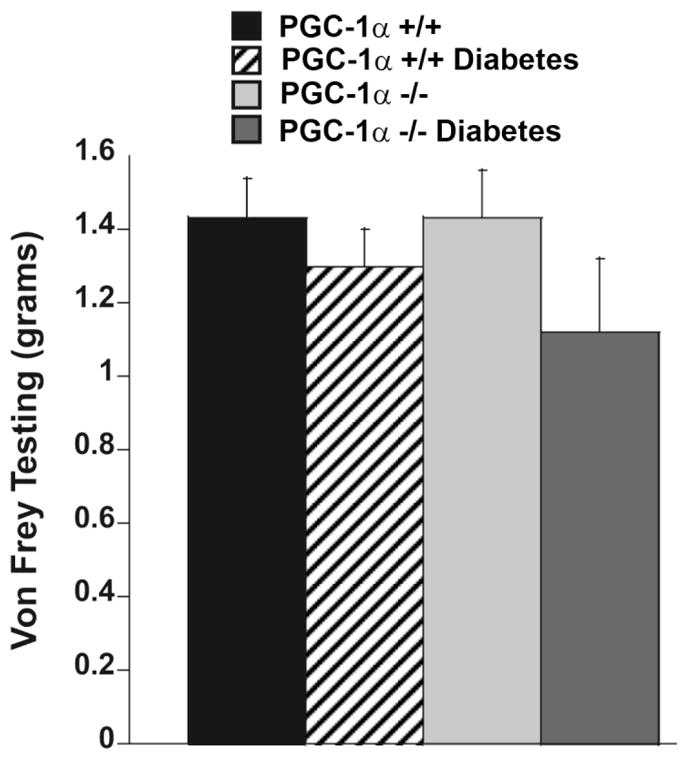
Mechanical allodynia is increased in diabetic and PGC-1α (−/−) mice but this is not statistically significant.
Since a longer duration of diabetes causes a high mortality in PGC-1α (−/−) mice, chronic neuropathy was assessed only in PGC-1α (+/+) WT mice up to 6 months (Table 1).
Intraepidermal Nerve Fiber Innervation in Diabetic and PGC-1α (−/−) Mice
As shown in Figure 4A, PGP 9.5-immunoreactive nerve fibers were abundant in both the epidermis and dermis of PGC-1α (+/+) non-diabetic control mice. In age-matched animals, 4 week diabetic PGC-1α (+/+), PGC-1α (−/−) non-diabetic and 4 week diabetic PGC-1α (−/−) mice showed a significant decrease in both epidermal and dermal nerve fibers along their length compared with PGC-1α (+/+) non-diabetic mice (Figure 4A). The mean intraepidermal nerve fiber density/mm (IENFD) was significantly decreased in PGC-1α (−/−) non-diabetic and diabetic PGC-1α (−/−) and diabetic PGC-1α (+/+) mice compared with PGC-1α (+/+) non-diabetic mice (P <0.001, Figure 4B). The IENFD was further decreased in PGC-1α (−/−) diabetic mice but this was not significantly different. The mean length (μm) of the fibers in the epidermis was decreased in PGC-1α (+/+) diabetic (8.57 ± 4.04) compared to PGC-1α (+/+) non-diabetic (66.67 ± 4.49) and PGC-1α (−/−) non-diabetic mice (P<0.001). Although the mean intraepidermal fiber length was reduced in PGC-1α (+/+) diabetic (8.57 ± 4.04) compared to PGC-1α (−/−) diabetic (8.00 ± 3.31), this was not statistically significant. The fiber length was significantly reduced in PGC-1α (−/−) diabetic compared to non-diabetic PGC-1α (−/−) mice (15.00 ± 4.35)(P <0.05). In contrast to the IENFD, the DNFD/mm was less severely affected in diabetic animals, thus allowing differences to be measured between PGC-1α (+/+) and PGC-1α (−/−) mice. The DNFD was reduced in STZ diabetic PGC-1α (+/+) (8.57 ± 1.37) compared to non-diabetic PGC-1α (+/+) mice (12.73 ± 0.99, P <0.05). Diabetes further reduced the DNFD in PGC-1α (−/−) mice (3.64 ± 0.85, P <0.01) compared to non-diabetic PGC-1α (−/−) mice (6.5 ± 0.91, P <0.05).
Figure 4. Decreased intraepidermal nerve fiber density (IENFD) and dermal nerve fiber density (DNFD) in STZ diabetic (4 weeks) and PGC-1α (−/−) mice.

A. Microphotographs are immunostained with anti-PGP 9.5 antibody in 50 μm cryocut paw skin sections. Arrows indicate intraepidermal nerve fibers; arrowheads indicate dermal nerve fibers (scale bar 30 μm). Note the marked reduction in IENFD in PGC-1α (+/+) diabetic, PGC-1α (−/−) non-diabetic, and PGC-1α (−/−) diabetic mice as compared to PGC-1α (+/+) non-diabetic mice. B. IENFD (number of intra epidermal nerve fibers per length of epidermis) is significantly reduced in PGC-1α (+/+) diabetic, PGC-1α (−/−) non-diabetic, and PGC-1α (−/−) diabetic mice as compared to PGC-1α (+/+) non-diabetic mice. Data indicates the mean ± SEM. ***P<0.001, as compared with PGC-1α (+/+) non-diabetic mice.
Changes in Mt DNA, Mt structure and function in PGC-1α (−/−) DRG
To determine if there was a change in Mt DNA in PGC-1α (−/−) and diabetic mice, Mt DNA copy number was measured in DRG neurons using quantitative real-time PCR to obtain a relative ratio of ND1 over LPL. There is reduction in Mt DNA in PGC-1α (−/−) compared to PGC-1α (+/+) mice (Figure 5). Furthermore, STZ diabetes reduced the Mt DNA copy number significantly in PGC-1α (+/+) mice and further decreased the Mt DNA copy number in PGC-1α (−/−) mice (P <0.001) when compared to non-diabetic PGC-1α (−/−) and diabetic PGC-1α (+/+) mice (Figure 5).
Figure 5. Reduced Mt DNA in DRG neurons of diabetic PGC-1α (+/+) and diabetic and non-diabetic PGC-1α (−/−) mice compared with non-diabetic controls after 8 weeks of diabetes.

Mt DNA was determined as described in Figure 2. Data are normalized to controls and expressed as mean ± SEM. ***P <0.001 between non-diabetic PGC-1α (+/+) and diabetic mice PGC-1α (+/+) and between non-diabetic PGC-1α (−/−) and non-diabetic PGC-1α (+/+) mice. # P <0.001 between diabetic PGC-1α (−/−) and non-diabetic PGC-1α (−/−) and ⊥ P <0.001 between diabetic PGC-1α (−/−) and diabetic PGC-1α (+/+) mice. There was no significant difference between diabetic PGC-1α (+/+) and non-diabetic PGC-1α (−/−) mice.
Given the observations that PGC-1α deficiency results in the exacerbation of diabetic peripheral neuropathy and reduced Mt DNA, we asked whether genetic loss of PGC-1α could in addition cause Mt degeneration in DRG neurons. We therefore examined Mt morphology using transmission electron microscopy (TEM) in DRG neurons of PGC-1α (−/−) mice. Compared to PGC-1α (+/+) neurons where the cristae and other Mt structures were normal, PGC-1α (−/−) DRG Mt show increased autophagic vacuoles and empty vacuolar structures (Figure 6i) consistent with Mt degeneration. Similar changes have been shown to occur in DRG from STZ diabetic rats (Russell et al., 1999).
Figure 6. (i) DRG neurons in PGC-1α (−/−) mice show Mt damage and abundant autophagic vacuoles.

Representative electron micrographs of DRG neurons from PGC-1α (+/+) (panels A and C) and PGC-1α (−/−) mice (panels B, D, E, and F). Panel A shows a normal DRG neuron from a PGC-1α (+/+) animal. Arrowheads indicate an increase in autophagic vacuoles containing electron dense material in PGC-1α (−/−) mice (B). Mt from PGC-1α (+/+) mice showing normal cristae structures (C). In panel D, arrows indicate vacuolar changes in the Mt of PGC-1α (−/−) mice. In panel E and F, white arrows show autophagic vacuoles and black arrows indicate empty vacuolar structures with double trilaminar membranes likely representing terminal Mt degeneration. (ii) In isolated Mt from DRG neurons from PGC-1α (−/−) mice there is reduced state 3 and 4 respiration consistent with reduced respiratory function. Measurements were made using a Clark electrode. Data is expressed as mean ± SEM. ***P<0.001 between PGC-1α (−/−) compared to PGC-1α (+/+) mice.
There is decreased respiratory function in Mt from PGC-1α (−/−) compared to PGC-1α (+/+) neurons (Figure 6ii). Phosphorylation capacity was measured with excess substrate and ADP (State 3 respiration) (Brand and Nicholls 2011). Electron transport capacity was measured in the presence of substrate and the uncoupler, FCCP. Mt phosphorylation capacity (state 3) and electron transport capacity (state 4), measured by the consumption of oxygen, was higher in the PGC-1α (+/+) neurons (P <0.001). In addition, the respiratory control index (RCI), an expression of how close the capacity of oxidative phosphorylation approaches the capacity for electron transport, has a ratio of ~1 indicating that the system is coupled and there is no respiration leak in PGC-1α (−/−) DRG Mt.
Altered Levels of Protein Expression Related to Mt Regeneration and Increased Levels of Protein Oxidation in Diabetic DRG Neurons
Because different isoforms of PGC-1α have been described in different tissues (Baar et al., 2002; Soyal et al., 2012), we determined the main isoforms recognized by PGC-1α antibodies (Figure 7). Immunoblot analysis with anti-PGC-1α antibodies revealed the presence of two distinct isoforms of PGC-1α that have different molecular masses (~ 91 and 35 kDa). These data confirm the presence of alternate isoforms of PGC-1α as previously described (Baar et al., 2002; Soyal et al., 2012).
Figure 7. There are two predominant PGC-1α isoforms in neurons: ~35 and ~91 kDa isoforms.
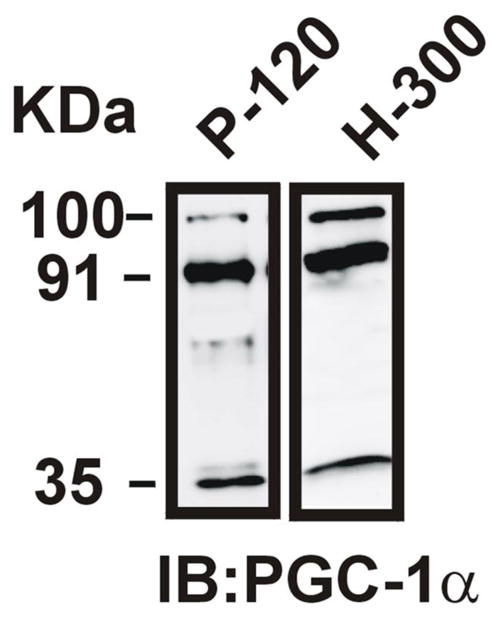
The P-120 antibody was developed using N-terminal aa 1–120 as epitope and was used for further experiments. The H-300 polyclonal antibody (Santa Cruz) was developed to the N-terminal 1–300 aa. Both antibodies show prominent bands at ~35 and ~91 kDa (the nuclear PGC-1α isoform).
To determine whether proteins regulating Mt regeneration including PGC-1α, TFAM, or NRF1 are affected in diabetic neuropathy, we performed quantitative Western blot analysis (Figure 8). Compared to the 91 kDa isoform, the PGC-1α ~ 35 kDa isoform showed the greatest measurable change in diabetic animals. The protein levels of ~ 35 kDa PGC-1α were significantly decreased in diabetic compared with non-diabetic DRG (Figure 8). TFAM and NRF1 showed a significantly decreased protein expression in PGC-1α (−/−) diabetic, PGC-1α (−/−) non-diabetic, and PGC-1α (+/+) diabetic mice compared to PGC-1α (+/+) non-diabetic mice.
Figure 8. Quantitative Western blot analysis of the levels of PGC-1α, TFAM, NRF-1, and oxidized proteins in DRG from PGC-1α (+/+) and PGC-1α (−/−) mice with and without diabetes.

A. Protein extracts (25 μg of protein/lane) from DRG of PGC-1α (+/+) non-diabetic control and 1month diabetic mice, and PGC-1α (−/−) non-diabetic control and 1 month diabetic mice were subjected to one-dimensional gel electrophoresis followed by immunoblotting with antibodies against PGC-1α, TFAM, NRF-1, DNP, and actin. B. The relative level of each protein was normalized to the actin level in the corresponding samples. The bar graph shows the results (mean ± SEM) from five PGC-1α (+/+) non-diabetic control and diabetic mice, and PGC-1α (−/−) non-diabetic control and diabetic mice. *P <0.05 for a decrease in the levels of PGC-1α, TFAM and NRF-1 in PGC-1α (+/+) diabetic mice, or PGC-1α (−/−) diabetic and control mice compared to PGC-1α (+/+) non-diabetic control mice. ***P <0.001 for an increase in oxidized proteins in PGC-1α (+/+) diabetic compared to PGC-1α non-diabetic (+/+) mice, ⊥ P <0.01 for PGC-1α (−/−) diabetic compared to PGC-1α (+/+) diabetic mice, # P <0.05, PGC-1α (+/+) diabetic compared to PGC-1α (−/−) non-diabetic mice, **P <0.01 for an increase in oxidized proteins in PGC-1α (−/−) diabetic mice compared to PGC-1α (−/−) non-diabetic mice.
Protein carbonylation has been widely used as a biomarker of oxidative damage to proteins that occurs in diabetes (Choi et al., 2002; Martin-Gallan et al., 2003; Turk 2009). There was a significant increase in the total oxidized proteins in PGC-1α (−/−) diabetic and non-diabetic mice, as well as PGC-1α (+/+) diabetic mice compared to PGC-1α (+/+) non-diabetic mice (Figure 8). Diabetes further increased oxidative damage to proteins in DRG from PGC-1α (−/−) compared to PGC-1α (+/+) mice.
To examine whether the observed alteration of Mt regeneration in diabetes is correlated with expression of the genes regulating Mt regeneration including PGC-1α, TFAM, or NRF1, we performed quantitative real-time-PCR. The results revealed a small reduction in the gene expression level of PGC-1α and TFAM at 1 month of diabetes, while the NRF1 level was slightly changed (Figure 9A).
Figure 9. Altered gene expression associated with Mt regeneration in STZ diabetic PGC-1α (+/+) and PGC-1α (−/−) mice.

Gene expression for PGC-1α, TFAM and NRF-1 were determined by quantitative real-time PCR in DRG neurons isolated from non-diabetic PGC-1α (+/+) and PGC-1α (−/−) mice and diabetic PGC-1α (+/+) and PGC-1α (−/−) mice after 1 month of STZ diabetes. Data are expressed as mean ± SEM. (A) PGC-1α and TFAM were decreased in diabetic compared to non-diabetic PGC-1α (+/+) mice. **P<0.01 between PGC-1α (+/+) non-diabetic and PGC-1α (+/+) diabetic mice. (B) PGC-1α and NRF-1 were decreased in PGC-1α (−/−) compared to PGC-1α (+/+) mice. ***P<0.001 between PGC-1α (+/+) and PGC-1α (−/−) mice. (C) TFAM expression was decreased in diabetic (+/+) mice. There was no significant difference between diabetic and non-diabetic PGC-1α (−/−) mice. *P<0.05 between PGC-1α (+/+) non-diabetic and diabetic mice. (D) NRF-1 was decreased in both non-diabetic and diabetic PGC-1α (−/−) mice compared to non-diabetic and diabetic PGC-1α (+/+) mice. There was no significant difference between diabetic and non-diabetic mice. ***P<0.001 between non-diabetic and diabetic PGC-1α (−/−) mice compared to non-diabetic and diabetic PGC-1α (+/+) mice. (E) Both GPX and MnSOD gene expression is decreased in DRG from PGC-1α (−/−) compared to PGC-1α (+/+) mice (**P<0.01).
Because loss of PGC-1α exacerbated the severity of neuropathy, we determined the effect of PGC-1α knockout on genes regulating Mt regeneration. In PGC-1α (−/−) compared to PGC-1α (+/+) DRG, NRF1 expression was significantly decreased (Figure 9B) with little difference between diabetic and non-diabetic controls (Figure 9D). In contrast, TFAM expression was increased in PGC-1α (−/−) mice and further increased with diabetes (Figure 9B and 9C). Furthermore, in parallel with loss of Mt, there was a corresponding decrease in GPX and MnSOD gene expression in PGC-1α (−/−) DRG (Figure 9E).
PGC-1α Overexpression Prevents Oxidative Stress in DRG Neurons
In order to test if PGC-1α overexpression prevents oxidative injury in neurons, adult mouse DRG neurons were infected with a PGC-1α adenovirus (Ad. PGC-1α). The MOI was 4000:1, which allows 90% transfection efficiency. Figure 10 is representative of four separate experiments and shows that Ad.PGC-1α prevents high glucose-induced oxidative stress over 24 hours using H2DCF, a marker of oxidative stress and DHE, a measure of superoxide generation. Ad.PGC-1α also prevented high glucose-induced generation of activated caspase-3. In contrast, control Ad.GFP had no effect on glucose-induced oxidative stress.
Figure 10. PGC-1α overexpression prevents oxidative stress and neuronal injury in cultured adult mouse DRG neurons.

(A) Dissociated adult DRG neurons from C57Bl/6J mice were infected with adenovirus carrying PGC-1α (Ad. PGC-1α) or GFP (Ad.GFP) gene. For 24 hours after viral infection, DRG neurons were cultured with a total glucose concentration of 5.5 mM (Control-Con) or 25mM (Gluc). DCF positive neurons were counted by a blinded observer. *** P<0.001 in Ad.PGC-1α high glucose cultures (Gluc + Ad.PGC-1α) compared to high glucose (Gluc) and Ad.GFP high glucose cultures (Gluc + Ad.GFP). (B) Overexpression of Ad. PGC-1α reduces DHE levels in DRG neurons from adult C57Bl/6J mice cultured in high glucose (total 30 mM) compared to WT control glucose (total 5 mM). *** P <0.001 between WT high glucose and WT control glucose and between WT high glucose and control glucose with Ad. PGC-1α. *** P <0.01 between WT high glucose and high glucose with Ad. PGC-1α. There was no significant difference between WT control, WT control with Ad. PGC-1α, and high glucose with Ad. PGC-1α. (C) Overexpression of Ad. PGC-1α reduces active caspase-3 levels in DRG neurons from adult C57Bl/6J mice cultured in high glucose (total 30 mM) compared to WT control glucose (total 5 mM). *** P<0.001 between WT high glucose and WT control glucose and between WT high glucose and Ad. PGC-1α control glucose. ** P<0.01 between WT high glucose and high glucose with Ad. PGC-1α. There was no significant difference between WT control glucose, PGC-1α control with Ad. PGC-1α, and high glucose with Ad. PGC-1α.
Discussion
We report that loss of PGC-1α, a protein that is essential for Mt function and energy homeostasis, plays an important role in the pathogenesis of diabetic neuropathy in the PNS. A recent study reports that regulation of the AMPK- PGC-1α- sirtuin 3 axis protects peripheral nerve function in the diabetic rat (Yu et al., 2012). However, the current study presents novel evidence that loss of PGC-1α can directly cause neuropathy that is worsened by diabetes. This observation is supported by recent work that shows that phosphorylation and expression of adenosine monophosphate-activated protein kinase/ PGC-1α and Mt respiratory chain complex proteins are downregulated in DRG of both STZ diabetic rats and db/db mice (Chowdhury et al., 2013; Roy Chowdhury et al., 2012). Control of bioenergetics in the diabetic peripheral nerve is in part controlled by the sirtuin-AMPK and PGC-1α signaling axis in which the upstream members sense the metabolic demands of cells whereas the downstream member, PGC-1α, regulates Mt biogenesis and function (Canto and Auwerx 2011; Chowdhury et al., 2013; Roy Chowdhury et al., 2012).
There was no difference in plasma glucose, hemoglobin A1C, or insulin levels between PGC-1α (+/+) diabetic and PGC-1α (−/−) diabetic mice, indicating that exacerbation of peripheral nerve injury associated with reduced PGC-1α levels is independent of glycemic control. However, there was a significant increase in total cholesterol and triglyceride levels in non-diabetic PGC-1α (−/−) compared to PGC-1α (+/+) mice and PGC-1α (−/−) diabetic compared to PGC-1α (+/+) diabetic mice. These findings are consistent with recent observations that increased lipid levels are associated with neuropathy (Callaghan et al., 2012) possibly by oxLDL interaction with the receptor LOX-1 (Vincent et al., 2009; Wiggin et al., 2009). Impaired fatty acid oxidation is strongly correlated to impaired activation of PGC-1α (Heilbronn et al., 2007) and adipose-specific ablation of PGC-1α results in Mt dysfunction (Kleiner et al., 2012). Thus, Mt PGC-1α has a critical role in lipid metabolism.
Mice lacking PGC-1α by targeted gene deletion exhibited a mild neuropathy that was further worsened by diabetes. This indicates an important role for both impaired PGC-1α and resulting Mt degeneration in the observed abnormalities in the diabetic PNS. Epidermal fibers are small distal fibers that are very susceptible to mild diabetes (Smith et al., 2006). In this study, the IENFD was so severely affected by STZ diabetes that it was difficult to detect differences between groups. In contrast, the dermal fibers are less severely affected in mild diabetes (Smith et al., 2006). In this study, the DNFD was significantly decreased in diabetic PGC-1α (−/−) compared to diabetic PGC-1α (+/+) and non-diabetic PGC-1α (−/−) mice, supporting the concept that knockout of PGC-1α increases susceptibility to STZ diabetes-induced neuropathy. This concept was supported by the abnormal sciatic motor and tail sensory conduction data that assesses large fiber function that is also more resistant to early or mild diabetes.
Loss of PGC-1α may worsen neuropathy due to impaired antioxidant defense related to impaired Mt function. Several lines of evidence support this idea: PGC-1α was markedly reduced in diabetic DRG neurons; the Mt of DRG neurons in PGC-1α (−/−) non-diabetic mice contained abnormal vacuoles consistent with Mt degeneration; there is a decrease in Mt respiratory function; gene expression of GPX and MnSOD are reduced; protein levels of transcription factors that regulate Mt transcription and are important for normal Mt homeostasis e.g. TFAM and NRF1 were significantly decreased in DRG neurons of both PGC-1α (−/−) non-diabetic and diabetic mice; levels of oxidized proteins consistent with increased oxidative stress were significantly increased; and overexpression of PGC-1α, using an adenoviral construct, prevented the generation of ROS in adult mouse DRG cultures. Although, showing that PGC-1α overexpression in DRG prevents neuropathy in an animal model would further support these studies, unfortunately the PGC-1α overexpressing mouse develops a fatal cardiomyopathy (Lehman et al., 2000). The role of PGC-1α in Mt regulation are supported by: (1) data showing an inverse correlation between muscle PGC-1α levels and Mt activity in humans with insulin resistance and diabetes (Mootha et al., 2003; Patti et al., 2003) and (2) previous studies showing PGC-1α (−/−) mice have degenerating Mt in the CNS (Leone et al., 2005).
To assess whether Mt dysfunction plays a role in the pathogenesis of peripheral neuropathy, we analyzed Mt degeneration in DRG neurons from chronically diabetic animals. There was a diminished Mt number, diminished Mt DNA content, and an increased Mt size in diabetic DRG neurons. Thus, in STZ diabetic peripheral neurons there is both loss of Mt and degeneration of Mt. Loss of Mt DNA in STZ diabetic animals is increased by knockout of PGC-1α. Previous studies have shown that an increase in Mt size and swelling is associated with oxidative injury and more acute diabetic neuropathy in rats (Russell et al., 1999; Sasaki et al., 1997). Impaired Mt biogenesis would reduce repair of damaged Mt, such as might occur in diabetes, and which may be critical for protection of cells from injury (Akude et al., 2009; Russell et al., 1999; Sasaki et al., 1997; Vincent et al., 2004). Proteins that regulate Mt biogenesis are decreased in STZ diabetic and PGC-1α (−/−) DRG neurons. Notably, there was a decrease in the level of the protein that regulates Mt biogenesis, PGC-1α, and other associated proteins including TFAM and NRF. Interestingly, we show in neurons that the two most common isoforms of PGC-1α in neurons are approximately 35 kDa and the 91 kDa (a larger nuclear protein) that we have previously described in neurons (Cowell et al., 2007; Cowell et al., 2009). Primarily, we show that the ~35 PGC-1α isoform is reduced in DRG from diabetic WT mice. A similar ~35 isoform has been shown to be present in brain (Choi et al., 2013) and recent research shows that there are several PGC-1α transcripts in neurons (Soyal et al., 2012). Many of these smaller transcripts appear to be brain or neuron specific. These smaller transcripts are at least equally or perhaps more abundant than previously described sequences (91 kDa) (Choi et al., 2013; Soyal et al., 2012). The smaller 35 kDa isoform is down-regulated by transiently transfecting cells with siRNA against PGC-1α and is recognized by antibody directed at the amino terminus, but not the carboxyl terminus (Choi et al., 2013) and one conclusion is that the smaller PGC-1α mRNA is the result of a differential splicing event (Baar et al., 2002).
Expression of another critical Mt gene, TFAM, is reduced in DRG from PGC-1α (−/−) mice and diabetic PGC-1α (+/+) mice. There is a further small decrease in TFAM in diabetic PGC-1α (−/−) mice, consistent with previous observations that TFAM expression is regulated by the PGC-1 family of regulated coactivators including PGC-1α (Kelly and Scarpulla 2004; Puigserver and Spiegelman 2003; Wu et al., 1999). Using sensitive quantitative real time PCR, there is a significant decrease in NRF-1 gene expression in diabetic PGC-1α (−/−) neurons compared to diabetic PGC-1α (+/+) neurons. In contrast, TFAM gene expression is increased. This would be consistent with a cellular response to significant loss of Mt DNA since TFAM is the main regulator of Mt DNA and is expected to be significantly upregulated by nuclear transcription as Mt TFAM protein is lost from damaged Mt. Importantly, upregulation of either TFAM or NRF1 can prevent loss of Mt DNA even when transcription of Mt RNA is decreased (Mallon et al., 2005). Upregulation of these genes would be critical in preventing continued Mt dysfunction in diabetic neuropathy.
PGC-1α and sirtuin 1 (SIRT1), which directly activates PGC-1α by deacetylation, are primarily Mt proteins (Aquilano et al., 2013; Choi et al., 2013). However, in addition to its Mt regulatory role, PGC-1α regulates several functions, including adaptive thermogenesis, glucose metabolism, and fatty acid oxidation. PGC-1α interacts with several factors including TFAM, NRF-1, NRF-2, ERRα, MEF2C, FOXO1 and YY1 (Aquilano et al., 2013). Many of these proteins are nuclear encoded and are also present in the cytoplasm. In the current manuscript, changes in TFAM and NRF-1 with STZ diabetes, or in PGC-1α (−/−) mice, reflect overall protein or gene expression in the DRG. Furthermore, PGC-1α increases the expression of several antioxidant enzymes, for example SOD1, SOD2, and GPX. Thus, while the response to oxidative stress is primarily a Mt event, there is also an important cytoplasmic component. This cytoplasmic response to oxidative stress further enhances the “clean energy program” role of PGC-1α (Finkel 2006), in which PGC-1α stimulates Mt respiration and biogenesis, while also increasing the expression of antioxidant enzymes. Overall, improved regulation of cellular metabolism and response to oxidative stress, irrespective of the cellular localization, would be important in preventing neuropathy.
Several biochemical pathways responsible for the development of the hyperglycemia-induced diabetic complications have been identified (Brownlee 2001; Toth et al., 2007; Vinik 2005). All these pathways seem to be activated by increased oxidative stress due to Mt dysfunction and thus contribute to peripheral nervous system injury, indicating an important role of oxidized biomolecules, especially oxidized proteins in the pathogenesis of diabetic neuropathy. Carbonylated protein is a good indicator of protein oxidation in diabetic tissues because it reflects irreversible modification of macromolecules by glucose (Brownlee 2000; Toth et al., 2007; Vincent et al., 2007a) and electron transport chain and Kreb’s cycle proteins are more susceptible to carbonylation (Nystrom 2005). Protein oxidation was significantly increased in PGC-1α (−/−) non-diabetic and PGC-1α (+/+) diabetic mice, indicating the presence of increased ROS production, diminished ROS defense, or both. In line with this notion, PGC-1α has been shown to be required for the induction of many ROS-detoxifying enzymes including SOD2 (St Pierre et al., 2006). Furthermore, PGC-1α overexpression prevented the generation of high glucose induced oxidative stress in adult DRG neurons, providing further support for the antioxidant role of PGC-1α.
Taken together, these results strongly suggest that Mt degeneration and resultant increased oxidative stress in DRG neurons are associated with developing diabetic peripheral neuropathy. Genetic ablation of PGC-1α exacerbates diabetic neuropathy and is associated with Mt degeneration and increased oxidative stress. In contrast, our results show that over expression of PGC-1α in neurons prevents high glucose-induced oxidative injury. Further systemic study of the altered Mt proteome under diabetic conditions will help to identify the roles of Mt oxidative damage in the pathogenesis of diabetic neuropathy and thus will provide new opportunities for developing therapeutic strategies for treating these diseases.
Highlights.
Mitochondrial regulators, PGC-1α, TFAM, and NRF1 are reduced in diabetic neurons.
PGC-1α (−/−) mice develop neuropathy and severe mitochondrial degeneration in neurons.
In diabetic PGC-1α (−/−) mice, neuropathy and protein oxidation are enhanced.
PGC-1α overexpression prevents oxidative stress associated with increased glucose.
PGC-1α is a new potential therapeutic target for treatment of diabetic neuropathy.
Acknowledgments
This work was supported in part by the Office of Research Development, Department of Veterans Affairs (Biomemedical and Laboratory Research Service and Rehabilitation Research and Development, 101RX001030), NIH RR024888, the Juvenile Diabetes Research Foundation (JDRF), American Diabetes Association (ADA), Veterans Administration Research and Development REAP award (JC, KC, JWR), VA Baltimore Research and Education Foundation (JC); and by the Mid-Atlantic Nutrition Obesity Research Center, grant P30 DK072488 from the National Institute of Diabetes and Digestive and Kidney Diseases, National Institutes of Health. We thank Dr. Daniel Kelly and Ms. Theresa Leone for providing the PGC-1α antibody, PGC-1α knockout mice, PGC-1α adenovirus and for technical assistance.
Nonstandard abbreviations used
- CMAP
compound muscle action potentials
- CNS
central nervous system
- DAB
3,3′-diaminobenzidine
- DHE
dihydroethidium
- DNPH
2,4-dinitrophenylhydrazine
- DRG
dorsal root ganglion
- Drp1
dynamin related protein
- FUDR
5-flouro-2′-deocyuridine
- H2DCF
2′,7′-dichlorodihydrofluorescein diacetate
- IENFD
intraepidermal nerve fiber density
- Mt
mitochondrion/mitochondria/mitochondrial
- NRF1
nuclear respiratory factor 1
- PGC-1α
Peroxisome proliferator-activated receptor-gamma co-activator 1α
- PNS
peripheral nervous system
- PSN
Penicillin-Streptomycin-Neomycin Mixture
- STZ
streptozotocin
- TEM
transmission electron microscopy
- TFAM
mitochondrial transcription factor A
Footnotes
Conflict of Interest Statement: The authors have no conflict of interest to report
Publisher's Disclaimer: This is a PDF file of an unedited manuscript that has been accepted for publication. As a service to our customers we are providing this early version of the manuscript. The manuscript will undergo copyediting, typesetting, and review of the resulting proof before it is published in its final citable form. Please note that during the production process errors may be discovered which could affect the content, and all legal disclaimers that apply to the journal pertain.
References
- 1.Akude E, Zherebitskaya E, Roy Chowdhury SK, Girling K, Fernyhough P. 4-Hydroxy-2-Nonenal Induces Mitochondrial Dysfunction and Aberrant Axonal Outgrowth in Adult Sensory Neurons that Mimics Features of Diabetic Neuropathy. Neurotox Res. 2009;17:28–38. doi: 10.1007/s12640-009-9074-5. [DOI] [PMC free article] [PubMed] [Google Scholar]
- 2.Andreasson H, Gyllensten U, Allen M. Real-time DNA quantification of nuclear and mitochondrial DNA in forensic analysis. Biotechniques. 2002;33:402–11. doi: 10.2144/02332rr07. [DOI] [PubMed] [Google Scholar]
- 3.Andrulionyte L, Kuulasmaa T, Chiasson JL, Laakso M. Single nucleotide polymorphisms of the peroxisome proliferator-activated receptor-alpha gene (PPARA) influence the conversion from impaired glucose tolerance to type 2 diabetes: the STOP-NIDDM trial. Diabetes. 2007;56:1181–6. doi: 10.2337/db06-1110. [DOI] [PubMed] [Google Scholar]
- 4.Anjaneyulu M, Berent-Spillson A, Inoue T, Choi J, Cherian K, Russell JW. Transforming growth factor-beta induces cellular injury in experimental diabetic neuropathy. Exp Neurol. 2008;211:469–79. doi: 10.1016/j.expneurol.2008.02.011. [DOI] [PMC free article] [PubMed] [Google Scholar]
- 5.Aquilano K, Baldelli S, Pagliei B, Ciriolo MR. Extranuclear localization of SIRT1 and PGC-1alpha: an insight into possible roles in diseases associated with mitochondrial dysfunction. Curr Mol Med. 2013;13:140–54. [PubMed] [Google Scholar]
- 6.Baar K, Wende AR, Jones TE, Marison M, Nolte LA, Chen M, et al. Adaptations of skeletal muscle to exercise: rapid increase in the transcriptional coactivator PGC-1. FASEB J. 2002;16:1879–86. doi: 10.1096/fj.02-0367com. [DOI] [PubMed] [Google Scholar]
- 7.Berent-Spillson A, Russell JW. Metabotropic glutamate receptor 3 protects neurons from glucose-induced oxidative injury by increasing intracellular glutathione concentration. J Neurochem. 2007;101:342–54. doi: 10.1111/j.1471-4159.2006.04373.x. [DOI] [PubMed] [Google Scholar]
- 8.Bogacka I, Xie H, Bray GA, Smith SR. Pioglitazone induces mitochondrial biogenesis in human subcutaneous adipose tissue in vivo. Diabetes. 2005;54:1392–9. doi: 10.2337/diabetes.54.5.1392. [DOI] [PubMed] [Google Scholar]
- 9.Brand MD, Nicholls DG. Assessing mitochondrial dysfunction in cells. Biochem J. 2011;435:297–312. doi: 10.1042/BJ20110162. [DOI] [PMC free article] [PubMed] [Google Scholar]
- 10.Brownlee M. Biochemistry and molecular cell biology of diabetic complications. Nature. 2001;414:813–20. doi: 10.1038/414813a. [DOI] [PubMed] [Google Scholar]
- 11.Brownlee M. Negative consequences of glycation. Metabolism. 2000;49:9–13. doi: 10.1016/s0026-0495(00)80078-5. [DOI] [PubMed] [Google Scholar]
- 12.Callaghan BC, Cheng HT, Stables CL, Smith AL, Feldman EL. Diabetic neuropathy: clinical manifestations and current treatments. Lancet Neurol. 2012;11:521–34. doi: 10.1016/S1474-4422(12)70065-0. [DOI] [PMC free article] [PubMed] [Google Scholar]
- 13.Canto C, Auwerx J. Calorie restriction: is AMPK a key sensor and effector? Physiology (Bethesda) 2011;26:214–24. doi: 10.1152/physiol.00010.2011. [DOI] [PMC free article] [PubMed] [Google Scholar]
- 14.Choi J, Batchu VV, Schubert M, Castellani RJ, Russell JW. A novel PGC-1alpha isoform in brain localizes to mitochondria and associates with PINK1 and VDAC. Biochem Biophys Res Commun. 2013;435:671–7. doi: 10.1016/j.bbrc.2013.05.041. [DOI] [PMC free article] [PubMed] [Google Scholar]
- 15.Choi J, Malakowsky CA, Talent JM, Conrad CC, Gracy RW. Identification of oxidized plasma proteins in Alzheimer’s disease. Biochem Biophys Res Commun. 2002;293:1566–70. doi: 10.1016/S0006-291X(02)00420-5. [DOI] [PubMed] [Google Scholar]
- 16.Chowdhury SK, Smith DR, Fernyhough P. The role of aberrant mitochondrial bioenergetics in diabetic neuropathy. Neurobiol Dis. 2013:56–65. doi: 10.1016/j.nbd.2012.03.016. [DOI] [PubMed] [Google Scholar]
- 17.Christianson JA, Riekhof JT, Wright DE. Restorative effects of neurotrophin treatment on diabetes-induced cutaneous axon loss in mice. Exp Neurol. 2003;179:188–99. doi: 10.1016/s0014-4886(02)00017-1. [DOI] [PubMed] [Google Scholar]
- 18.Coppey LJ, Davidson EP, Rinehart TW, Gellett JS, Oltman CL, Lund DD, et al. ACE inhibitor or angiotensin II receptor antagonist attenuates diabetic neuropathy in streptozotocin-induced diabetic rats. Diabetes. 2006;55:341–8. doi: 10.2337/diabetes.55.02.06.db05-0885. [DOI] [PubMed] [Google Scholar]
- 19.Cowell RM, Blake KR, Russell JW. Localization of the transcriptional coactivator PGC-1alpha to GABAergic neurons during maturation of the rat brain. J Comp Neurol. 2007;502:1–18. doi: 10.1002/cne.21211. [DOI] [PubMed] [Google Scholar]
- 20.Cowell RM, Talati P, Blake KR, Meador-Woodruff JH, Russell JW. Identification of novel targets for PGC-1alpha and histone deacetylase inhibitors in neuroblastoma cells. Biochem Biophys Res Commun. 2009;379:578–82. doi: 10.1016/j.bbrc.2008.12.109. [DOI] [PMC free article] [PubMed] [Google Scholar]
- 21.Esterbauer H, Oberkofler H, Krempler F, Patsch W. Human peroxisome proliferator activated receptor gamma coactivator 1 (PPARGC1) gene: cDNA sequence, genomic organization, chromosomal localization, and tissue expression. Genomics. 1999;62:98–102. doi: 10.1006/geno.1999.5977. [DOI] [PubMed] [Google Scholar]
- 22.Finkel T. Cell biology: a clean energy programme. Nature. 2006;444:151–2. doi: 10.1038/444151a. [DOI] [PubMed] [Google Scholar]
- 23.He L, Chinnery PF, Durham SE, Blakely EL, Wardell TM, Borthwick GM, et al. Detection and quantification of mitochondrial DNA deletions in individual cells by real-time PCR. Nucleic Acids Res. 2002;30:e68. doi: 10.1093/nar/gnf067. [DOI] [PMC free article] [PubMed] [Google Scholar]
- 24.Heilbronn LK, Gregersen S, Shirkhedkar D, Hu D, Campbell LV. Impaired fat oxidation after a single high-fat meal in insulin-sensitive nondiabetic individuals with a family history of type 2 diabetes. Diabetes. 2007;56:2046–53. doi: 10.2337/db06-1687. [DOI] [PubMed] [Google Scholar]
- 25.Ho EC, Lam KS, Chen YS, Yip JC, Arvindakshan M, Yamagishi S, et al. Aldose reductase-deficient mice are protected from delayed motor nerve conduction velocity, increased c-Jun NH2-terminal kinase activation, depletion of reduced glutathione, increased superoxide accumulation, and DNA damage. Diabetes. 2006;55:1946–53. doi: 10.2337/db05-1497. [DOI] [PubMed] [Google Scholar]
- 26.Huang TJ, Price SA, Chilton L, Calcutt NA, Tomlinson DR, Verkhratsky A, et al. Insulin prevents depolarization of the mitochondrial inner membrane in sensory neurons of type 1 diabetic rats in the presence of sustained hyperglycemia. Diabetes. 2003;52:2129–36. doi: 10.2337/diabetes.52.8.2129. [DOI] [PubMed] [Google Scholar]
- 27.Johri A, Calingasan NY, Hennessey TM, Sharma A, Yang L, Wille E, et al. Pharmacologic activation of mitochondrial biogenesis exerts widespread beneficial effects in a transgenic mouse model of Huntington’s disease. Hum Mol Genet. 2012;21:1124–37. doi: 10.1093/hmg/ddr541. [DOI] [PMC free article] [PubMed] [Google Scholar]
- 28.Kelly DP, Scarpulla RC. Transcriptional regulatory circuits controlling mitochondrial biogenesis and function. Genes Dev. 2004;18:357–68. doi: 10.1101/gad.1177604. [DOI] [PubMed] [Google Scholar]
- 29.Kishi M, Tanabe J, Schmelzer JD, Low PA. Morphometry of dorsal root ganglion in chronic experimental diabetic neuropathy. Diabetes. 2002;51:819–24. doi: 10.2337/diabetes.51.3.819. [DOI] [PubMed] [Google Scholar]
- 30.Kleiner S, Mepani RJ, Laznik D, Ye L, Jurczak MJ, Jornayvaz FR, et al. Development of insulin resistance in mice lacking PGC-1alpha in adipose tissues. Proc Natl Acad Sci U S A. 2012;109:9635–40. doi: 10.1073/pnas.1207287109. [DOI] [PMC free article] [PubMed] [Google Scholar]
- 31.Lauria G, Cornblath DR, Johansson O, McArthur JC, Mellgren SI, Nolano M, et al. EFNS guidelines on the use of skin biopsy in the diagnosis of peripheral neuropathy. Eur J Neurol. 2005a;12:747–58. doi: 10.1111/j.1468-1331.2005.01260.x. [DOI] [PubMed] [Google Scholar]
- 32.Lauria G, Lombardi R, Borgna M, Penza P, Bianchi R, Savino C, et al. Intraepidermal nerve fiber density in rat foot pad: neuropathologic-neurophysiologic correlation. J Peripher Nerv Syst. 2005b;10:202–8. doi: 10.1111/j.1085-9489.2005.0010210.x. [DOI] [PubMed] [Google Scholar]
- 33.Lehman JJ, Barger PM, Kovacs A, Saffitz JE, Medeiros DM, Kelly DP. Peroxisome proliferator-activated receptor gamma coactivator-1 promotes cardiac mitochondrial biogenesis. J Clin Invest. 2000;106:847–56. doi: 10.1172/JCI10268. [DOI] [PMC free article] [PubMed] [Google Scholar]
- 34.Leone TC, Lehman JJ, Finck BN, Schaeffer PJ, Wende AR, Boudina S, et al. PGC-1α deficient mice exhibit multi-system energy metabolic derangements: muscle dysfunction, abnormal weight control, and hepatic steatosis. PLoS Biol. 2005:e101. doi: 10.1371/journal.pbio.0030101. epub. [DOI] [PMC free article] [PubMed] [Google Scholar]
- 35.Lin J, Wu H, Tarr PT, Zhang CY, Wu Z, Boss O, et al. Transcriptional co-activator PGC-1 alpha drives the formation of slow-twitch muscle fibres. Nature. 2002;418:797–801. doi: 10.1038/nature00904. [DOI] [PubMed] [Google Scholar]
- 36.Lin J, Wu PH, Tarr PT, Lindenberg KS, St Pierre J, Zhang CY, et al. Defects in adaptive energy metabolism with CNS-linked hyperactivity in PGC-1alpha null mice. [see comment] Cell. 2004;119:125–35. doi: 10.1016/j.cell.2004.09.013. [DOI] [PubMed] [Google Scholar]
- 37.Mallon PW, Unemori P, Sedwell R, Morey A, Rafferty M, Williams K, et al. In vivo, nucleoside reverse-transcriptase inhibitors alter expression of both mitochondrial and lipid metabolism genes in the absence of depletion of mitochondrial DNA. J Infect Dis. 2005;191:1686–96. doi: 10.1086/429697. [DOI] [PubMed] [Google Scholar]
- 38.Martin-Gallan P, Carrascosa A, Gussinye M, Dominguez C. Biomarkers of diabetes-associated oxidative stress and antioxidant status in young diabetic patients with or without subclinical complications. Free Radic Biol Med. 2003;34:1563–74. doi: 10.1016/s0891-5849(03)00185-0. [DOI] [PubMed] [Google Scholar]
- 39.Mootha VK, Lindgren CM, Eriksson KF, Subramanian A, Sihag S, Lehar J, et al. PGC-1alpha-responsive genes involved in oxidative phosphorylation are coordinately downregulated in human diabetes.[see comment] Nature Genetics. 2003;34(3):267–73. doi: 10.1038/ng1180. [DOI] [PubMed] [Google Scholar]
- 40.Nystrom T. Role of oxidative carbonylation in protein quality control and senescence. EMBO J. 2005;24:1311–7. doi: 10.1038/sj.emboj.7600599. [DOI] [PMC free article] [PubMed] [Google Scholar]
- 41.Obrosova IG. How does glucose generate oxidative stress in peripheral nerve? Int Rev Neurobiol. 2002;50:3–35. doi: 10.1016/s0074-7742(02)50071-4. [DOI] [PubMed] [Google Scholar]
- 42.Obrosova IG, Pacher P, Szabo C, Zsengeller Z, Hirooka H, Stevens MJ, et al. Aldose reductase inhibition counteracts oxidative-nitrosative stress and poly(ADP-ribose) polymerase activation in tissue sites for diabetes complications. Diabetes. 2005;54:234–42. doi: 10.2337/diabetes.54.1.234. [DOI] [PMC free article] [PubMed] [Google Scholar]
- 43.Patti ME, Butte AJ, Crunkhorn S, Cusi K, Berria R, Kashyap S, et al. Coordinated reduction of genes of oxidative metabolism in humans with insulin resistance and diabetes: Potential role of PGC1 and NRF1. Proc Natl Acad Sci U S A. 2003;100:8466–71. doi: 10.1073/pnas.1032913100. [DOI] [PMC free article] [PubMed] [Google Scholar]
- 44.Puigserver P, Spiegelman BM. Peroxisome proliferator-activated receptor-gamma coactivator 1 alpha (PGC-1 alpha): transcriptional coactivator and metabolic regulator. Endocr Rev. 2003;24:78–90. doi: 10.1210/er.2002-0012. [DOI] [PubMed] [Google Scholar]
- 45.Puigserver P, Wu Z, Park CW, Graves R, Wright M, Spiegelman BM. A cold-inducible coactivator of nuclear receptors linked to adaptive thermogenesis. Cell. 1998;92:829–39. doi: 10.1016/s0092-8674(00)81410-5. [DOI] [PubMed] [Google Scholar]
- 46.Roy Chowdhury SK, Smith DR, Saleh A, Schapansky J, Marquez A, Gomes S, et al. Impaired adenosine monophosphate-activated protein kinase signalling in dorsal root ganglia neurons is linked to mitochondrial dysfunction and peripheral neuropathy in diabetes. Brain. 2012;135:1751–66. doi: 10.1093/brain/aws097. [DOI] [PMC free article] [PubMed] [Google Scholar]
- 47.Russell JW, Berent-Spillson A, Vincent AM, Freimann CL, Sullivan KA, Feldman EL. Oxidative injury and neuropathy in diabetes and impaired glucose tolerance. Neurobiol Dis. 2008;30:420–9. doi: 10.1016/j.nbd.2008.02.013. [DOI] [PMC free article] [PubMed] [Google Scholar]
- 48.Russell JW, Golovoy D, Vincent AM, Mahendru P, Olzmann JA, Mentzer A, et al. High glucose-induced oxidative stress and mitochondrial dysfunction in neurons. FASEB. 2002;16:1738–48. doi: 10.1096/fj.01-1027com. [DOI] [PubMed] [Google Scholar]
- 49.Russell JW, Sullivan KA, Windebank AJ, Herrmann DN, Feldman EL. Neurons undergo apoptosis in animal and cell culture models of diabetes. Neurobiol Dis. 1999;6:347–63. doi: 10.1006/nbdi.1999.0254. [DOI] [PubMed] [Google Scholar]
- 50.Sasaki H, Schmelzer JD, Zollman PJ, Low PA. Neuropathology and blood flow of nerve, spinal roots and dorsal root ganglia in longstanding diabetic rats. Acta Neuropathol. 1997;93:118–28. doi: 10.1007/s004010050592. [DOI] [PubMed] [Google Scholar]
- 51.Schuh RA, Kristian T, Gupta RK, Flaws JA, Fiskum G. Methoxychlor inhibits brain mitochondrial respiration and increases hydrogen peroxide production and CREB phosphorylation. Toxicol Sci. 2005;88:495–504. doi: 10.1093/toxsci/kfi334. [DOI] [PubMed] [Google Scholar]
- 52.Smith AG, Russell JW, Feldman EL, Goldstein J, Peltier A, Smith S, et al. Lifestyle intervention for prediabetic neuropathy. Diabetes Care. 2006;29:1294–9. doi: 10.2337/dc06-0224. [DOI] [PubMed] [Google Scholar]
- 53.Song Z, Fu DT, Chan YS, Leung S, Chung SS, Chung SK. Transgenic mice overexpressing aldose reductase in Schwann cells show more severe nerve conduction velocity deficit and oxidative stress under hyperglycemic stress. Mol Cell Neurosci. 2003;23:638–47. doi: 10.1016/s1044-7431(03)00096-4. [DOI] [PubMed] [Google Scholar]
- 54.Soyal SM, Felder TK, Auer S, Hahne P, Oberkofler H, Witting A, et al. A greatly extended PPARGC1A genomic locus encodes several new brain-specific isoforms and influences Huntington disease age of onset. Hum Mol Genet. 2012;21:3461–73. doi: 10.1093/hmg/dds177. [DOI] [PubMed] [Google Scholar]
- 55.St Pierre J, Drori S, Uldry M, Silvaggi JM, Rhee J, Jager S, et al. Suppression of reactive oxygen species and neurodegeneration by the PGC-1 transcriptional coactivators. Cell. 2006;20;127:397–408. doi: 10.1016/j.cell.2006.09.024. [DOI] [PubMed] [Google Scholar]
- 56.Toth C, Rong LL, Yang C, Martinez J, Song F, Ramji N, et al. Receptor for advanced glycation end products (RAGEs) and experimental diabetic neuropathy. Diabetes. 2007;57:1002–17. doi: 10.2337/db07-0339. [DOI] [PubMed] [Google Scholar]
- 57.Turk Z. Glycotoxines, carbonyl stress and relevance to diabetes and its complications. Physiol Res. 2009;59:147–56. doi: 10.33549/physiolres.931585. [DOI] [PubMed] [Google Scholar]
- 58.Vincent AM, Hayes JM, McLean LL, Vivekanandan-Giri A, Pennathur S, Feldman EL. Dyslipidemia-Induced Neuropathy in Mice: the Role of oxLDL/LOX-1. Diabetes. 2009;58:2376–85. doi: 10.2337/db09-0047. [DOI] [PMC free article] [PubMed] [Google Scholar]
- 59.Vincent AM, Olzmann JA, Brownlee M, Sivitz WI, Russell JW. Uncoupling proteins prevent glucose-induced neuronal oxidative stress and programmed cell death. Diabetes. 2004;53:726–34. doi: 10.2337/diabetes.53.3.726. [DOI] [PubMed] [Google Scholar]
- 60.Vincent AM, Perrone L, Sullivan KA, Backus C, Sastry AM, Lastoskie C, et al. RAGE Activation Injures Primary Sensory Neurons via Oxidative Stress. Endocrinology. 2006;148:548–58. doi: 10.1210/en.2006-0073. [DOI] [PubMed] [Google Scholar]
- 61.Vincent AM, Perrone L, Sullivan KA, Backus C, Sastry AM, Lastoskie C, et al. Receptor for advanced glycation end products activation injures primary sensory neurons via oxidative stress. Endocrinology. 2007a;148:548–58. doi: 10.1210/en.2006-0073. [DOI] [PubMed] [Google Scholar]
- 62.Vincent AM, Russell JW, Sullivan KA, Backus C, Hayes JM, McLean LL, et al. SOD2 protects neurons from injury in cell culture and animal models of diabetic neuropathy. Exp Neurol. 2007b;208:216–27. doi: 10.1016/j.expneurol.2007.07.017. [DOI] [PMC free article] [PubMed] [Google Scholar]
- 63.Vinik A. The protein kinase C-beta inhibitor, ruboxistaurin, for the treatment of diabetic microvascular complications. Expert Opin Investig Drugs. 2005;14:1547–59. doi: 10.1517/13543784.14.12.1547. [DOI] [PubMed] [Google Scholar]
- 64.Wiggin TD, Sullivan KA, Pop-Busui R, Amato A, Sima AA, Feldman EL. Elevated triglycerides correlate with progression of diabetic neuropathy. Diabetes. 2009;58:1634–40. doi: 10.2337/db08-1771. [DOI] [PMC free article] [PubMed] [Google Scholar]
- 65.Wu Z, Puigserver P, Andersson U, Zhang C, Adelmant G, Mootha V, et al. Mechanisms controlling mitochondrial biogenesis and respiration through the thermogenic coactivator PGC-1. Cell. 1999;98:115–24. doi: 10.1016/S0092-8674(00)80611-X. [DOI] [PubMed] [Google Scholar]
- 66.Yagihashi S, Yamagishi SI, Wada RR, Baba M, Hohman TC, Yabe-Nishimura C, et al. Neuropathy in diabetic mice overexpressing human aldose reductase and effects of aldose reductase inhibitor. Brain. 2001;124:2448–58. doi: 10.1093/brain/124.12.2448. [DOI] [PubMed] [Google Scholar]
- 67.Yu X, Zhang L, Yang X, Huang H, Huang Z, Shi L, et al. Salvianolic acid A protects the peripheral nerve function in diabetic rats through regulation of the AMPK-PGC1alpha-Sirt3 axis. Molecules. 2012;17:11216–28. doi: 10.3390/molecules170911216. [DOI] [PMC free article] [PubMed] [Google Scholar]