Short abstract
The purpose of this study is to investigate the effects of preconditioning on the deformation response of planar tissues measured by inflation tests. The inflation response of test specimens, including the bovine cornea, bovine and porcine sclera, and human skin, exhibited a negligible evolving deformation response when subjected to repeated pressure loading with recovery periods between cycles. Tissues obtained complete recovery to the reference state, and strain contours across the entire specimen were nearly identical at the maximum pressure of each load cycle. This repeatability was obtained regardless of strain history. These results suggest that negligible permanent change was induced in the microstructure by inflation testing. Additionally, we present data illustrating that a lack of a recovery period can result in an evolving deformation response to repeated loading that is commonly attributed to preconditioning. These results suggest that the commonly observed effects of preconditioning may be avoided by experimental design for planar tissues characterized by long collagen fibers arranged in the plane of the tissue. Specifically, if the test is designed to fully fix the specimen boundary during loading, adequate recovery periods are allowed after each load cycle, and loads are limited to avoid damage, preconditioning effects may be avoided for planar tissues.
1. Introduction
Preconditioning, or the use of repeated load cycles to obtain a repeatable mechanical response, is a common procedure in the testing of soft biological tissues. Preconditioning effects refer to an evolving mechanical response to repeated loading and were first described for uniaxial tensile testing of skin [1]. Characteristic changes with repeated loading include rightward shifting of the load-elongation curve, accompanied by permanent elongation, reduced hysteresis, and a decrease in the peak stress for the same applied stretch [2]. These effects occur even when the tissue is allowed to viscoelastically recover between load cycles. The changes lessen with successive load cycles, eventually achieving a repeatable state, typically after 3–10 cycles [3–5].
It is commonly accepted that tissues must be preconditioned to obtain repeatable measurements. However, preconditioning may induce nonphysiological changes to the tissue. This can be avoided by only using data from the first loading curve [6], but often studies require comparison of subsequent tests (e.g., comparing the effects of loading rates). Preconditioning is most commonly applied for uniaxial [7] and biaxial [8] tension but has also been applied for indentation [9,10], aspiration [11], confined compression, and shear tests [12]. The effects of preconditioning for uniaxial tensile tests [13] are more severe than for biaxial tension tests [14], with more dramatic shifting of the load-elongation curve and often more loading cycles required to reach a repeatable reference state. Although the need for preconditioning is well accepted, the preconditioning protocols for particular tests are not standardized. Moreover, important details of the protocol are often not reported. For example, the rest periods between each preconditioning cycle needed for viscoelastic recovery are usually neither included nor specified [5,7,14,15]. The number of loading cycles is also often not reported and can vary significantly from study to study (e.g., three to nine preconditioning cycles for uniaxial tension testing of skin [3,4], five cycles for bovine cornea [16], ten cycles for rabbit [17] and porcine [18] sclera, and as many as 160 cycles for tendons and ligaments [19]).
A number of studies have proposed guidelines for preconditioning. In general, the preconditioning loading protocol should be as similar as possible to the loading protocol applied in the test. This was first proposed for biaxial testing of skin by Lanir and Fung [15], where it was observed that specimens to be tested biaxially must also be preconditioned biaxially to obtain repeatable results. Similarly, Carew et al. [20] reported that tissues to be tested by stress relaxation must be preconditioned with repeated stress relaxation tests. It has also been reported that a specimen must be preconditioned to the same strain level as in the test, and if a specimen is preconditioned to a certain strain level and a new strain level is to be tested, a new round of preconditioning is required [2,7,21]. Strain history can also impact preconditioning protocols. Carew et al. [22] applied quasilinear viscoelastic theory to model the preconditioning response and concluded that the preconditioned state was a function of the strain history seen by the tissue. Significant rest periods, on the order of 24 h, were necessary prior to testing in order to erase the strain history.
Precise knowledge of the preconditioning protocol is important because repeated loading can have a significant effect on the stress response, often leading to a rightward shift of the stress-strain curve and a stiffer response in the linear region [2,16]. Preconditioning causes a lengthening of the reference length of the material [23]. However, the stress-strain responses are often plotted with respect to the initial length at the beginning of the first cycle. This is why preconditioning is often described as a softening effect [2]. If the displacements for each load cycle were tared such that the reference length was the length at the beginning of each cycle, the load-unload curves would show a stiffening effect for many cases. This has been observed for bovine cornea [16].
Despite widespread use, the mechanisms responsible for preconditioning effects are still poorly understood. Some of the reported preconditioning effects may be due to viscoelastic effects, as many preconditioning protocols do not provide a recovery time between loading cycles [5,7,14,15]. This can lead to a conflation of recoverable viscoelastic behavior with nonrecoverable microstructural changes induced by loading. However, even among studies where recovery time was allowed [2,16,22], mechanical changes and lengthening of the tissue have still been observed. Indeed, viscoelastic theory alone cannot explain the preconditioning response. Graf et al. [24] modeled the viscoelastic relaxation effects of preconditioned tissue and found that preconditioning effects were lessened when recovery time was allowed between cycles, but the effect still remained even after 30 min. The fact that a portion of the mechanical shift is not recoverable after many hours suggests that some kind of permanent structural change is induced in the tissue by repeated loading [2]. Such structural changes could arise from a permanent rearrangement of fibers with loading. Imaging studies with polarized light microscopy have shown that the collagen fibers align with the loading direction during preconditioning and that this change in alignment is maintained after the load is removed [25–27]. Such reorganization could account for the nonviscoelastic changes seen with preconditioning as well as the stiffening reported in bovine cornea [16] for the linear part of the curve. Finally, damage may occur at the fibrillar level for high applied loads. Preconditioning effects caused by damage have been described as a Mullins effect, where the breaking of collagen cross-links may account for the observed softening with repeated loading [28,29]. This could also account for nonrecoverable lengthening of the tissue.
The objective of this work is to investigate the preconditioning effects for inflation testing of planar tissues. The term planar tissues here refers to soft tissues in which the extracellular matrix is characterized by a network of long collagen fibers oriented primarily parallel to the tissue surface. We have designed our test to eliminate the three possible mechanisms of preconditioning: we allow a rest period at nominally zero load between cycles to fully recover viscoelastic deformation; we completely fix the specimen boundaries to avoid rearrangement of the long collagen fibers during loading; and we limit the applied loading to physiological limits to avoid tissue damage. It has been previously reported by our lab that pressure-displacement results for bovine sclera [30], human sclera [31], and human skin [32] do not suffer significant preconditioning effects to repeated loading. Here, we present pressure-strain data from human skin tissue, porcine sclera, bovine cornea, and bovine sclera showing minimal preconditioning effects when subjected to inflation testing. This is in contrast to studies on the same tissues using uniaxial and biaxial loading configurations [3,15–17]. We achieved complete recovery of the local pressure-strain response between cycles when comparing both the pressure-strain response for a specific point and the strain contours over larger regions at the maximum pressure of each cycle. This indicated that there was no permanent deformation of the material induced by repeated pressurization. We also illustrate how neglecting to include recovery periods between each loading cycle can lead to the rightward shift in the strain response commonly attributed to preconditioning. Finally, we show that the deformation response was repeatable, even when the specimen was subjected to extended creep and to pressure load-unload cycles at different rates.
2. Methods
This section briefly describes the inflation test methods applied to human skin, bovine cornea, porcine sclera, and bovine sclera. These inflation methods have been described in detail in previous publications for bovine sclera [30], human sclera [31,33], human skin [32], and bovine cornea [34]. In general, all specimens were cleaned of extraneous tissues and attached to custom plastic holders using cyanoacrylate glue. The specimen and fixture were mounted onto an inflation chamber enclosed by a humidity chamber and subjected to repeated pressurization cycles with rest periods between each load cycle. Samples were imaged with two stereoscopically arranged cameras, and displacements were measured using digital image correlation (DIC). Strains were calculated directly from the DIC displacements along two in-plane material directions. These strains were plotted against pressure for the entire test to evaluate the effects of preconditioning. Strain contours are also presented over a larger area of the tissue to evaluate local effects of preconditioning.
2.1. Specimen Preparation.
Skin specimens 10 × 10 cm in dimension were obtained from the back torso of male human donors ages 43–83 through the National Disease Research Interchange (Philadelphia, PA). Specimens were flash-frozen after procurement and shipped on dry ice. Prior to testing, the specimens were thawed in phosphate-buffered saline (PBS) and adipose tissue was removed using fine dissectors.
Bovine eyes from animals 30 months or younger and porcine eyes from 6–9-month-old animals were procured from Animal Technologies, Inc. (Tyler, TX). Specimens were received the day after slaughter and stored at 4 °C until tested. Internal structures and external fat and muscle were removed from the globe to obtain a clean scleral surface. The more delicate bovine corneas were tested within 24 h of delivery, while both bovine and porcine sclera were tested within 72 h of animal death.
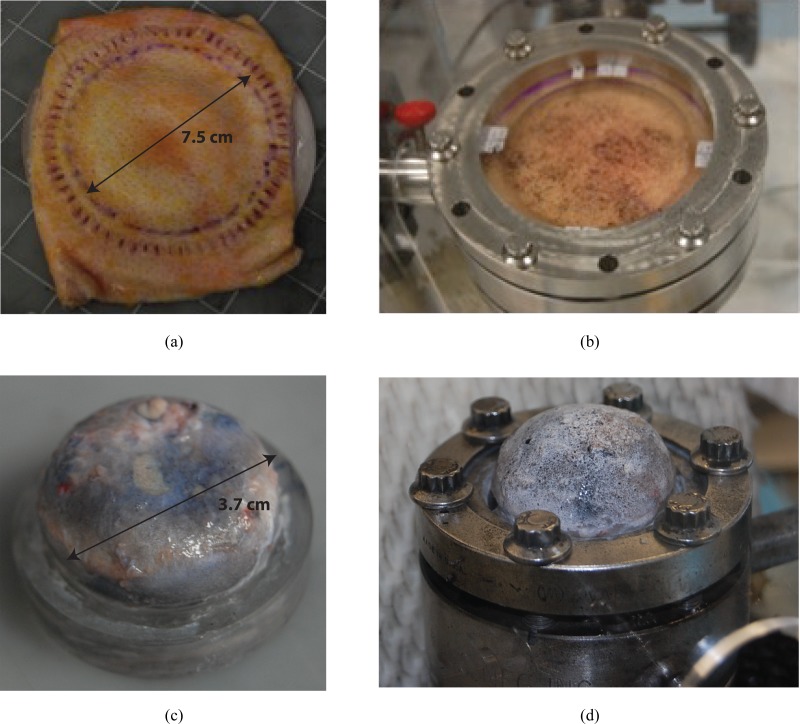
Tissue samples were glued to custom acrylic fixtures (Fig. 1). Skin tissue was glued to a fixture with a 7.5-cm circular aperture. Ocular tissue specimens were glued to a smaller fixture at the limbus (bovine cornea and sclera) or 3.0-mm posterior to the equator (porcine sclera). To secure the attachment of the specimens to the fixture, the entire perimeter was scored through the thickness with a scalpel and the scores were impregnated with cyanoacrylate glue. This provided a fully fixed boundary condition through the thickness of the tissue and prevented leakage during inflation testing and excessive shearing at the edge of the deforming specimen.
Fig. 1.
Tissue, fixture, and inflation chamber. (a) Skin specimen glued to the back of the fixture, scored through the thickness at the gluing site, and the scored cuts further filled with glue to create a rigid boundary; (b) skin specimen on inflation chamber; (c) bovine sclera similarly glued to fixture; and (d) bovine sclera on inflation chamber.
2.2. Loading Protocols.
All samples were speckled for digital image correlation with either graphite (skin tissues) or black India ink (ocular tissues). Specimens were inflated by pressure-controlled injection of PBS controlled by an MTS-driven syringe pump (MTS, Eden Prairie, MN). All tests were performed at room temperature, and all specimens except for the bovine cornea were tested inside a humidity chamber to prevent dehydration. The short duration of the test and the fact that the cornea was hydrated from the bottom by the inflation fluid prevented significant dehydration, confirmed by the repeatability observed between cycles in Sec. 3.2.
Pressure in the inflation chamber was monitored using a TJE pressure transducer (Honeywell, Morristown, NJ) with 2 psig range and ±0.002 psig accuracy. The deforming tissue was imaged at a rate of 0.5 Hz by two cameras arranged in stereo with 1/1.8” image sensors (Point Gray, Richmond, BC, Canada) controlled by VicSnap 2010 (Correlated Solutions Inc., Columbia, SC). Displacements were determined by DIC using Vic3D 2010 (Correlated Solutions Inc., Columbia, SC).
Prior to starting the pressure-loading protocol, specimens were allowed to relax at a baseline pressure for 15 min to ensure an equilibrium reference state. The specimens were then subjected to three load-unload cycles from the baseline pressure to the maximum pressure with 15-min rest periods at the baseline pressure between each cycle. Slightly different pressures and loading rates were chosen for each tissue type and species, enumerated in Table 1. The baseline pressure (0.21–0.28 kPa) was chosen to prevent tissue buckling in the reference state. The maximum inflation pressure for skin (5.52 kPa) was large enough to probe the full toe-linear stress response of the tissue, while the maximum inflation pressure for the ocular tissues (4.0–6.0 kPa) corresponded to pathologically relevant elevated intraocular pressures. The slow loading rates (0.06–0.13 kPa/s) were chosen to measure the quasistatic response of the tissue. Skin specimens were also tested at a tenfold higher loading rate (0.70 kPa/s) to examine if changing the loading rate for the same specimens would affect the preconditioning response. Finally, the recovery time was selected based on preliminary experiments, indicating that complete strain recovery of the tissue was obtained within 15 min for the slow loading rates (0.06–0.13 kPa/s) and within 5 min for the faster loading rate applied to skin (0.70 kPa/s).
Table 1.
Minimum and maximum pressures, loading rates, and rest times for each type of tissue tested
| Human skin | Human skin | ||||
|---|---|---|---|---|---|
| (slow) | (fast) | Bovine cornea | Porcine sclera | Bovine sclera | |
| Baseline pressure (kPa) | 0.28 | 0.28 | 0.21 | 0.28 | 0.21 |
| Maximum pressure (kPa) | 5.52 | 5.52 | 6.21 | 6.00 | 4.00 |
| Loading rate (kPa/s) | 0.07 | 0.70 | 0.06 | 0.13 | 0.13 |
| Rest period (min) | 15.0 | 5.0 | 15.0 | 15.0 | 15.0 |
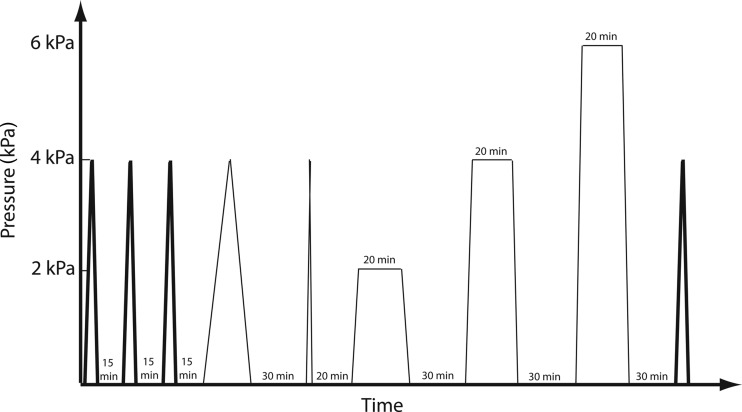
In a separate set of experiments, the skin specimens were also subjected to five preconditioning cycles without recovery periods to demonstrate the effects of viscoelasticity on the deformation response. We also present test results for the bovine sclera [30], where the tissue was subjected to 4 h of additional testing after the initial preconditioning cycles (Fig. 2). Specifically, after preconditioning, the tissue was subjected to two additional load-unload cycles at 0.7 kPa/s and 0.007 kPa/s with 20 - and 30-min recovery periods, respectively, and three 20-min creep tests at 2.0 kPa, 4.0 kPa, and 6.0 kPa, each followed by 30-min recovery periods. Finally, the tissue was subjected to a single load-unload test identical to the first preconditioning cycle to compare to the three initial cycles.
Fig. 2.
Schematic of additional loading regime for bovine sclera. After the three preconditioning cycles prescribed in Table 1, two additional load cycles and three creep tests were performed prior to a final load-unload cycle identical to the first.
2.3. Strain Calculations.
The effects of preconditioning are typically reported for the stress-strain response, but the stress calculation for the inflation specimens is nontrivial, particularly for the thick skin specimens, where bending cannot be neglected [35]. Similarly, the presence of the compliant optic nerve head creates a stress concentration in the sclera. Instead, the pressure-strain response was plotted for all specimens tested. Strains were calculated directly from the displacement components of a smoothed DIC displacement field along two material directions. Additionally, strain contours over a larger portion of the surface of the tissue were computed to compare preconditioning effects at different locations.
2.3.1. Skin Tissue Strain Calculations.
The method of strain calculation for skin specimens has been previously reported [32]. Briefly, specimens were positioned so that the X-coordinate was aligned with the horizontal axis of the body, the Y-coordinate was aligned with the vertical axis, and the Z-coordinate was the out-of-plane direction. The components of the displacement field U, V, and W along the X-, Y-, and Z- directions were extracted at 0.570-mm intervals and then interpolated over a grid of 0.25-mm spacing.
The inflation of a planar anisotropic tissue, such as skin, results in an ellipsoidal bulge. The stiffest in-plane direction of the tissue (the fiber direction) and the least stiff in-plane direction (the perpendicular direction) were identified from the ellipsoidal shape of the inflated tissue. The displacement field was rotated to obtain the displacement components U′ along the fiber direction X′ and V′ along the perpendicular direction Y′. The out-of-plane displacement component W was unchanged. Lagrange strains along both the fiber direction and the in-plane perpendicular direction were computed by Eq. (1),
| (1) |
The displacement gradients were calculated by fitting the displacements along the X′ or Y′ axis to a ninth order polynomial and differentiating analytically.
Strains in both directions were plotted against pressure at a single point at the apex of the inflated tissue (Fig. 3). Strain contours in both the fiber and perpendicular directions were also computed over the entire specimen.
Fig. 3.
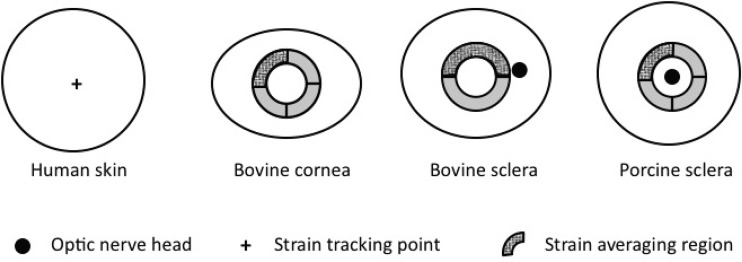
Schematic of top view of specimens, showing points or regions where strains were reported. Strains were reported for a single point at the apex for human skin tissue. Average strains over a region were reported for ocular tissue to minimize the effects of noise. Strain contours are also reported over the entire surface for skin tissues and all quadrants for ocular tissues.
2.3.2. Ocular Tissue Strain Calculations.
The strain calculation methods for the bovine corneal and scleral tissues have been previously described [31,33]. Similar methods were used for the porcine sclera. Briefly, the DIC-measured displacements were interpolated onto a reference grid based on the initial geometry of the tissue. For the bovine cornea and sclera, we constructed a 2D polar reference grid centered on the specimen apex and interpolated the vertical positions and the three components of the displacement to points on the grid. The vertical positions were used to transform the polar grid into a 3D grid. For the porcine posterior sclera, which is quite smooth and almost spherical in young pig eyes, we defined a 3D spherical grid based on a spherical fit of the reference configuration. The DIC-measured displacements were interpolated to the points of the spherical grid.
For all ocular tissues, stretches in the circumferential, λθ, and meridional directions, λφ, were calculated as
| (2) |
where l θ and L θ are the deformed and undeformed lengths calculated between two adjacent grid points in the circumferential direction and l φ and L φ are the deformed and undeformed lengths calculated between two adjacent grid points in the meridional direction. The Lagrangian strains in each direction, E θθ and E φφ, were calculated from the stretches as follows:
| (3) |
For the sclera, surface features, such as blood vessels, can lead to significant variability in local strain measurements. To mitigate the effect of local strain variability, ocular strains were averaged over small regions (Fig. 3). The exact area of the averaging region varied slightly, due to the different shapes and sizes of the tissue types and species and to avoid anatomical structures, such as the optic nerve head (ONH). For the bovine cornea and sclera, averaging was performed over quadrants and half-circles, respectively. A larger averaging region was used for the bovine sclera as features inherent to the tissue, in particular its blue coloration and apparent vessels, contributed to a locally elevated level of noise. The bovine cornea quadrant was 4 mm wide and located 4 mm from the apex, while the bovine sclera half-circle was 5 mm wide and located 1 mm from the apex (Fig. 3). For the porcine sclera, strains were averaged over a quadrant 2.34 mm wide and located 2 mm away from the ONH. These average strains were plotted against pressure to assess the effects of the preconditioning cycles on the mechanical response. Strain contours were also plotted for the entire circular region at the maximum pressure of the first and final load cycle for skin tissues to assess local changes between cycles over a larger area. Strain contours were plotted for an annular region for scleral tissues to avoid the ONH and for corneal tissues because the radial grid used to calculate strains leads to an infinitely dense grid at the center of the specimen.
2.3.3. Strain Error and Validation.
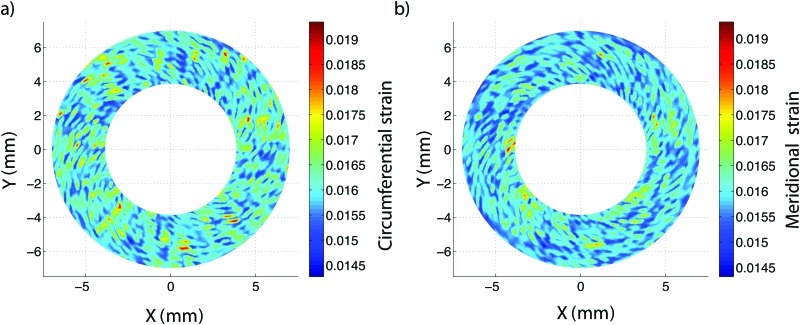
Strain calculations were subject to variability arising from DIC displacement measurement errors as well as numerical errors evaluating the derivatives of the displacement fields. To evaluate the effects of these errors on the calculated strains, we performed a numerical experiment starting with a sphere of known radius. Based on a previous study, an applied displacement of 200 μm can result in a DIC measurement of 195 ± 12 μm [31]. We applied a Gaussian distribution corresponding to this DIC measurement randomly over the surface of a 12.5-mm-radius sphere to simulate a typical ocular tissue inflation test. The exact same strain analysis and grid size were used as in the experiments for porcine sclera. The average and standard deviation of the strain field over the surface of the sphere was 1.61 ± 0.071% in the meridional direction and 1.59 ± 0.056% in the circumferential direction, nearly equivalent to the 1.61% uniform theoretical strain. These values were computed for an idealized case and likely represent a lower bound on the true resolution of the system. More work is needed to measure and validate the 3D-DIC strain resolution for soft tissues. Contour plots of the meridional and circumferential strains over the area defined for the porcine sclera in Sec. 2.3.2 can be found in Fig. 10 in the Appendix.
Fig. 10.
Propagation of DIC uncertainty into strain calculation uncertainty for an idealized numerical sphere: (a) meridional and (b) circumferential strains over a 12.5-mm sphere subjected to a 200 -μm radial inflation with DIC uncertainty (described as a Gaussian distribution of displacements, 195 ± 12 μm, based on previous work [31]). The resulting strain variation of 1.61 ± 0.071 % for the meridional direction and 1.59 ± 0.056 % for the circumferential direction is nearly equivalent to the 1.61 % theoretical uniform strain.
3. Results
The results for three representative skin specimens and three representative ocular tissues (one bovine cornea, one porcine sclera, and one bovine sclera) are presented in this work. We present pressure-strain data at a single point (skin) or averaged over a small region (ocular tissues) for two in-plane material directions (fiber and perpendicular for skin and meridional and circumferential for ocular tissues). We also present strain contours over a larger region of the tissue for comparison between the first and last preconditioning cycle. For ocular tissue, strain contours are presented for the circumferential direction only in the main body of the text. Contours for the meridional strains can be found in the Appendix.
3.1. Human Skin.
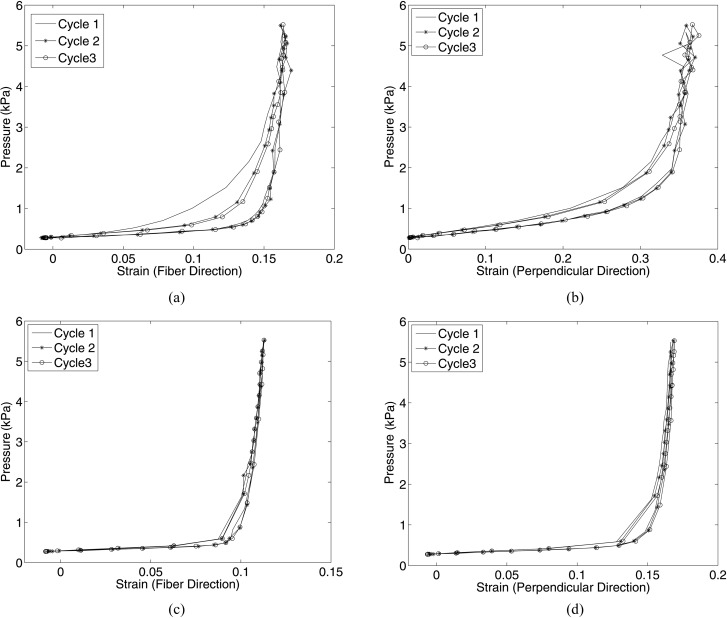
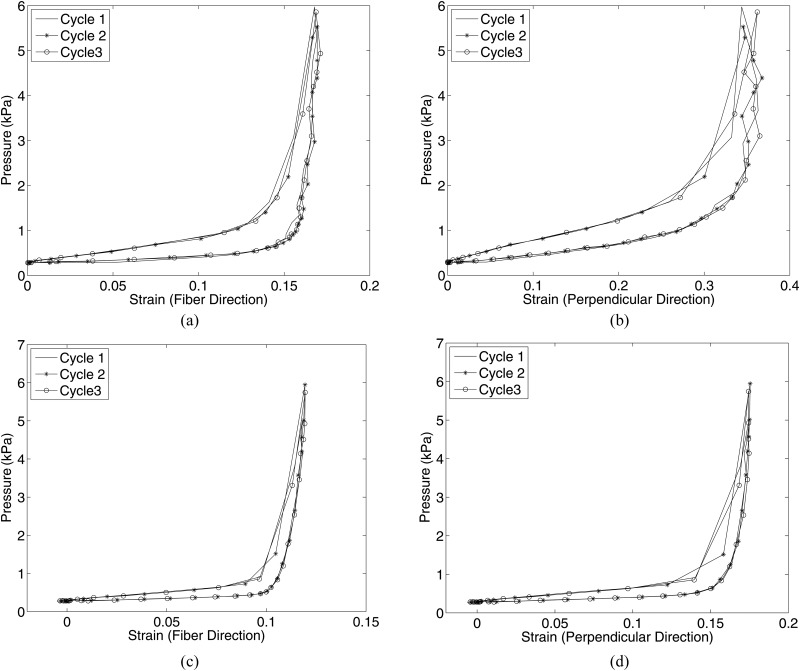
The three human skin specimens tested are identified by sex/age. Figure 4 plots the pressure-strain response in both the fiber and perpendicular directions for two specimens at the slow 0.070-kPa/s loading rate with 15-min recovery time. Figure 5 plots the pressure-strain response for the same two specimens for the fast 0.70-kPa/s loading rate with 5-min recovery time. The differences in the maximum strain between each subsequent cycle were small, less than 2% of the total applied strain for 14 of the 16 comparisons, and random. Both positive and negative differences were calculated between successive cycles. The differences between cycles as a percent of the total strain for all samples and strain rates are listed in Table 2. Some of this small variability in strains could be attributed to the accuracy of the DIC displacement measurements and of the pressure transducer. We have also previously reported that strains calculated at a single point for human skin tissue can vary by up to 1.6% strain over a range of ± 1 mm of the apex [32].
Fig. 4.
Pressure-strain response for two human skin specimens tested at a slower rate of 0.07 kPa/s with 15-min recovery periods: (a) M/43 - fiber direction; (b) M/43 - perpendicular direction; (c) M/61 - fiber direction; (d) M/61 - perpendicular direction
Fig. 5.
Pressure-strain response for two human skin specimens tested at tenfold faster loading rate of 0.70 kPa/s with 5-min recovery periods: (a) M/43 - fiber direction; (b) M/43 - perpendicular direction; (c) M/61 - fiber direction; (d) M/61 - perpendicular direction
Table 2.
Difference in maximum strain between adjacent cycles as a percentage of the total strain for all human skin data plotted in Figures 4 and 5
|
0.07 kPa/s |
0.70 kPa/s |
||||
|---|---|---|---|---|---|
| Specimen | Compared cycles | Fiber | Perpendicular | Fiber | Perpendicular |
| M/43 | Cycle 1 and cycle 2 | –0.92% | 0.17% | 0.95% | 0.49% |
| Cycle 2 and cycle 3 | 1.11% | 2.23% | –0.41% | 4.80% | |
| M/61 | Cycle 1 and cycle 2 | 0.53% | 1.20% | 0.00% | 0.46% |
| Cycle 2 and cycle 3 | –0.27% | 0.36% | 0.08% | –0.57% | |
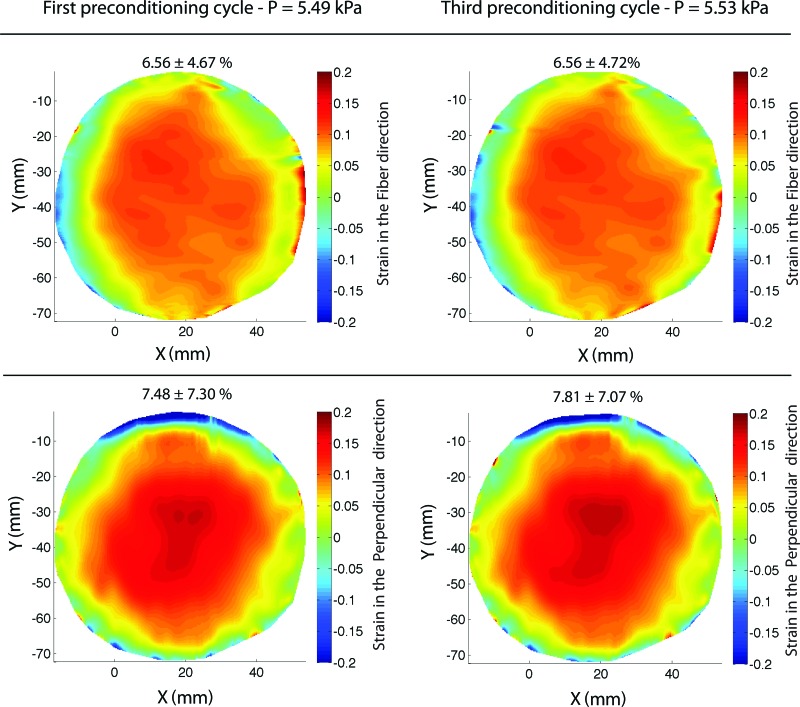
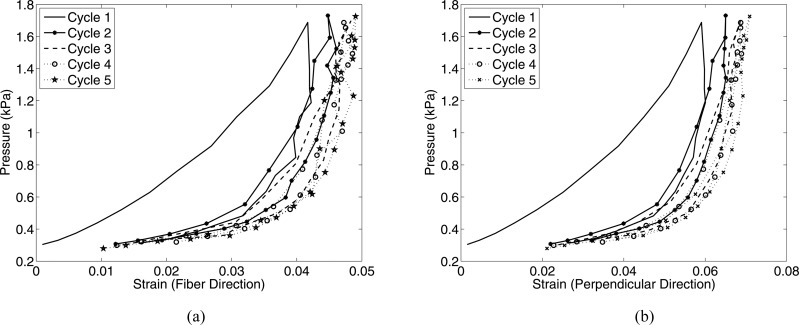
Complete strain recovery was achieved during each cycle for both the (M/43) and (M/61) specimens. A slight decrease in hysteresis was noted between the first and second load cycle for the fiber direction for the (M/43) sample only. Figure 6 shows a contour plot of the strains in both the fiber and perpendicular directions for the (M/61) specimen, comparing the maximum pressure of the first and third cycle at 0.07 kPa/s. The strain contours are nearly identical between the two cycles. Finally, Fig. 7 plots the pressure-strain response for a third specimen (M/83) subjected to five successive load-unload cycles not separated by a recovery period. The resulting dramatic rightward shift of the strain response compared to the results in Fig. 4 was caused by viscoelastic effects.
Fig. 6.
Contours of the strain in the fiber and perpendicular directions at the maximum pressure of the first and final cycle for the (M/61) human skin specimen tested at the slower 0.07 kPa/s loading rate with 15-min recovery periods. The mean and standard deviation of the strains across the entire contour are reported above each figure.
Fig. 7.
Pressure-strain response for a skin specimen (M/83) subjected to pressure cycles at 0.07 kPa/s without intervening recovery periods, measured for the fiber and perpendicular directions
3.2. Bovine Cornea.
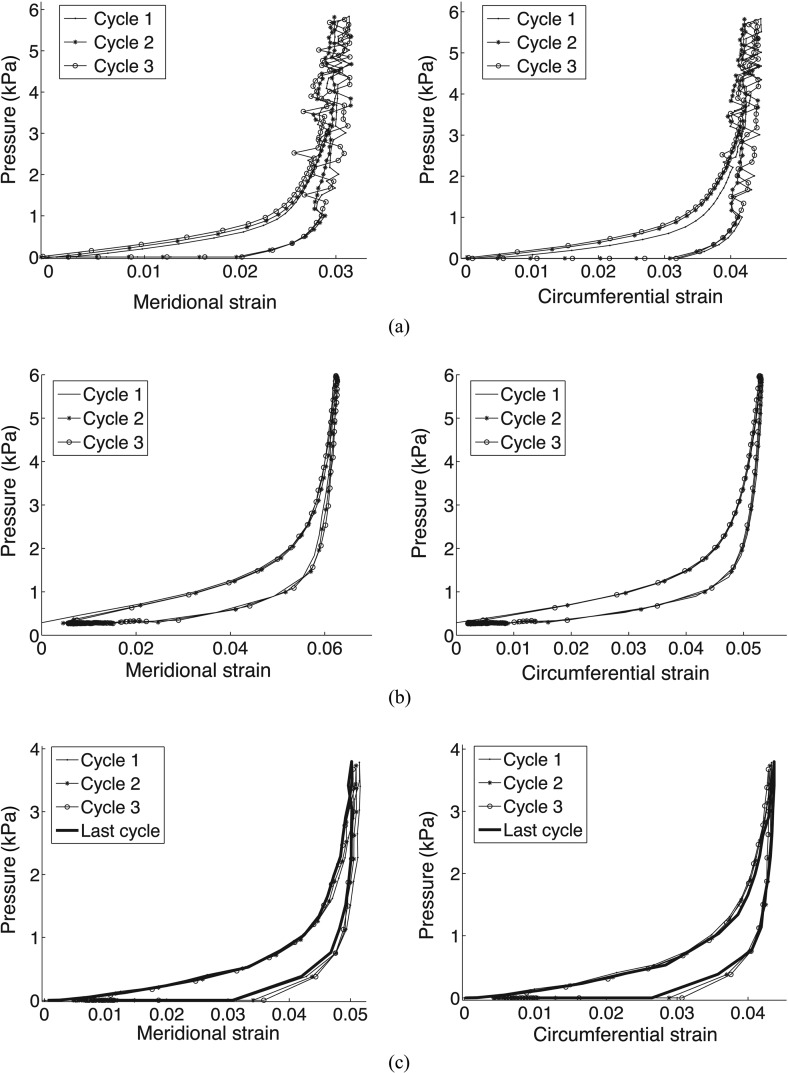
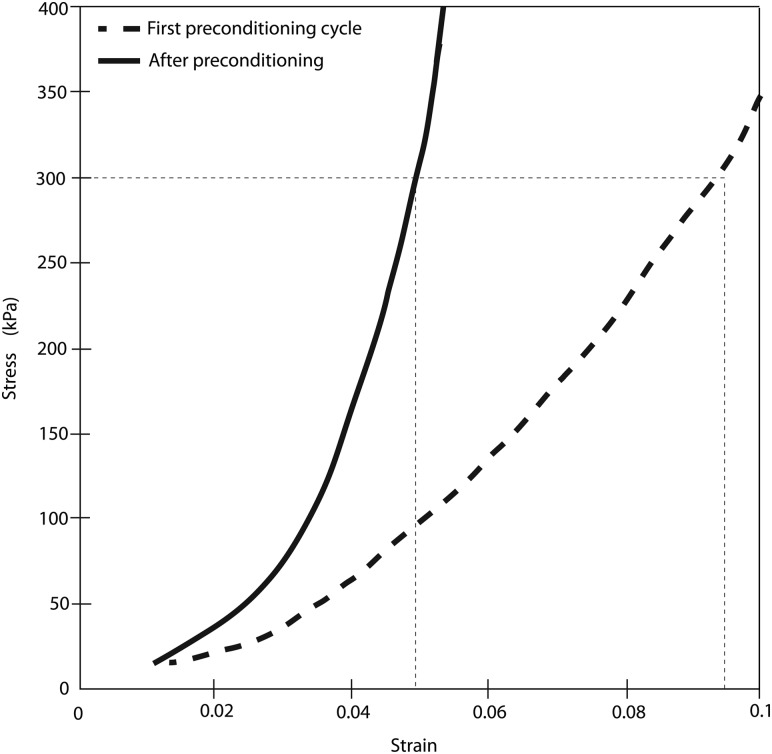
Figure 8(a) plots the pressure-strain response for both the meridional and circumferential directions for the bovine cornea. Reflections from the shiny wet surface of the bovine cornea affected the quality of the images and the DIC correlation, contributing to the noise in the pressure-strain curves. However, negligible differences in the loading and unloading curves were observed between the three cycles. In addition, full recovery was achieved upon unloading. The differences in the peak strains between each cycle were small: the percent differences in the meridional and circumferential strains between the first and second cycle were 0.7% and 1.0% of the strains at the maximum pressure and the percent differences in the meridional and circumferential strains between the second and third cycle were 0.3% and 1.0% of the strains at the maximum pressure. These differences are negligible compared to those obtained by Boyce et al. [16] for uniaxial tension tests of the bovine cornea, where the difference in the peak strains before and after preconditioning was 47% of the total applied strain (Fig. 12 in the Appendix). This large preconditioning effect reported by Boyce et al. was obtained even though the specimen was allowed to recover for an extended period of time at baseline at the end of the preconditioning protocol.
Fig. 8.
Pressure-strain response computed over an averaged region in the meridional and circumferential directions for three successive cycles for (a) bovine cornea, (b) porcine sclera, and (c) bovine sclera. The bovine sclera plot in (c) included a final cycle after 4 hours of additional testing, including two creep tests and a slow load-unload test.
Fig. 12.
Uniaxial stress-strain curves measured for bovine cornea comparing the response from the loading portion of the first pressure cycle (–) of the preconditioning protocol and from the loading portion of a pressure cycle after preconditioning (-). Results show a large stiffening effect associated with preconditioning. The specimen was allowed to rest at the baseline pressure for an extended period of time after the preconditioning. Adapted from Fig. 7 of Boyce et al. [16].
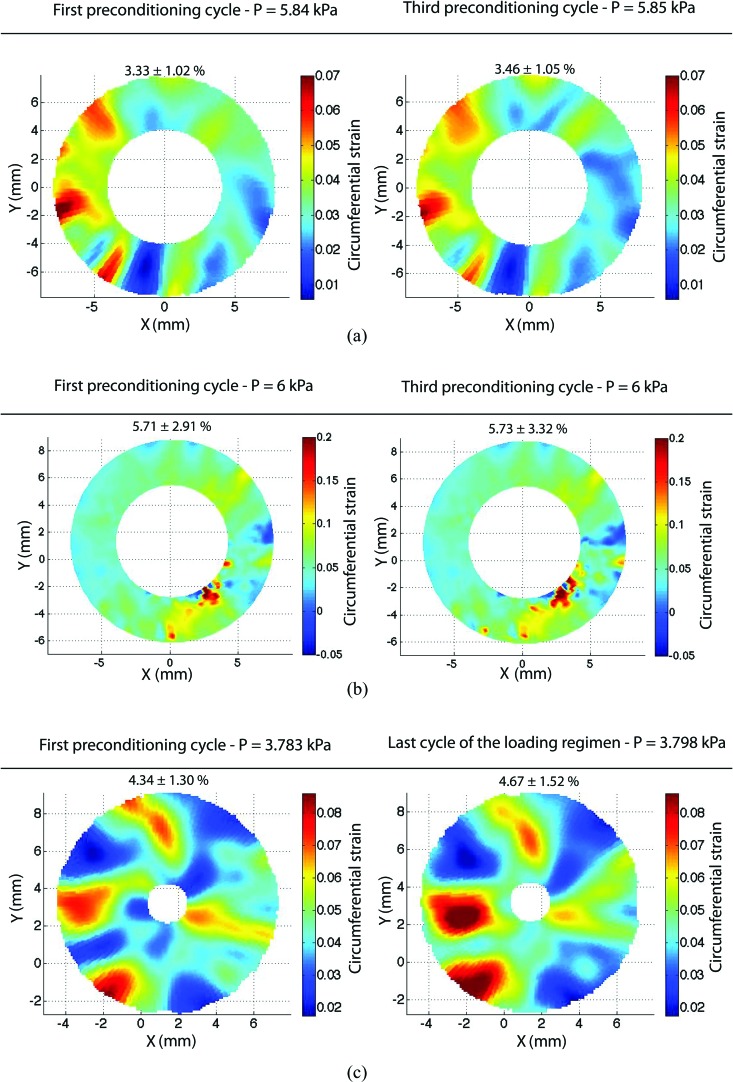
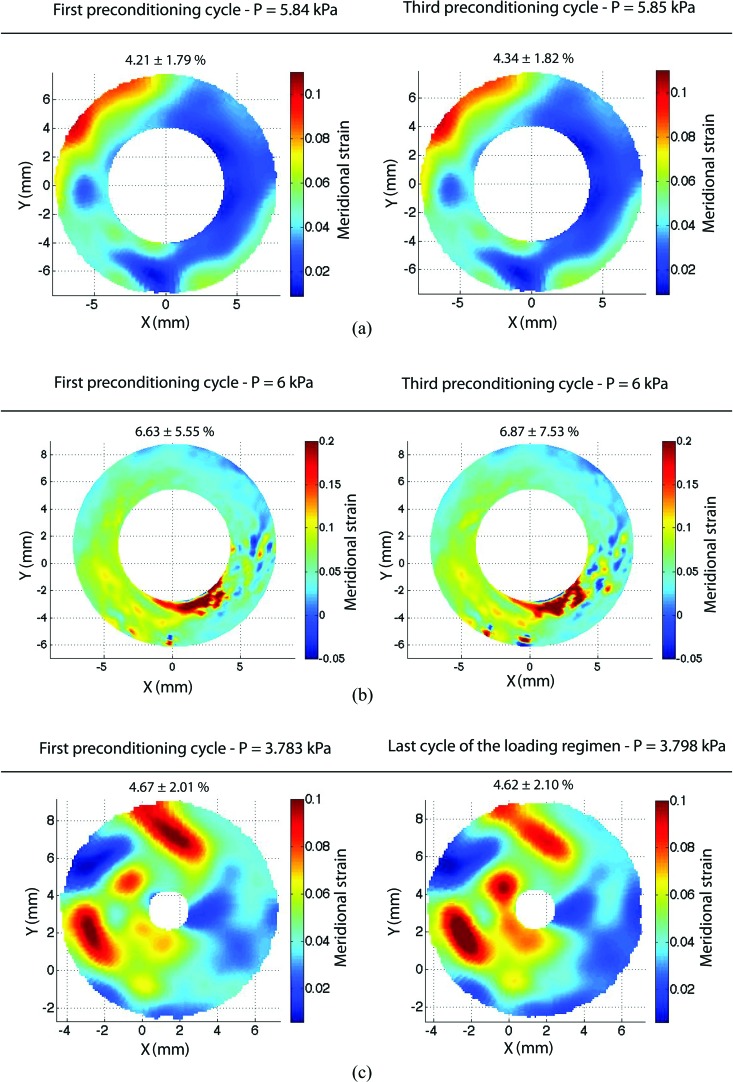
Figure 9(a) shows the contours of the circumferential strain at the maximum pressure of the first load and the final load for a 4-mm-wide annulus located 4 mm from the apex. While the majority of the plotted area shows good agreement, we observed a slight stiffening between the first and the third cycles that was likely caused by a loss of hydration during the time of testing. Previous studies by Boyce et al. [34] (Fig. 10) showed that, when a proper humidity level was maintained during inflation testing, the pressure-displacement response was nearly identical between each loading cycle. The meridional strain contours, found in Fig. 11(a) in the Appendix, showed the same trend.
Fig. 9.
Contour plots of the circumferential strains at the maximum pressure of the first and final pressure cycles for (a) bovine cornea, (b) porcine sclera, and (c) bovine sclera. The bovine sclera plot in (c) included a final cycle after 4 hours of additional testing, including two creep tests and a slow load-unload test. The mean and standard deviation of the strains across the entire contour are reported above each figure.
Fig. 11.
Contour plots of the meridional strains at the maximum pressure of the first and final pressure cycles for (a) bovine cornea, (b) porcine sclera, and (c) bovine sclera. The bovine sclera plot in (c) included a final cycle after 4 hours of additional testing, including two creep tests and a slow load-unload test. The mean and standard deviation of the strains across the entire contour are reported above each figure.
3.3. Porcine Sclera.
Figure 8(b) plots the pressure-strain relationship in both the meridional and circumferential directions for three preconditioning cycles for the porcine sclera. As reported for the bovine cornea, little difference was observed in the loading or unloading curves between the cycles. Moreover, both strain directions exhibited complete recovery within experimental error. The differences in peak strains between loading cycles were random and small: the percent differences in the meridional and circumferential strain between the first and second cycles were 0.80% and −0.38% of the strains at the maximum pressure and the percent differences between the second and third cycle were −0.16% and −0.19% of the strains at the maximum pressure.
Figure 9(b) shows the contours of the circumferential strain at both the maximum pressure of the first load and the final load for a 2.34-mm-wide annulus located 2 mm away from the apex. Strain contours at the maximum pressure were similar between the first and final cycle of the loading regimen, demonstrating repeatability of the surface strain field. The meridional strain contours, found in Fig. 11(b) in the Appendix, supported the same conclusions.
3.4. Bovine Sclera.
Figure 8(c) plots the pressure-strain relationship in both the meridional and circumferential directions for the first three preconditioning cycles and the final load-unload cycle of the bovine sclera loading protocol after 4 h of testing (Fig. 2). No significant softening/stiffening effect or change in the hysteresis was observed, and the final load cycle was nearly identical to the first load-unload cycle. The differences in peak strains between cycles were small: the percent differences in the meridional and circumferential strains between the first and second cycle were −0.23% and −1.15% of the strains at the maximum pressure and the percent differences in the meridional and circumferential strains between the second and third cycle were −0.69% and −0.98% of the strains at the maximum pressure. The percent difference in the meridional and circumferential strains between the first and final cycle after 4 h of additional testing were 1.83% and −2.35% of the strains at the maximum pressure. This demonstrates that the pressure-strain response was repeatable after 4 h of testing, during which load-unload cycles at two different pressure rates and ramp-hold tests at three different pressures were performed. The specimens exhibit complete recovery after each load cycle.
Figure 9(c) shows the circumferential strain contours at the maximum pressure of the first and final loading cycle over a 5-mm-wide annulus located 1 mm from the apex. Strain contours at the maximum pressure were similar between the first cycle and final cycle of the loading regimen, demonstrating repeatability of the surface strain field. The meridional strain contours, found in Fig. 11(c) in the Appendix, supported the same conclusions. The difference in the local value of the strain could be large in some areas, particularly in the lower left quadrant of Fig. 9(b). This is probably due to a degradation of the speckling pattern caused by the high humidity level maintained during the time of testing or the presence of anatomic features, such as veins.
4. Discussion
We have shown that the mechanical response of bovine cornea, porcine sclera, bovine sclera, and human skin tissue measured by inflation tests exhibited minimal preconditioning effects compared to the mechanical response of the same tissues measured by uniaxial and biaxial tests [3,15–17]. Nearly the same peak strain was achieved for each load cycle, no shifting was seen between load cycles, and the specimens achieved complete strain recovery. The differences observed in the peak strain between loading cycles for all tissue specimens were small, less than 2% of the total strain for all but 3 of the 26 loading cycles, and were random. Both positive and negative differences in the peak strain were calculated between successive cycles, and the differences did not, in general, evolve systematically with the number of cycles. The small differences measured in the inflation response were substantially lower than the 47% difference generated by the preconditioning protocol for uniaxial tension testing of bovine cornea, as reported by Boyce et al. [16]. The small variations observed can be attributed to experimental and numerical noise, particularly for the skin strain data, which was calculated at a single point and has been reported to vary by up to 1.6% over a range of ±1 mm [32]. Variability could also have arisen from experimental conditions, such as loss of hydration, particularly for the bovine cornea, which was not tested inside a humidity chamber and was only hydrated by the inflation fluid. These results were not found to depend on loading rate or loading history. Moreover, strain contours calculated at the maximum pressure for the first and last load cycles showed that repeatability was achieved not just at one point or on average over a region but over larger areas of the specimen surface. The repeatable results were obtained for loading regimens that included a rest period between each loading cycle to achieve complete viscoelastic strain recovery. We further illustrated that, if the recovery periods were not allowed, the viscoelastic response of the tissue produced the characteristic rightward shift of the pressure-strain response commonly attributed to preconditioning. Previous inflation testing of bovine cornea [34] and mouse carotid artery by Ning et al. [36] also showed only small differences in the pressure-displacement response after repeated loading. The latter subjected the mouse carotid artery to four pressure cycles.
Preconditioning protocols are commonly used to obtain a repeatable mechanical response in uniaxial and biaxial strip tests but can be time-consuming and restrictive. The preconditioning effects are often sensitive to many factors, including strain rate, strain levels, strain history, and the applied strain state [7,15,22]; thus, achieving repeatable results for a particular loading regimen requires custom preconditioning protocols and multiple rounds of preconditioning to measure the mechanical response to different strain rates and strain states. The observation that preconditioning effects arise from load-induced changes in the tissue fiber structure [2,26] indicates that the mechanical properties measured may not be representative of the native tissue. Some authors avoid the preconditioning effects by only using data from the first loading curve [6], but this is not feasible if multiple tests need to be carried out on the same tissue. Other authors model the structural change of preconditioning as an unrecoverable deformation [23] in order to back out in vivo properties; however, this can be computationally intensive and inefficient. If the effects of preconditioning could be avoided all together, testing procedures and analyses could be greatly simplified.
We propose that our inflation test protocol produces negligible load-induced changes to the deformation response because it avoids three possible mechanisms associated with preconditioning: viscoelastic effects, fiber rearrangement with loading, and microstructural damage to the tissue. The inclusion of recovery periods after each load-unload cycle to allow complete recovery of the specimens eliminates viscoelastic memory effects. If these recovery periods are not included, the tissue will viscoelastically lengthen to produce the commonly observed rightward shift of the load-elongation curves. We demonstrated the effect of viscoelasticity here for cyclic loading of skin tissue. This is in contrast to previous works on uniaxial tests [2,22,24], where even though recovery periods are allowed, shifting is still observed as the gauge length of the tissue progressively increases with loading cycles [23]. These results suggest that there is a permanent change induced in the tissue by cyclic uniaxial loading that is not encountered in our inflation testing protocol.
We speculate that the permanent deformation incurred during preconditioning is caused either by a reorientation of fibers along the loading direction or damage to the fibers and matrix constituents of the extracellular matrix of the tissue (e.g., the breaking of collagen cross-links). Optical studies by Tower et al. [26] and Quinn and Winkelstein [27] of a tissue simulant under uniaxial loading showed that the fibers reoriented along the loading direction with repeated cycles, eventually reaching an equilibrium “preconditioned” state. Moreover, the changes to the fiber structure persisted after the load was removed. For the inflation tests, the specimen boundary is fully glued to the holder, and this likely limits the reorientation of the long collagen fibers during testing. Furthermore, the applied pressure is limited to a physiological range to prevent damage to the tissue structure. Our results suggest that mechanical tests of soft tissues can be designed to limit the effects of preconditioning, and it is likely that other tests could be devised based on the same principles to avoid evolving mechanical behavior with loading. Further testing is required to confirm if these results can be general for inflation testing of other planar tissues characterized by long fibers oriented parallel to the surface of the tissue.
The results presented in this paper were obtained using our previously published implementations of 3D-DIC [31–33]. Digital image correlation has become widely used to measure displacements and strains of soft tissues, and a number of authors have calculated the accuracy and resolution of 3D-DIC displacements [37–41] and strains [40,42,43] using methods similar to those described here. For example, Sutton et al. [42] reported a standard deviation of 0.03%–0.08% strain for a 3D translation of a cylinder. Our estimate of 0.07% strain resolution is in agreement with these previous studies. However, more work is needed to measure and validate the resolution of 3D-DIC strain measurements in tissues. This is not critical for the conclusions drawn in our present study, because they are dependent on strain comparisons rather than absolute values of strains. We observed repeatable strain measurements between cycles for both skin and ocular tissues, despite the fact that strain levels for skin were up to ten times higher than for ocular tissues. Moreover, we obtained cycle-to-cycle repeatability for a wide range of pressure levels and strain rates. Any preconditioning-associated shift that was too small to be resolved by our system would still be negligible compared to the shifts observed for uniaxial and biaxial tests. The consistency of the conclusions between tissue type, species, and strain rate indicates that our results are insensitive to resolution limitations.
Our conclusions are tempered by several limitations. We have thus far demonstrated negligible preconditioning effects for a limited number of tissues. All tissues tested in this work have in common a 2D in-plane network of long fibers; fully fixing the boundaries may not have the same effect for tissues comprised of shorter or out-of-plane fibers, such as cardiac tissue. Poroelastic tissues, such as cartilage, may also have a different response than tissues dominated by a viscoelastic ECM network. DIC displacement uncertainty and numerical differentiation of the displacements contribute to uncertainty in the strain calculation. To avoid noisy pressure-strain curves for ocular tissues, we averaged the strain over a small region instead of plotting point-wise strain, as we did for skin tissues. However, strains computed at a single point still did not show preconditioning, only a higher level of noise. We also did not carry out any imaging studies to confirm the lack of fiber rearrangement or damage to the tissue after repeated loading, leaving this for future studies.
5. Conclusions
We have shown that the inflation responses of bovine cornea, porcine sclera, bovine sclera, and human skin exhibit negligible preconditioning effects compared to those observed for the same tissues in uniaxial and biaxial tension tests [3,15–17]. These results suggest that preconditioning effects can be avoided for certain tissues by experimental design. The inflation test methods presented minimized the effects of preconditioning by (i) allowing adequate recovery time between cycles, (ii) fully fixing the boundary of the tissue to prevent fiber rearrangements, and (iii) limiting the applied loading to physiological levels to prevent microstructural damage to the tissue. These results are likely limited to planar tissues with long fibers parallel to the tissue surface but may be extended to planar tissues other than those tested here to allow for more accurate, repeatable measurements of mechanical properties. The findings of this work may help to guide the design of other experimental systems to minimize the effect of preconditioning on the mechanical response of soft tissues.
Acknowledgment
This work was supported in part by Public Health Service Research Grant EY021500 and WSE-APL Partnership Grant.
Appendix
Figure 10 plots the meridional and circumferential strain contours for the numerical inflation of a 12.5-mm-radius sphere with added noise representative of DIC uncertainty. Based on previous work, an applied displacement of 200 μm can correspond to a DIC measurement of 195 ± 12 μm [31]. Applying a Gaussian distribution corresponding to this DIC measurement results in a strain field of 1.61 ± 0.071% for the meridional direction and 1.59 ± 0.056% for the circumferential direction, which is nearly equivalent to the 1.61% theoretical strain for a 200 -μm radial displacement.
Figure 11 plots contours for the meridional strain at the peak pressure of the first and last load-unload cycle for all ocular tissues tested. As seen for the circumferential direction in Secs. 3.2–3.4, the surface strain field is repeatable between the first and final load cycles, further supporting that the tissues do not exhibit a change in deformation with preconditioning.
Figure 12 plots stress-strain curves for the first and final preconditioning cycle for a uniaxial test on bovine cornea published by Boyce et al. [16]. The difference in peak strain before and after preconditioning was 47%, much higher than the 1% difference reported in this paper for inflation tests of the same tissue. This supports that the small differences between cycles reported in this work are negligible compared to what is typically observed for uniaxial preconditioning.
Contributor Information
Baptiste Coudrillier, Department of Mechanical Engineering, The Johns Hopkins University, Baltimore, MD 21218 .
Stephen Alexander, Department of Biomedical Engineering, Boston University, Boston, MA 02215 .
Thao D. Nguyen, e-mail: vicky.nguyen@jhu.edu, Department of Mechanical Engineering, The Johns Hopkins University, Baltimore, MD 21218 .
References
- [1]. Fung, Y. C. B. , 1973, “Biorheology of Soft Tissues,” Biorheology, 10(2), pp. 139–155. [DOI] [PubMed] [Google Scholar]
- [2]. Fung, Y. C. , 1993, Mechanical Properties of Living Tissues, Springer, New York. [Google Scholar]
- [3]. Munoz, M. J. , Bea, J. A. , Rodriguez, J. F. , Ochoa, I. , Grasa, J. , Perez del Palomar, A. , Zaragoza, P. , Osta, R. , and Doblare, M. , 2008, “An Experimental Study of the Mouse Skin Behaviour: Damage and Inelastic Aspects,” J. Biomech., 41(1), pp. 93–99. 10.1016/j.jbiomech.2007.07.013 [DOI] [PubMed] [Google Scholar]
- [4]. Zeng, Y. , Liu, Y. , Xu, C. , Xu, X. , Xu, H. , and Sun, G. , 2004, “Biomechanical Properties of Skin In Vitro for Different Expansion Methods,” Clin. Biomech., 19(8), pp. 853–857. 10.1016/j.clinbiomech.2004.05.009 [DOI] [PubMed] [Google Scholar]
- [5]. Lee, M. , Fung, Y. C. , Shabetai, R. , and LeWinter, M. M. , 1987, “Biaxial Mechanical Properties of Human Pericardium and Canine Comparisons,” Am. J. Physiol. Heart Circ. Physiol., 253(1), pp. H75–H82. [DOI] [PubMed] [Google Scholar]
- [6]. Provenzano, P. , Lakes, R. , Keenan, T. , and Vanderby, R., Jr. , 2001, “Nonlinear Ligament Viscoelasticity,” Ann. Biomed. Eng., 29(10), pp. 908–914. 10.1114/1.1408926 [DOI] [PubMed] [Google Scholar]
- [7]. Cheng, S. , Clarke, E. C. , and Bilston, L. E. , 2009, “The Effects of Preconditioning Strain on Measured Tissue Properties,” J. Biomech., 42(9), pp. 1360–1362. 10.1016/j.jbiomech.2009.03.023 [DOI] [PubMed] [Google Scholar]
- [8]. Lanir, Y. , and Fung, Y. C. , 1974, “Two Dimensional Mechanical Properties of Rabbit Skin. I. Experimental System,” J. Biomech., 7(1), pp. 29–34. 10.1016/0021-9290(74)90067-0 [DOI] [PubMed] [Google Scholar]
- [9]. Samani, A. , Bishop, J. , Luginbuhl, C. , and Plewes, D. B. , 2003, “Measuring the Elastic Modulus of Ex Vivo Small Tissue Samples,” Phys. Med. Biol., 48(14), pp. 2183–2198. 10.1088/0031-9155/48/14/310 [DOI] [PubMed] [Google Scholar]
- [10]. Marquez, J. P. , Legant, W. , Lam, V. , Cayemberg, A. , Elson, E. , and Wakatsuki, T. , 2009, “High-Throughput Measurements of Hydrogel Tissue Construct Mechanics,” Tissue Eng., 15(2), pp. 181–190. 10.1089/ten.tec.2008.0347 [DOI] [PMC free article] [PubMed] [Google Scholar]
- [11]. Nava, A. , Mazza, E. , Haefner, O. , and Bajka, M. , 2004, Experimental Observation and Modelling of Preconditioning in Soft Biological Tissues, Vol. 3078, (Lecture Notes in Computer Science), Springer, New York. [Google Scholar]
- [12]. Stammen, J. A. , Williams, S. , Ku, D. N. , and Guldberg, R. E. , 2001, “Mechanical Properties of a Novel PVA Hydrogel in Shear and Unconfined Compression,” Biomaterials, 22(8), pp. 799–806. 10.1016/S0142-9612(00)00242-8 [DOI] [PubMed] [Google Scholar]
- [13]. Liu, Z. , and Yeung, K. , 2006, “On Preconditioning and Stress Relaxation Behavior of Fresh Swine Skin in Different Fibre Direction,” ICBPE 2006 - Proceedings of the 2006 International Conference on Biomedical and Pharmaceutical Engineering, pp. 221–226. [Google Scholar]
- [14]. Sacks, M. S. , 2000, “Biaxial Mechanical Evaluation of Planar Biological Materials,” J, Elast., 61(1-3), pp. 199–246. 10.1023/A:1010917028671 [DOI] [Google Scholar]
- [15]. Lanir, Y. , and Fung, Y. C. , 1974, “Two Dimensional Mechanical Properties of Rabbit Skin. II. Experimental Results,” J. Biomech., 7(2), pp. 171–182. 10.1016/0021-9290(74)90058-X [DOI] [PubMed] [Google Scholar]
- [16]. Boyce, B. L. , Jones, R. E. , Nguyen, T. D. , and Grazier, J. M. , 2007, “Stress-Controlled Viscoelastic Tensile Response of Bovine Cornea,” J. Biomech., 40(11), pp. 2367–2376. 10.1016/j.jbiomech.2006.12.001 [DOI] [PubMed] [Google Scholar]
- [17]. Girard, M. , Suh, J. F. , Hart, R. T. , Burgoyne, C. F. , and Downs, J. C. , 2007, “Effects of Storage Time on the Mechanical Properties of Rabbit Peripapillary Sclera After Enucleation,” Curr. Eye Res., 32(5), pp. 465–470. 10.1080/02713680701273792 [DOI] [PubMed] [Google Scholar]
- [18]. Lari, D. , Schultz, D. , Wang, A. , Lee, O. , and Stewart, J. , 2011, “Scleral Mechanics: Comparing Whole Globe Inflation and Uniaxial Testing,” Exp. Eye Res., 94, pp. 128–135. 10.1016/j.exer.2011.11.017 [DOI] [PMC free article] [PubMed] [Google Scholar]
- [19]. Schatzmann, L. , Brunner, P. , and Staubli, H. U. , 1998, “Effect of Cyclic Preconditioning on the Tensile Properties of Human Quadriceps Tendons and Patellar Ligaments,” Knee Surg. Sports Traumatol. Arthrosc., 6(Suppl. 1), pp. S56–S61. 10.1007/s001670050224 [DOI] [PubMed] [Google Scholar]
- [20]. Carew, E. O. , Garg, A. , Barber, J. E. , and Vesely, I. , 2004, “Stress Relaxation Preconditioning of Porcine Aortic Valves,” Ann. Biomed. Eng., 32(4), pp. 563–572. 10.1023/B:ABME.0000019176.49650.19 [DOI] [PubMed] [Google Scholar]
- [21]. Eshel, H. , and Lanir, Y. , 2001, “Effects of Strain Level and Proteoglycan Depletion on Preconditioning and Viscoelastic Responses of Rat Dorsal Skin,” Ann. Biomed. Eng., 29(2), pp. 164–172. 10.1114/1.1349697 [DOI] [PubMed] [Google Scholar]
- [22]. Carew, E. O. , Barber, J. E. , and Vesely, I. , 2000, “Role of Preconditioning and Recovery Time in Repeated Testing of Aortic Valve Tissues: Validation Through Quasilinear Viscoelastic Theory,” Ann. Biomed. Eng., 28(9), pp. 1093–1100. 10.1114/1.1310221 [DOI] [PubMed] [Google Scholar]
- [23]. Lokshin, O. , and Lanir, Y. , 2009, “Viscoelasticity and Preconditioning of Rat Skin Under Uniaxial Stretch: Microstructural Constitutive Characterization,” ASME J. Biomech. Eng., 131(3), p. 031009. 10.1115/1.3049479 [DOI] [PubMed] [Google Scholar]
- [24]. Graf, B. K. , Vanderby, Jr., R. , Ulm, M. J. , Rogalski, R. P. , and Thielke, R. J. , 1994, “Effect of Preconditioning on the Viscoelastic Response of Primate Patellar Tendon,” Arthroscopy, 10(1), pp. 90–96. 10.1016/S0749-8063(05)80298-1 [DOI] [PubMed] [Google Scholar]
- [25]. Viidik, A ., 1973, “Functional Properties of Collagenous Tissues,” Int. Rev. Connect Tissue Res., 6, pp. 127–215. [DOI] [PubMed] [Google Scholar]
- [26]. Tower, T. T. , Neidert, M. R. , and Tranquillo, R. T. , 2002, “Fiber Alignment Imaging During Mechanical Testing of Soft Tissues,” Ann. Biomed. Eng., 30(10), pp. 1221–1233. 10.1114/1.1527047 [DOI] [PubMed] [Google Scholar]
- [27]. Quinn, K. P. , and Winkelstein, B. A. , 2011, “Preconditioning Is Correlated With Altered Collagen Fiber Alignment in Ligament,” ASME J. Biomech. Eng., 133(6), p. 064506. 10.1115/1.4004205 [DOI] [PubMed] [Google Scholar]
- [28]. Gregersen, H. , Emery, J. L. , and Mcculloch, A. D. , 1998, “History-Dependent Mechanical Behavior of Guinea-Pig Small Intestine,” Ann. Biomed. Eng., 26(5), pp. 850–858. 10.1114/1.109 [DOI] [PubMed] [Google Scholar]
- [29]. Emery, J. L. , Omens, J. H. , and McCulloch, A. D. , 1997, “Strain Softening in Rat Left Ventricular Myocardium,” ASME J. Biomech. Eng., 119(1), pp. 6–12. 10.1115/1.2796067 [DOI] [PubMed] [Google Scholar]
- [30]. Myers, K. M. , Coudrillier, B. , Boyce, B. L. , and Nguyen, T. D. , 2010, “The Inflation Response of the Posterior Bovine Sclera,” Acta Biomater., 6(11), pp. 4327–4335. 10.1016/j.actbio.2010.06.007 [DOI] [PubMed] [Google Scholar]
- [31]. Coudrillier, B. , Tian, J. , Alexander, S. , Myers, K. M. , Quigley, H. A. , and Nguyen, T. D. , 2012, “Biomechanics of the Human Posterior Sclera: Age- and Glaucoma-Related Changes Measured Using Inflation Testing,” Invest. Ophthalmol. Vis. Sci., 53(4), pp. 1714–1728. 10.1167/iovs.11-8009 [DOI] [PMC free article] [PubMed] [Google Scholar]
- [32]. Tonge, T. K. , Atlan, L. S. , Voo, L. M. , and Nguyen, T. D. , 2013, “Full-Field Bulge Test for Planar Anisotropic Tissues: Part I—Experimental Methods Applied to Human Skin Tissue,” Acta Biomater., 9(4), pp. 5913–5925. 10.1016/j.actbio.2012.11.035 [DOI] [PubMed] [Google Scholar]
- [33]. Coudrillier, B. , Boote, C. , Quigley, H. A. , and Nguyen, T. D. , 2012, “Scleral Anisotropy and Its Effects on the Mechanical Response of the Optic Nerve Head,” Biomech. Model. Mechanobiol., pp. 1–23. 10.1007/s10237-012-0455-y [DOI] [PMC free article] [PubMed] [Google Scholar]
- [34]. Boyce, B. L. , Grazier, J. M. , Jones, R. E. , and Nguyen, T. D. , 2008, “Full-Field Deformation of Bovine Cornea Under Constrained Inflation Conditions,” Biomaterials, 29(28), pp. 3896–3904. 10.1016/j.biomaterials.2008.06.011 [DOI] [PubMed] [Google Scholar]
- [35]. Tonge, T. K. , Voo, L. M. , and Nguyen, T. D. , 2013, “Full-Field Bulge Test for Planar Anisotropic Tissues: Part II—A Thin Shell Method for Determining Material Parameters and Comparison of Two Distributed Fiber Modeling Approaches,” Acta Biomater., 9(4), pp. 5926–5942. 10.1016/j.actbio.2012.11.034 [DOI] [PubMed] [Google Scholar]
- [36]. Ning, J. , Xu, S. , Wang, Y. , Lessner, S. M. , Sutton, M. A. , Anderson, K. , and Bischoff, J. E. , 2010, “Deformation Measurements and Material Property Estimation of Mouse Carotid Artery Using a Microstructure-Based Constitutive Model,” ASME J. Biomech. Eng., 132(12), p. 121010. 10.1115/1.4002700 [DOI] [PubMed] [Google Scholar]
- [37]. Meyer, C. A. , Bertrand, E. , Boiron, O. , and Deplano, V. , 2011, “Stereoscopically Observed Deformations of a Compliant Abdominal Aortic Aneurysm Model,” ASME J. Biomech. Eng., 133(11), p. 111004. 10.1115/1.4005416 [DOI] [PubMed] [Google Scholar]
- [38]. Soons, J. , Lava, P. , Debruyne, D. , and Dirckx, J. , 2012, “Full-Field Optical Deformation Measurement in Biomechanics: Digital Speckle Pattern Interferometry and 3D Digital Image Correlation Applied to Bird Beaks,” J. Mech. Behav. Biomed. Mater., 14, pp. 186–191. 10.1016/j.jmbbm.2012.05.004 [DOI] [PubMed] [Google Scholar]
- [39]. Hu, Z. , Xie, H. , Lu, J. , Wang, H. , and Zhu, J. , 2011, “Error Evaluation Technique for Three-Dimensional Digital Image Correlation,” Appl. Opt., 50(33), pp. 6239–6247. 10.1364/AO.50.006239 [DOI] [PubMed] [Google Scholar]
- [40]. Ke, X.-D. , Schreier, H. , Sutton, M. , and Wang, Y. , 2011, “Error Assessment in Stereo-Based Deformation Measurements,” Exp. Mech., 51(4), pp. 423–441. 10.1007/s11340-010-9450-3 [DOI] [Google Scholar]
- [41]. Fazzini, M. , Mistou, S. , Dalverny, O. , and Robert, L. , 2010, “Study of Image Characteristics on Digital Image Correlation Error Assessment,” Opt. Lasers Eng., 48(3), pp. 335–339. 10.1016/j.optlaseng.2009.10.012 [DOI] [Google Scholar]
- [42]. Sutton, M. , Ke, X. , Lessner, S. , Goldbach, M. , Yost, M. , Zhao, F. , and Schreier, H. , 2008, “Strain Field Measurements on Mouse Carotid Arteries Using Microscopic Three-Dimensional Digital Image Correlation,” J. Biomed. Mater. Res., Part A, 84(1), pp. 178–190. 10.1002/jbm.a.31268 [DOI] [PubMed] [Google Scholar]
- [43]. Schreier, H. , Garcia, D. , and Sutton, M. , 2004, “Advances in Light Microscope Stereo Vision,” Exp. Mech., 44(3), pp. 278–288. 10.1007/BF02427894 [DOI] [Google Scholar]


