

Abstract
This article presents a review of signals used for measuring physiology and activity during sleep and techniques for extracting information from these signals. We examine both clinical needs and biomedical signal processing approaches across a range of sensor types. Issues with recording and analysing the signals are discussed, together with their applicability to various clinical disorders. Both univariate and data fusion (exploiting the diverse characteristics of the primary recorded signals) approaches are discussed, together with a comparison of automated methods for analysing sleep.
Keywords: Actigraphy, Audio, Electrocardiogram, Electroencephalogram, Photoplethysmogram, Respiration, Signal Processing, Sleep
1. Introduction
The International Classification of Sleep Disorders (ICSD) has identified over 80 different sleep disorders, all of which have associated treatments (Thorpy 1990, AASM 2005). The effects of sleep disorders are extensive, impacting sufferers physically, psychologically and financially. Up to 40% of the United States (US) adult population experience problems with falling asleep or daytime sleepiness, which are largely assumed to be due to disturbed sleep patterns (Hossain & Shapiro 2002). It is difficult to quantify the impact of poor sleep structure in a broad sense as it is often considered a symptom of other diseases, although it is intricately connected to many of the dominant burdens of disease (Üstün et al. 1996). In fact, the health effects of sleep disorders span a wide range: from the apparently simple daytime sleepiness, which is a non-specific symptom common to other disorders (Pagel 2009), to the more severe effects of increased risk of cardiovascular disease and stroke (Young et al. 2002). Daytime sleepiness is the cause of hundreds of road traffic accidents, and has even been linked to catastrophes such as Chernobyl (Hossain & Shapiro 2002). Moreover, poor sleep affects one’s mental status, leading to poor mental function, reduced compliance which compounds chronic disease treatment, and exacerbates mental conditions such as depression and schizophrenia (Cho et al. 2008, Wulff et al. 2012).
Currently, the gold standard in terms of sleep disorder diagnosis is a sleep study, or an overnight polysomnogram (PSG). However, PSGs are expensive and are limited by the number of beds available in the study centre and the number of specialists available to read the data. There are many home sleep recording systems on the market which aim to reduce the financial cost per patient and reach a larger population by reducing the number of parameters recorded. However, without the guidance of a specialist, the patient, who has no medical or technical training, has to place the sensors in the correct positions. If placed incorrectly, the results may be inconclusive or misleading. Even if done correctly there may not be a trained specialist readily available to analyse the data. There is therefore a need to increase the quality of automatic sleep analysis, particularly for low-cost systems. This work reviews the physiology and treatment of sleep disorders, focusing particularly on sleep apnoea, the monitoring modalities and most commonly used signal processing techniques applied to signals which are useful for sleep assessment.
2. Physiological and Clinical Background
2.1. The Phenomenology of Sleep
Loomis (Loomis et al. 1936, Loomis et al. 1937) provided the earliest detailed description of various stages of sleep, based on electroencephalography (EEG), in the mid-1930s. In the early 1950s, Aserinsky & Kleitman (1953) identified rapid eye movement (REM) sleep, which is related to dreaming. Sleep has been traditionally divided into two broad types: non rapid eye movement (NREM) and REM sleep. The sleep staging criteria were standardised in 1968 by Rechtschaffen & Kales (1969) (or R&K rules), based on EEG changes, dividing NREM sleep into a four further stages (stage I, stage II, stage III, stage IV). (It should be noted that some dreaming has been observed during NREM sleep.)
In 2004, the the American Academy of Sleep Medicine (AASM) standards commissioned the AASM Visual Scoring Task Force to review the R&K scoring system. This document resulted in several minor changes, with the most significant being the combining of stages 3 and 4 into Stage N3. Arousals and respiratory, cardiac, and movement events were also added to the scoring. The revised scoring was published in 2007 as The AASM Manual for the Scoring of Sleep and Associated Events (Iber & of Sleep Medicine 2007).
NREM and REM sleep occur in alternating cycles, each lasting approximately 90–110 minutes (min) in adults, with approximately 4–6 cycles during the course of a normal 6–8 hour (h) sleep period. However, these timings change depending on the length of time asleep, age, medication, physical health and mental health. Furthermore, brief micro-arousals can occur, lasting (by definition) from 1.5–3 seconds (s) and short awakenings (defined to be longer 15 s) (Martin et al. 1997).
Generally, in a healthy young adult, NREM sleep accounts for 75–90% of total sleep time† (TST). NREM sleep comprises approximately 3–5% in stage I, 50–60% stage II, and 10–20% stages III and IV. REM sleep accounts for 10–25% of sleep time. Furthermore, stages I and II are known as light sleep and III and IV as deep sleep, or slow wave sleep (SWS). In deep sleep, BP and heart rate (HR) are generally at a 24 h low, and the sympathovagal balance shifts towards sympathetic withdrawal and parasympathetic activation (Otzenberger et al. 1998). In terms of cardiovascular activity, there is little difference between REM sleep and wakefulness.
Sleep stages are often interrupted by brief arousals, lasting from less than a second to several seconds. The mechanisms that lead to arousals are manifold, and the frequency of arousal is a useful indicator of sleep health. The cyclic alternating pattern (CAP) is a physiological component of normal NREM sleep, functionally associated with long-lasting arousal oscillations. This periodic activity, which manifests as cycles on the EEG, is organised in sequences of two or more deca-second cycles. It is also detectable in coma and neurologic disorders, appearing as a general modality of arousal organisation. Within NREM sleep, the fluctuations of CAP alternate with sustained homogeneous EEG patterns, characterised by a greater stability of arousal and so-called non-CAP (NCAP) (Terzano et al. 1988, Terzano et al. 2000).
2.1.1. The Role of Light
In humans, the circadian rhythm for the release of melatonin from the pineal gland is closely synchronised with the habitual hours of sleep. Alterations in synchronisation due to phase shifts (resulting from transmeridian airline flights across time zones or unusual working hours) or blindness are correlated with sleep disturbances. Ingestion of melatonin affects sleep propensity (the speed of falling asleep), as well as the duration and quality of sleep, and has hypnotic effects (Brzezinski 1997).
Bright light and ingestion of melatonin may alter the normal circadian rhythm of melatonin secretion, but the reports on this effect are inconsistent, probably because of variations in the timing of the exposure to bright light or the administration of melatonin in relation to the light-dark cycle. The onset of nocturnal melatonin secretion begins earlier when subjects are exposed to bright light in the morning and later when they are exposed to bright light in the evening. The administration of melatonin in the early evening results in an earlier increase in endogenous night time secretion (Brzezinski 1997).
Abnormal circadian rhythms have been implicated in affective disorders, particularly in those characterised by diurnal or seasonal patterns, such as endogenous depression and seasonal affective disorder (winter depression). Low night-time serum melatonin concentrations have been reported in patients with depression, and patients with seasonal affective disorder have phase-delayed melatonin secretion. Although bright-light therapy reduced the depression scores of such patients in one study, a direct association with the phase-shifting effect of light on melatonin secretion was not substantiated (Brzezinski 1997).
2.2. Sleep Disorders
The ICSD divides sleep disorders into eight categories (AASM 2005):
Insomnias: difficulty falling asleep, difficulty staying asleep, early awakening or poor sleep quality.
Sleep related breathing disorders.
Hypersomnias of central origin not due to a circadian rhythm sleep disorder, sleep related breathing disorder or other cause of disturbed nocturnal sleep.
Circadian rhythm sleep disorders.
Parasomnias: disorders that intrude into the sleep process and are manifestations of central nervous system activation.
Sleep related movement disorders.
Isolated symptoms, apparent normal variants and unresolved issues.
Other sleep disorders.
Hossain & Shapiro (2002) divide sleep disorders according to three major symptoms: 1) insomnia or difficulty initiating or maintaining sleep; 2) hypersomnia or excessive sleepiness; and 3) parasomnia or abnormal events during sleep. The authors found that approximately 35–40% of the US adult population have problems with falling asleep or daytime sleepiness annually, based on a self-reported survey. In addition, 20% of the general population in the US have had a serious problem with insomnia. Psychological disturbances, psychiatric problems, divorce, advancing age, poverty, unemployment, cigarette smoking, and drug and alcohol abuse are all factors which increase the risk of insomnia. Excessive daytime sleepiness (EDS) and fatigue have been shown to be the second largest group of sleep disorders, with approximately 5% of the US adult population complaining of EDS. The problem with fatigue, sleepiness and lethargy is that there are no clear objective metrics to distinguish between these three commonly occurring symptoms. It has been suggested that fatigue contributes to poor work performance, personal injury and disability, and is a symptom in conditions as diverse as multiple sclerosis and cancer, as well as sleep disorders (Shapiro 1998). Hossain & Shapiro (2002) studied a variety of sleep disorders which have fatigue as a symptom:
Sleep-related breathing disorders: This is a group of conditions that may be associated with alterations in the structure of sleep, in sleep quality and in gas exchange during sleep (Iber 2005), and includes chronic snoring, upper airway resistance syndrome (UARS), obstructive sleep apnoea (OSA) and obesity hypoventilation syndrome (OHS). OSA is the most common of these disorders, affecting 4% of middle-aged US males and 2% of middle-aged US females (Young et al. 1993). This condition has non-specific symptoms and causes chronic sleep disruption. An estimated 80–90% of the US adult population with OSA are undiagnosed (Young et al. 1997) due to lack of self-referral or physician awareness. A detailed description of the physiology of OSA can be found in Pepperell et al. (2002).
Restless leg syndrome: This is a neurological disorder and causes an irresistible urge to move the legs to relieve an uncomfortable sensation deep within the legs (Earley 2003). This appears to be an age-related disorder affecting approximately 5% of 30–50 year olds; 30% of people over 50 and 45% of people over 65 in the US.
-
Circadian rhythm disorders (CRDs): These are disruptions of the circadian time-keeping system that regulates the (approximately) 24 h cycle of biological processes. (The circadian pacemaker in humans is located mainly in the suprachiasmatic nucleus, which is a group of cells located in the hypothalamus.) Circadian rhythms are important in determining sleeping patterns and can be (non-pathologically) disturbed by shift work, time zone changes (jet-lag), medications and changes in routine. As such, CRDs can be subdivided into
-
–Shift work sleep disorder (SWSD): People who frequently rotate shifts or work at night receive light stimulation at the wrong time (relative to their behavioural patterns) and therefore find sleeping more difficult. Approximately 25% of the US population is involved in shift work, and so it is likely that these disorders have an impact on a healthcare system.
-
–Jet lag or rapid time zone change syndrome: Similar to SWSD, jet lag causes an individual to be awake at inappropriate times relative to their body clock (until light exposure eventually resets it). This syndrome consists of symptoms including insomnia, excessive sleepiness and a lack of daytime alertness in people who travel across time zones.
-
–Delayed sleep phase syndrome (DSPS): This is a disorder of sleep timing and environmental timing. People with DSPS tend to fall asleep at very late times and have difficulty waking up in time for work, school, or social engagements.
-
–Advanced sleep phase syndrome (ASPS): In this disorder the majority of sleep is advanced in relation to the desired clock time. This syndrome results in symptoms of evening sleepiness, an early sleep onset, and waking up earlier than desired.
-
–Non 24 hour sleep wake disorder: This condition is indicative of an individual experiencing an abnormal sleep pattern where their sleep onset is delayed, i.e., they go to bed and rise a bit later each day. This delay is independent of the light-dark environment. They do not follow a 24 h day and so cannot follow the earth’s light-dark cycle. Throughout time the person’s sleep cycle will be affected by inconsistent insomnia that occurs at different times each night.
The variety of CRDs are further discussed in (Sack et al. 2007a, Sack et al. 2007b).
-
–
Narcolepsy: This is characterised by excessive daytime sleepiness and abnormal rapid eye movement (REM) sleep (Mignot 1998), and affects 0.03–0.16% of the US population.
Psychiatric disorders: There is a three- to four-fold increase in psychiatric disorders in patients with sleep disruption (Ohayon et al. 1997). Foster et al. (Wulff et al. 2012, Wulff et al. 2010, Foster & Wulff 2005) have written detailed papers regarding the connections between sleep, circadian rhythm problems and psychiatric disorders.
Alcohol abuse-related: Approximately 10% of the US adult population abuse alcohol, which can cause sleep fragmentation and aggravate other coexisting or underlying sleep disorders (Hossain & Shapiro 2002).
Parasomnias: These are disruptive sleep-related disorders that can occur during arousals from REM sleep or partial arousals from Non-REM (NREM) sleep (see section 2.1). Parasomnias include nightmares, night terrors, enuresis nocturna†, bruxism‡, sleepwalking, confusional arousals, and many others which have been described in (Schenck et al. 1996, Mahowald et al. 1996). About 50% of adults have occasional nightmares, although these events are particularly common in children with 10–50% of US 3–5 year olds experiencing nightmares; up to 15% sleepwalk; and 30% of 4 year olds experience sleep enuresis, although this condition may also be seen in older children (Hossain & Shapiro 2002). 5.3% of adults experience sleeptalking and 2.5% experience sleepwalking according to a study carried out in the Los Angeles area (Bixler et al. 1979), while 1.9% of adults in Hong Kong have enuresis nocturna (Yeung et al. 2004).
Hossain & Shapiro (2002) also estimated both the financial and wider costs incurred by society due to sleep disorders (see Table 1). The authors found that the direct financial costs of insomnia were $13.9bn in 1995 in the USA and $2bn in France for the same period, including medication and health care services. Furthermore, an estimated $84m is spent annually on over the counter sleep aids and a further $700m on hospital visits in each country. There are no data available on the direct costs of EDS; however, the authors estimated it to be billions of dollars in the US.
Table 1.
The economic costs of sleep disorders. Adapted from Hossain & Shapiro (2002).
| Direct Costs | Indirect Costs | Related Costs | Intangible Costs |
|---|---|---|---|
|
|
|
|
Indirect costs cover ambulatory care, absenteeism, disability, reduction or loss of productivity, industrial and motor vehicle accidents, hospitalisation, increased medical costs, and increased alcohol consumption. Stoller (1994) estimated that reduced productivity cost the US $41.1bn annually. An estimated $574.6m is spent annually on alcohol as a sleep aid in the US in 1995 (Hossain & Shapiro 2002). Fatigue plays a huge part in industrial and motor vehicle accidents. According to Aldrich (1989), people with sleep disorders are 1.5–4 times more likely to be involved in accidents.
Related costs are difficult to determine as they involve property damage costs, travel costs, general errors at work, and costs of other medical conditions resulting from the sleep disorder. Intangible costs such as grief, pain and suffering, cannot be quantified financially but are important in determining the effects of sleep disorders (Hossain & Shapiro 2002).
In 2002, a study was carried out by Soldatos et al. (2005) which determined differences regarding the prevalence and type of sleep disorders in different countries. Participants were provided with a standardised questionnaire, and graded with the Athens Insomnia Scale (AIS) (Soldatos et al. 2000) and the Epworth Sleepiness Scale (ESS) (Johns 1991). The 35,327 subjects in the study were adults from 10 different countries. The results were as follows: 24% did not sleep well; 31.6% had ‘insomnia’ (using the AIS); an additional 17.5% may have ‘sub-threshold insomnia’; while a further 11.6% were either ‘very sleepy’ or ‘dangerously sleepy’ during the day (using the ESS). The report concluded that sleep problems may even be underestimated in the general population. However, overall sleep habits and total sleep durations were similar around the world although bedtimes and waking times were different.
2.3. Categorical Surveys and Demographics
Questionnaires are commonly used as a first screening layer for sleep disorders, for example the ESS (Johns 1991), the Berlin Questionnaire (BQ) (Netzer et al. 1999), or the STOP BANG Questionnaire† (Chung et al. 2008). All scales have demonstrated variable results.
The ESS (Johns 1991) is a clinical tool used for assessing daytime sleepiness. The maximum ESS is 24. ESS < 11, 11 < ESS < 14, 15 < ESS < 18 and ESS > 18 are classified as normal, mild subjective daytime sleepiness, moderate subjective daytime sleepiness and severe subjective daytime sleepiness respectively (Parkes et al. 1998). The association between ESS and OSA severity has been demonstrated to be relatively weak (Kingshott et al. 1998, Network 2003). Ahmadi et al. (2008) obtained the results from the BQ on 130 sleep clinic patients and reported 62% sensitivity (SN) and 43% specificity (SP) at the RDI† > 10 level obtained from full PSG. The authors concluded that the BQ was not an appropriate instrument for identifying patients with sleep apnoea in a sleep clinic population (Ahmadi et al. 2008). Chung et al. (2008) developed the STOP BANG questionnaire for OSA screening in surgical patients (i.e., patients about to undergo any surgical operation). Undiagnosed OSA in surgical patients can have a serious impact on postoperative outcomes. Identifying patients with a high risk of OSA can help to prevent adverse health events and perioperative outcomes. This questionnaire requires information on snoring, tiredness during the day, existence of observed apnoea, high blood pressure (BP), body mass index (BMI)‡, age, neck circumference and gender. The STOP BANG questionnaire was completed by 2,974 patients in the preoperative clinics of Toronto Western Hospital and Mount Sinai Hospital, Toronto, Ontario, Canada. Of all patients who were invited, 211 patients agreed to undergo polysomnography, 34 for the pilot study test and 177 for validation. Respective SN of 83.6%, 92.9% and 100% with corresponding SP of 56.4%, 43% and 37% were found for Apnoea Hypopnoea Indexes (AHIs, the average number of apnoeas and hypopnoeas per hour) greater than 5, 15, and 30. The Calgary Sleep Apnea Quality of Life Index, also called the Flemons questionnaire (Flemons & Reimer 1998), is a non-clinical questionnaire that evaluates health-related quality of life in patients with sleep apnoea. The AIS consists of eight questions relating to difficulty falling asleep, problems with awakening during the night, early awakening, sleep duration, overall sleep quality and assessing how well you function during the day (Soldatos et al. 2000). Soldatos et al. (2003) had the AIS completed by 299 subjects and found that it predicted the likelihood of having insomnia with 93% SN and 85% SP.
Demographics have also been used to screen/predict OSA, including age, gender, height and weight. Stradling & Crosby (1991) found that neck size (r2 = 7.9%, p < 0.0001) and alcohol consumption (r2 = 3.7%, p < 0.0001) correlated best with OSA, and less well with age (r2 = 1%, p = 0.009) and general obesity (r2 = 1%, p = 0.01). Chung et al. developed the STOP BANG questionnaire in two stages: firstly looking at STOP and then seeing the improvement that could be obtained by including demographic information. The authors found that SN (SP) went from 65.6% (60.0%) to 83.6% (56.4%) when demographics were included for an AHI > 5, indicating that demographics may be useful. It unclear whether demographics improve OSA diagnosis which may be because subjects are asked to fill in the information themselves, and could therefore be reporting inaccurate figures.
2.4. Sleep Apnoea
Between 1960 and 1980 sleep apnoea syndrome (SAS) was identified and classified (Dalmasso & Prota 1996), with a detailed paper written in 1976 by Guilleminault et al. (1976). This is when the terms SAS and OSA first appeared. Guilleminault et al. (1976) defined an apnoea as the cessation of airflow at the nose and mouth lasting at least 10 s and SAS is diagnosed when at least 30 apnoeic episodes are observed in both REM and NREM sleep over a seven-hour period. A hypopnoea is defined as reduced airflow for at least 10 s and a fall in oxygen saturation (SpO2) of at least 4%. Now, the ICSD defines Obstructive Sleep Apnoea Syndrome (OSAS) as the combination of an AHI of at least 5 per hour combined with EDS (Pevernagie et al. 2010). There are two forms of SAS: central sleep apnoea (CSA) and OSA with the latter being more common (Thalhofer & Dorow 1997), although a subject can experience both OSA and CSA throughout the night. According to Thalhofer & Dorow (1997) CSA is characterised by repeated apnoeas during sleep resulting from loss of respiratory effort.
OSA has been shown to increase the risk of motor vehicle accidents, hypertension and possibly stroke and heart failure (Antic et al. 2009) and is prevalent around the world (Table 2). The three most common symptoms of OSA are excessive sleepiness, impaired concentration and snoring and certain factors (increasing age, male gender, obesity, sedative drugs, smoking and alcohol consumption) increase the likelihood of apnoeas and hypopnoeas (Network 2003).
Table 2.
Prevalence of OSA around the world, m=male, f=female, N/A=not applicable.
| Study | Location | Ethnicity | Gender | Age (years) |
OSA rate (%) |
|---|---|---|---|---|---|
| Bearpark et al. (1995) | Australia | Caucasian | m | 40–65 | 3 |
| Bixler et al. (2001) | USA | Caucasian | m, f | 20–100 | 3.9 (m) 1.2 (f) |
| Ip et al. (2001) | Hong Kong | Chinese | m | 30–60 | 4.1 |
| Ip et al. (2004) | Hong Kong | Chinese | f | 30–60 | 2.1 |
| Kim et al. (2004) | Korea | Korean | m, f | 40–69 | 4.5 (m) 3.2(f) |
| Lam et al. (2007) | Asia | Asian | m, f | middle aged |
4.1–7.5 (m) 2.1–3.2 (f) |
| Sharma et al. (2006) | India | Indian | m, f | N/A | 4.9 (m) 2.1 (f) |
| Udwadia et al. (2004) | India | Indian | m | 25–65 | 7.5 |
| Young et al. (1993) | USA | Caucasian | m, f | 30–60 | 4 (m) 2 (f) |
2.4.1. Background Physiology
OSA is characterised by periods of breathing cessation (apnoea) and periods of reduced breathing effort (hypopnoea) during sleep due to the complete or partial collapse of the upper airway (UA). This leads to deoxygenation (as there is no air going into the lungs, the arterial oxygen levels drop and carbon dioxide levels rise) and consequent arousals caused by a surge of sympathetic nervous system activity. The UA lacks rigid support and contains a collapsible portion that extends form the hard palate to the larynx which allows for functions such as speech, swallowing (food/drink), and breathing. The ability of the UA to change shape is extremely important, but it also means that collapse can occur when undesired. A narrow UA is generally more prone to collapse than a larger one. Imaging confirm that OSA patients generally have a narrower UA than those without OSA. The way the surrounding soft tissues are arranged appears to be altered in OSA patients which may facilitate UA collapse. There is also increased closing pressure in OSA patients compared with control subjects. Overall, patients with OSA have an anatomic compromise which makes them more susceptible to pharyngeal collapse during sleep (Eckert & Malhotra 2008).
Respiration during sleep is different to respiration while awake. McNicholas (1997) found that the overall trend is a reduction in ventilation during sleep compared to wakefulness. Snoring is an obvious respiratory disorder that occurs during sleep. It is a common ailment, affecting approximately 20 – 40% of the general population. The ICSD defines primary snoring as “loud upper airway breathing sounds in sleep, without episodes of apnoea or hypoventilation” (Thorpy 1990). Regardless of the definition used, snoring remains a subjective phenomenon. Snoring is produced when the structures of the upper airway vibrate. Any membranous part of the airway lacking cartilaginous support may vibrate. This diffuse involvement of the upper airway makes snoring difficult to treat, as well as making theoretical models very complex. The spectral characteristics of snoring depend on the properties of the segment responsible for the generation of snoring. Snoring may be produced at several sites along the airway, and sometimes at multiple sites simultaneously, so the power spectrum of snoring is wide, encompassing frequencies up to 10,000 Hz. The spectral characteristics of snoring depend on the route of breathing, stage of sleep, posture, weight, airway wall mass and elasticity, and other factors affecting upper airway properties (Kryger et al. 2000). It is now known that snoring is an audible sign of increased upper airway resistance and is a clinical hallmark of OSA (Thorpy 1990, Network 2003), although there is no data giving the percentage of OSA patients who snore. Pevernagie et al. (2010) postulate that acoustic analysis of snoring will enable discrimination between ‘simple snorers’ and patients with OSA.
Cheyne-Stokes respiration, or the apnoea-respiration cycle, occurs when breathing is characterised by rhythmic waxing and waning of the depth of respiration; the patient breathes deeply for a short time and then breathes very slightly or stops breathing altogether. The pattern occurs over and over, every 45 s to 3 min (Dorland 2003).
2.4.2. Current Diagnostics
A PSG is the main tool used currently to diagnose sleep disorders, and usually involves recording the electroencephalogram (EEG), the electrooculogram (EOG), the electromyogram (EMG), the electrocardiogram (ECG), air flow, thoracic and abdominal movements, and oximetry. Other parameters that may be monitored include body position, video and audio surveillance. As well as all of the specialised equipment, a trained technician is required to attach the sensors in the correct positions. There are controversies surrounding the efficacy of sleep labs; it is thought that patients in a sleep lab do not sleep as well as they do at home. However, such claims have been questioned by Portier et al. (2000), who provided evidence that sleep architecture and evaluation of sleep quality were no different between either home or lab setting.
Flemons et al. (2004) focused on determining the wait time for diagnosis and treatment in five different countries (Table 3). The authors postulated that the wait times resulted from the limited beds available for sleep studies in each country, as well as a lack of sleep specialists to score the data.
Table 3.
Wait time for diagnosis and treatment with Continuous Positive Airway Pressure in five different countries (Flemons et al. 2004).
| Country | Wait time (months) |
| United Kingdom | 7–60 |
| Belgium | 2 |
| Australia | 3–16 |
| United States | 2–10 |
| Canada | 4–36 |
The cost of monitoring a person overnight, the scarcity of beds available and the uncertainty of whether the results are representative of a normal nights’ sleep means that a move to home diagnostics is likely to be advantageous.
2.4.3. Treatments for Sleep Apnoea
The available treatments for OSA can be categorised as follows (Guilleminault & Abad 2004):
Diet and lifestyle: losing weight, avoiding tobacco, alcohol and sleeping tablets, and modifying the usual sleeping body position can all aid in reducing the number of apnoea and hypopnoea events that occur throughout the night.
Pharmacological treatments: avoiding benzodiazepines and barbiturates in particular, and minimising the use of narcotics in general, will help as they worsen apnoeas, hypopnoeas and UA functionality. Some research has been carried out with limited success on drug treatments which stimulate the neurotransmitters which contract the UA dilator muscles in an effort to maintain UA patency (Hanzel et al. 1991, Smith & Quinnell 2004, Heinzer et al. 2008).
Therapeutic devices: these are oral appliances that physically modify the UA whilst being worn. They are usually mandibular advancement devices (MAD) or tongue trusses which hold the lower jaw and tongue forward. The efficacy of oral appliances (OAs) in the treatment of OSA is questionable as, on average, only 52% of patients treated with OAs had some success in controlling OSA. Effects on sleepiness and quality of life were demonstrated but improvement in other neurocognitive outcomes were not consistent (Ferguson et al. 2006). Tongue retaining devices (TRDs) are another possibility which were originally designed to combat snoring. They are mouthpieces which are worn while asleep fitting over both upper and lower dental arches with a compartment to hold the tongue in a forward position by suction. Cartwright et al. (1988) found that TRDs can improve nocturnal respiration for a wide range of apnoea severity, provided that the disorder is more severe in the supine position and that the body weight is not greater than 50% above the ideal. Although these devices have been shown to be effective, patient tolerance of the device has appeared to be lower than MAD (McGown et al. 2001). This might explain why they are prescribed so infrequently (Hoffstein 2007).
Surgery: there are a number of options for surgery on the upper airway. The area to be operated on depends on where the obstruction occurs in the individual patient. Some of the surgical treatments available include: nasal reconstruction - to improve normal respiration; tonsillectomy and adenoidectomy - usually used for children with OSA in order to enlarge the nasal inferior turbinates; mandibular osteotomy with genioglossus advancement - to enlarge the retrolingual (posterior to the tongue) airway.
Assistive devices: Positive airway pressure devices are the most commonly used therapy for OSA and include continuous positive airway pressure (CPAP), bilevel positive airway pressure (BiPAP) and autopositive airway pressure (APAP). A device like an oxygen mask is worn over the mouth and/or nose and pressurised air if forced down the airway thereby keeping it open. They are extremely effective when used correctly; however, approximately 30–35% of patients are intolerant or non-compliant due to the side effects of use, which include skin abrasions, bruising, chaffing from the mask, nasal congestion or dryness, abdominal cramping (Guilleminault & Abad 2004).
Electrical stimulation: Electrical stimulation of the lingual musculature is another form of treatment. Fine wire electrodes are implanted into either the genioglossus or the hypoglossal nerve. By stimulating the nerves, UA patency is improved and it is possible to maintain airflow without arousing patients from sleep (Oliven et al. 2003, Schwartz et al. 1996, Oliven et al. 2001).
The list above comprises typical treatments available to sufferers of OSA in the developed world. Although the same treatments can also be used in developing countries, cost considerations and supply infrastructure limitations severely restrict their availability. Lam et al. (2007) conclude that while CPAP is available in many parts of Asia it may not be a financially viable option. They also suggest that OAs may be a more suitable treatment as it is likely that there are more modifiable factors in the craniofacial structure of Asian patients.
3. Monitoring Modalities
In 1994, the AASM published a classification scheme that categorised out-of-centre sleep monitors into four types: (1) standard attended PSG; (2) comprehensive portable PSG (unattended); (3) modified portable sleep apnoea testing (unattended, minimum of four channels including ventilation, HR or ECG, and SpO2); and (4) continuous single or dual bioparameter recording (unattended) (Ferber et al. 1994). Since then, continuous technological advances have produced monitoring systems which do not fit in these four categories, and new classification schemes have been proposed (Collop et al. 2011). Traditional modalities included in PSG systems include EEG, oximetry, cardiovascular measures and respiration. Non-traditional modalities, such as audio, actigraphy, video or temperature, are receiving increasing interest due to their potential utility for reduced PSG systems and home sleep monitors.
3.1. Non-cardiac Electropotentials
The traditional recording of EEG information for sleep analysis is through the standard 10–20 system, which describes the method and application of scalp electrodes (Niedermeyer & Da Silva 2005). The method was designed to ensure standardisation and reproducibility on an inter- and intra-subject basis. The 10–20 system is based on the relationship between the location of an electrode and the underlying area of cerebral cortex†. The frequency content of the EEG, relevant to sleep, is mostly in the 0–12 Hz region. However, it is typical to record the EEG and other electrical signals at 100–500 Hz. Since the signals are in the microvolt range, relatively high quality amplifiers and good quality analogue-to-digital converters with wide dynamic ranges (16–24 bit) are required. In general, EOG is used to identify eye movements and EMG is used to identify the drop in muscle tone seen during REM sleep.
3.2. Oximetry
Monitoring of peripheral oxygen saturation (SpO2) allows for the identification of drops in oxygen supply during respiratory-related events, such as apnoeas. SpO2 is most commonly measured by using pulse oximetry, which is said to represent one of the most important technological advances in patient monitoring in the last decades (Webster 1997). Pulse oximetry is based on the PPG, which is an optical measurement technique that can be used to detect blood volume changes in the microvascular bed of tissue (Challoner 1979). An excellent review on photoplethysmography and its clinical uses can be found in Allen (2007).
The PPG waveform comprises two components: a pulsatile (‘AC’) physiological waveform (commonly referred to as PPG signal), which reflects cardiac synchronous changes in the blood volume with every heart beat, and a slowly varying (‘DC’) component that relates to the tissues and to the average blood volume. Variations in the DC component are due to respiration, vasomotor activity and vasoconstrictor waves, among other causes. Pulse oximeters use electronic filtering and amplification to separate the AC and DC components for estimating the peripheral SpO2 and for extracting the PPG signal. Figure 1 presents synchronous excerpts of physiological signals during an apnoeic event, including SpO2 and PPG.
Figure 1.

Excerpt of synchronous oxygen saturation (SpO2), heart rate (HR), electrocardiogram (ECG), photoplethysmogram (PPG) and impedance pneumogram (IP) tracings during an apnoeic event from a neonatal subject from the MIMIC II database (Saeed et al. 2011, Goldberger et al. 2000b). A cessation of respiration can be observed in IP at t = 10 s, followed by bradycardia (drop in HR) around 20 s later and by an abrupt drop in oxygen saturation starting around t = 36 s.
The PPG waveform can be severely corrupted by artefacts, noise and missing values, which would produce erroneous SpO2 readings, leading to false desaturation alarms. Additionally, the pulsatile component of the PPG waveform is highly susceptible to motion artefacts. Different ways to address these problems are described in section 4.3.
3.3. Cardiovascular Measures
HR is an important physiological parameter to measure for sleep monitoring. Episodes of OSA are accompanied by a characteristic HR pattern consisting of bradycardia during apnoea followed by abrupt tachycardia on its cessation (Guilleminault et al. 1984), which can be used to detect OSA. HR can be derived directly from the ECG, or indirectly from other physiological waveforms, such as the PPG signal (Allen 2007).
Arterial BP is another important clinical parameter to track during sleep. The standard method for automated BP measurement is oscillometry. Oscillometric devices use a cuff with a pressure sensor. The cuff is inflated to a pressure in excess of the systolic arterial pressure, and then the pressure reduces to below diastolic pressure. Once the blood flow is present, but restricted, the cuff pressure varies in synchrony with the cyclic expansion and contraction of the blood vessel. The values of systolic and diastolic pressure are then computed from the sensor readings. However, since oscillometric BP measurement involves temporary constriction of blood supply to an arm (or leg), it is deemed unsuitable for use in sleep because it can arouse the patient. Therefore, non-invasive approaches have been proposed for BP monitoring in sleep studies, since surrogate measures of BP can be obtained from ECG and PPG signals (see section 4.4). Commercial equipments such as Finapres™ (no longer commercially available), the Portapres and Finometer systems (Finapres Medical Systems BV, Holland), and the Task Force Monitor system (CNSystems Medizintechnik, GmbH) are less disturbing than oscillometric devices, but can still be uncomfortable for the patients.
Arousals from sleep are associated with increased sympathetic activation, which produces peripheral vasoconstriction. Autonomic arousals or central nervous activations can thus be recognised by means of peripheral arterial tonometry (PAT) (Schnall et al. 1999). The PAT signal is measured with a finger plethysmograph coupled to a constant volume, variable pressure, pneumatic system, which records pulsatile volume changes in the finger tip (Schnall et al. 1999). The PAT signal reflects the vascular tone at the finger which is influenced by BP, peripheral vascular resistance, blood volume in the finger, and activation of the autonomic nervous system, and therefore can serve as a single non-invasive correlate for sympathetic activity (Penzel et al. 2004).
3.4. Respiration
A common method to detect breathing events during sleep is by detecting reductions in airflow or tidal volume. Pneumotachography and body plethysmography have traditionally been considered the gold standards for assessment of these measures. In the case of pneumotachography, the patient’s nose and mouth must be covered (leak free) by a face mask with a pneumotachometer attached to it, which can be obtrusive and cumbersome and may not be tolerated by the patient (AARC-APT 1995). During body plethysmography, the patient must be enclosed in a chamber equipped to measure pressure, flow, or volume changes. Therefore, neither technique is suitable for routine PSG (Redline et al. 2007).
Alternative methods to measure airflow include thermistors and nasal cannula pressure transducers. Thermistors measure temperature differences. As the subject breathes, cooler ambient air is inspired from the room and passes the thermistor, which is typically placed near the subject’s nose and/or mouth. On expiration, the subject’s breath is warmer than ambient. The thermistor therefore produces a sinusoidal wave representing inspiration and expiration, but there is no direct correlation between the amount of air inspired and the size of the waveform. These sensors are commonly included as a component of PSG and are recognised as a reliable method to detect complete airflow cessation, but, since they do not provide quantitative measures of airflow, they are not adequate to detect hypopnoeas. On the other hand, nasal pressure transducers provide a linear approximation of airflow, but it may be not as accurate in distinguishing an apnoea from a hypopnoea (Flemons et al. 2003).
Respiratory inductance plethysmography (RIP) measures the changes in thoracic cross-sectional area to provide an indirect measure of ventilation. An approximate measure of the cross-sectional area is obtained by measuring the self-inductance of elastic belts containing insulated wires which are wrapped around the abdomen (Cohn et al. 1982). In this way, RIP can provide a measure of tidal volume when it is calibrated to a known volume measure. RIP is considered appropriate for obtaining both qualitative and quantitative indices of breath volume, including identification of the time components of the respiratory cycle (Flemons et al. 2003).
Another way of measuring respiratory effort is by impedance pneumography (IP), which is based on the principle that volume changes within an induced electrical field are accompanied by changes in electrical resistance. IP monitors insert a high-frequency, low-amperage current through electrodes placed on the chest of the patient, and then the small changes in electrical resistance accompanying each breath are measured electronically (Stein & Shannon 1975). An advantage of IP is that the same electrodes can be used for recording the ECG signal, so electrodes are usually placed on standard ECG locations. Nevertheless, electrode configurations for IP are still subject to research (Seppa et al. 2010). An example of IP signal during an apnoeic event can be observed in Figure 1.
Respiratory effort can also be measured with alternative methods such as chestwall and abdominal movement via strain gauges, piezoelectric belts, inductance pneumography, endoesophageal pressure, or by intercostal EMG (AARC-APT 1995, Folke et al. 2003).
3.5. Audio
Audio recording is a useful method for monitoring sleep as it is inexpensive and does not disturb the natural sleep environment as the microphone does not need to touch the subject. Audio recordings are used to identify snoring, normal breathing or obstructive events (see Figure 2).
Figure 2.

Excerpt of audio for an apnoeic patient over 4 min. There are corresponding reductions in airflow, changes in HR and PPG as well as oxygen desaturations that are out of phase with the cessation of breathing. AU = arbitrary units.
Although there are no data available regarding the prevalence of snoring in the OSA population, it is common enough to be considered a common symptom of the disorder (Thorpy 1990, Eckert & Malhotra 2008). It is likely that analysing snoring will be helpful in identifying subjects with OSA. The analysis of snoring sounds involves the use of speech analysis techniques. Similar to the production of speech, snoring can be seen as the conversion of an air-stream to audible sound which is modified by the upper airway. In speech, in order to generate different phonemes (the elements of speech), the vocal tract changes shape. These changes occur relatively slowly compared to the detailed time variation of the speech signal. The sounds created in the vocal tract are shaped in the frequency domain by the frequency response of the vocal tract. This process can be modelled using the source-filter model (Titze 2000). This separates the initial source at the glottis and interprets the vocal tract as a filter which acts upon the original source. The major assumption is that the source and filter are independent of each other, which has been shown to be untrue by recent studies (Titze & Story 1997).
3.6. Body Movement
3.6.1. Actigraphy
Accelerometry, also called actigraphy or actimetry, is an inexpensive, non-invasive and easy-to-use modality, often used for sleep and circadian research. Actigraphy measures movements, typically with piezo-electric wearable sensors, and then extracts information regarding periods of sleep and wake from those movements. A simplified view of actigraphic sleep-wake segmentation is based on assumption of scoring non-movement episodes as sleep and movement as wake (see Figure 3); although many algorithms have been developed to distinguish wake from sleep using the rest-activity pattern from actigraphy. Plotting the rest-activity patterns as in Figure 4 allows for the visualisation of different disorders, in this case the subject experiences early morning awakenings. Actigraphy gained a central role as a tool for long-term sleep monitoring, despite relatively low (< 50% (Paquet et al. 2007)) specificity in detecting wakefulness in certain experimental conditions, compared to standard PSG sleep analysis (Sadeh 2011): although actigraphy is complimentary to PSG as it can record movements over 24 h for extended periods. Use of actigraphy may be preferred to PSG in situations where long-term sleep/wake monitoring is required as compliance with PSG is low, or in some special cases, for example in infants under one year, when EEG patterns are not yet stable (So et al. 2007). Established areas of actigraphy usage include:
Sleep-wake segmentation and sleep analysis derived from physical activity
Circadian rhythms analysis
Analysis of physical activity in the context of sports and rehabilitation
Figure 3.

Excerpt of body movement over the course of three days, with corresponding light levels.
Figure 4.

Simultaneous rest-activity and ambient light exposure (yellow, in lux) patterns derived from 3 weeks wrist activity monitoring of a 35 year old woman during ordinary home/work conditions. The actogram shows clear entrainment to the day-night cycle but with early morning awakenings. Actigraphic data are 48-hour double plotted with successive days on vertical axis. Activity recorded with a 1-minute epoch using Actiwatch-L with integrated light sensor. (unpublished data of K. Wulff)
3.6.2. Body position
OSA severity is known to vary with sleep position and the estimated severity will vary depending on the accuracy with which sleep time can be estimated (Collop et al. 2007). Body position can be measured using an accelerometer, at the same time as recording body movements.
3.7. Video
Video recording is a powerful non-contact method for monitoring sleep in adults and children as it is relatively cheap and does not disturb the natural sleep environment. Video recordings have been widely used to correlate PSG signals with patient’s sleeping behaviour and respiratory and body movements in sleep (Anders & Sostek 1976, Griffiths et al. 1991, Sivan et al. 1996, Banno & Kryger 2005, Silvestri et al. 2009). Simpler PSG systems including video recording with or without recordings of a number of physiological signals have been proposed for low cost portable/home sleep screening (Sivan et al. 1996). In recent years, video recordings have been used to automatically detect and monitor respiratory movements and body position during sleep with the aim of aiding the diagnosis of sleep disturbances or assisting the evaluation of quality of sleep (Nakai et al. 2000, Nakajima et al. 2001, Wang et al. 2006, Liao & Yang 2008, Liao & Kuo 2011). Video analysis for body position is quite rare, although it is often a preferred clinical tool. It is particularly useful as a gold standard for assessing if a suspected apnoeic event was real or not, and for identifying body position at any given point in the recording. Limb movement is also relatively easy to detect. One caveat, however, is that a subject is often under bed covers, and so much of the body can be obscured. Moreover, the recording environment has extremely low light levels in general and therefore infrared lights and infra-red-sensitive cameras are usually employed, together with patterned bed sheets (Wang et al. 2007).
3.8. Temperature
Human body thermoregulation is well known to be regulated by the circadian system and contribute to the sleep process (Cagnacci et al. 1997, Kräuchi et al. 2006, Kräuchi & Wirz-Justice 2001). There are several indicators of body temperature, in particular core body temperature (CBT), proximal skin temperature (PROX) and distal skin temperature (DIST) linked together within a core-shell thermoregulatory model (Aschoff 1983) and influenced by the hormone melatonin.
CBT is well known to be correlated with the sleep process and circadian system status (the circadian system regulates both CBT and sleep), decreasing during sleep and increasing during arousal (CBT is lowest in the second half of the night and highest the late afternoon). This pattern of CBT regulation does not depend on arousal state and is present during sleep deprivation (Kräuchi & Wirz-Justice 2001). Thus, monitoring of CBT is one method for the evaluation of circadian system status (Cagnacci et al. 1997, Kräuchi et al. 2006, Klerman et al. 2002). However, in estimation of circadian system phase, CBT shows the lowest accuracy compared to cortisol and melatonin data (with standard deviations of 0.78, 0.65 and 0.23–0.35 h respectively) (Klerman et al. 2002); however, when compared to melatonin and cortisol, CBT is coupled most strongly to the pacemaker rhythm if it is measured under constant conditions. CBT is well correlated with PROX, but is in anti-phase with DIST (Cagnacci et al. 1997). However, PROX tends to be significantly affected by the placement of the sensor, physical movement, artefact, ambient temperature and vasomotor activity.
Unlike CBT, DIST increases during the sleep and this effect can be masked by sleep deprivation (Kräuchi & Wirz-Justice 2001). Within the Core-Shell thermoregulatory concept, DIST is linked with heat loss regulation (Aschoff 1983). DIST increase is correlated with decreased sleep onset latency (Kräuchi & Wirz-Justice 2001, Kräuchi et al. 2006), however this finding does not seem to be valid for elderly subjects with sleep problems (Raymann et al. 2007).
In practice, measurements of CBT are both invasive and complicated in the case of long term circadian cycle monitoring. Therefore new measures of the circadian system are introduced, based on multiple factors. Sarabia et al. (2008) suggested the use of wrist skin temperature to evaluate circadian rhythms in normal-living subjects and showed that it is correlated with oral temperature recordings. Although it is possible to find the circadian periods, and hence, determine the phase of this variable; however, wrist skin temperature cannot be used to estimate the circadian rhythmicity and phase of the entire circadian system. Ortiz-Tudela et al. (2010) suggested an integrated variable, based on thermometry, actimetry and body position to reduce individual recording artefacts and showed that it is well correlated with rest-activity logs. Kolodyazhniy et al. (2011) evaluated circadian phase estimation using standard least squares algorithmic regression techniques on skin temperatures, accelerometry and ambient light level in the blue spectral band and showed a statistically significant improvement of variance of prediction error over traditional single predictor methods.
4. Signal Processing
4.1. EEG
As described earlier (in section 2.1), Stages I and II are known as light sleep and III and IV as deep sleep, or SWS. In general, deeper sleep is associated with a shifting of power from higher to lower frequencies (see below) but transient chirp-like phenomena are also present.
For example, the K-complex is a brief negative high-voltage (> 100µV) peak, followed by a slower positive oscillation lasting around 350 to 900 ms, ending in a final negative peak. K-complexes occur† roughly every 1.0 to 1.7 min and are often followed by bursts of sleep spindles. Sleep spindles (sometimes referred to as sigma bands or sigma waves) may reflect the inhibiting of processing to enable the sleeper to remain in an unaroused state. Along with K-complexes, sleep spindles define the onset of stage II sleep.
In general, it is not possible to differentiate wakefulness from REM sleep using the EEG alone, since the spectral and morphological content is highly similar in both states. Therefore, the EOG and EMG are also recorded. The EOG allows the identification of the periodic flicking of the eye muscles during the rapid eye movements of REM sleep. The EMG records the muscle movements as the subject’s muscle tone drops during the same phase of sleep.
As stated earlier, the AASM Visual Scoring Task Force updated the R&K scoring system, and the revised scoring was published in 2007 as The AASM Manual for the Scoring of Sleep and Associated Events (Iber & of Sleep Medicine 2007). The redefined criteria are now:
Stage N1: The transition of the brain from alpha waves (8–13 Hz), which are commonly observed during wakefulness, to theta waves (4–7 Hz). (This stage is also sometimes referred to as somnolence or drowsy sleep.)
Stage N2: is characterised by sleep spindles ranging from 11–16 Hz and K-complexes. Muscular activity and conscious awareness vanishes.
Stage N3: (SWS) is characterised by a minimum of 20% of the epoch duration (30 s) being delta waves (0.5–2 Hz), when exceeding a peak-to-peak amplitude > 75µV.
4.1.1. CAP and NCAP sleep
Although the topic of much debate, CAP is the cyclic alternating pattern, defined by (Terzano et al. 1988, Terzano et al. 2000). They distinguish sleep as phases with CAP and phases without CAP, which they like to call NCAP. The cyclic alternating pattern is defined according to signal content in various types and these types are called phases. It is being used in the sense of ‘epoch’ rather than phase in the sense of offsets in rise times or frequency patterns between two or more oscillators. Each CAP cycle consists of a phase A and a phase B, lasting 2–60 s. All CAP sequences start with a phase A and stop with a phase B. In NREM sleep, the phase A patterns are characterised by single or clustered phasic events, peculiar of each sleep stage (Terzano et al. 1988, Terzano et al. 2000, Ferri et al. 2002):
- During sleep stage 1:
- intermittent alpha rhythms (EEG synchronisation) and
- sequences of vertex sharp waves (EEG synchronisation);
- During sleep stage 2:
- sequences of two or more K-complexes alone (EEG synchronisation) or
- followed by alpha-like components (EEG desynchronisation) and
- beta rhythms (EEG desynchronisation);
- During slow-wave sleep:
- delta bursts (EEG synchronisation) which exceed by at least 1/3 the amplitude of the background activity;
-
During all sleep stages:
- transient activation phases (EEG desynchronisation) and
- EEG arousals (EEG desynchronisation).
The period between two successive A phases separated by an interval longer than 60 s is scored as NCAP (non-CAP).
4.1.2. Issues with manual sleep staging from the EEG
Manual staging is based upon visual inspection of the EEG as well as the EOG and EMG traces. Originally the R&K rules (Rechtschaffen & Kales 1969) recommended dividing the PSG record of sleep into 30 s epochs, commencing at the start of the study. The 30 s interval was chosen because at a paper speed of 10 mm/s, ideal for viewing alpha and spindles, one page equated to 30 s of the recording. A stage was then assigned to each epoch and if two or more stages coexist during a single epoch, the stage comprising the greatest portion of the epoch was used. This introduces significant problems for teaching algorithms to perform automated sleep scoring, since almost 50% of the data used for training can therefore be of the wrong class. (In practice, sleep stages often persist from one epoch to the next, and the number of ‘mixed’ stage epochs is much less than 50%. However, it only takes a small number of mixed stages to substantially affect the training of an automated classifier.)
Inter-rater reliability/agreement has been shown to vary between 0.6 and 0.9 (using Cohen’s κ value† (Crowell et al. 1997, Stepnowsky et al. 2004, Ferri et al. 2005, Rosa et al. 2006). In particular, abnormal conditions can reduce the agreement level. Although this does not always directly impact on the eventual diagnosis, it has a particularly problematic impact on automated classification systems, which can disproportionately weight incorrectly labelled examples during training.
4.1.3. EEG-based automatic sleep staging
Automated sleep analysis has been around for almost thirty years (Crawford 1986). Since an exhaustive review of automated EEG-based sleep staging approaches is outside the scope of this article, we present a brief overview of the general approaches, and some key results and issues.
Automatic sleep staging should follow a number of well-defined steps: artefact rejection; decomposition into background waves and specific patterns (such as vertex waves, sleep spindles, K-complexes); decide whether to mimic sleep stages according to the R&K rules or the new revised classification prepared by the AASM; cluster into sleep stages (a classification task); map the clustered sleep stages to the definitions of visual sleep stages. EEG segments were characterised by a set of parameters. Within the parameter space it was checked whether EEG segments which belong to the same sleep stage would cluster is space. As this was the case, it was possible to define clusters in the parameter space where were specific to a sleep stage. It should be noted that the algorithms used for the different steps may consist of a variety of methods. Finally, the difference between a computer assisted sleep staging and a reference sleep staging cannot be smaller than the difference between different clinicians visually scoring sleep stages. The difference between sleep scorers heavily depends on the training of the scorers. It is likely that scorers attending a common or comparative methods course (such as the AASM Internet based sleep scoring comparison (Penzel et al. 2013)) will have quite similar scoring results, whereas sleep scorers who have no contact or are from different parts of the world will have remarkable differences in scoring.
In general, most approaches to automated sleep analysis using the EEG consist of a feature extraction approach, followed by a classification step. The features are almost always based on frequency domain parameters such as an autoregressive (AR) model (Roberts & Tarassenko 1992), Fourier or bispectral analysis (Wang et al. 2009), or wavelet approaches (Ahmed et al. 2009). Occasionally, time domain features are used instead, or as well, such as entropy (Jiayi et al. 2007). The classifier then takes the features and maps them to one of several classes (such as a sleep stage, or an event such as an apnoea). Numerous classifiers have been used, ranging from neural networks (Roberts & Tarassenko 1992) to support vector machines, K-means clustering approaches (Gudmundsson et al. 2005), and fuzzy logic (Liang et al. 2011). Alternative approaches have included the use of time delay embedding, Kalman filters and Hidden Markov Models (HMMs) (Rossow et al. 2011).
An early, yet successful approach was described by Roberts et al. (Roberts & Tarassenko 1992, Pardey et al. 1996). The approach introduced a neural network-based sleep staging system which gave a probability that the subject was awake, in light sleep or deep sleep every second. The system did not differentiate between REM and NREM sleep and was partially sensitive to the electrode location (although could be trained for any give electrode configuration). Their system was initially assessed on six normal subjects who experienced a wide range of sleep stages and they showed that it was possible to derive an automated hypnogram although they believed that it was not the best format for detailed investigation of the sleep process. The system was later commercialised by Oxford Instruments (Oxford, UK) and then later Oxford Biosignals (Oxford, UK) as the software system BioSleep, and a Holter device, BioSomnia.
Since then, many automated sleep classification algorithms have become commercially available, including QUISI (Axon GmbH, Schmalkalden, Germany), a single channel, self-applicable ambulatory EEG recording device. Fischer et al. (2004) found that the QUISI system gives an impression of sleep architecture and objective verification of a sleep disturbance in an ambulant setting but cannot replace conventional PSG. Both BioSomnia and QUISI used just three electrodes placed on the head, producing a signal that was a mixture of EEG, EOG and EMG. Both systems attempted to split the signal into the different component signals and then derive a sleep parameter. As expected, the systems differ somewhat in their algorithms and thus, the results provided to the user. Rather than providing sleep stages in 30 s epochs, the BioSomnia system presented an almost continuous (1 Hz) sleep depth trace with values between ±1, where +1 indicates a strong probability of being fully awake (or in REM sleep) and −1 indicates a high probability of being in SWS. When comparing the system to R&K sleep staging, stage 1 sleep as well as REM sleep and sometimes even drowsiness can sometimes be observed to have values close to 0. Therefore an approximate time course of the sleep could be discerned, but conventional sleep staging was not possible. (Comparing 30 s epochs with 1 s epochs is non-trivial though.) However, the BioSleep algorithm did produce standard sleep metrics such as TST, sleep offset, sleep efficiency, microarousal indices, etc., allowing for assessment of overall sleep quality. The QUISI system used 12 features based on power spectral analysis (without further information provided by the developers) from the three electrodes attached to the forehead and a neural network (Ehlert et al. 1998). The neural network outputted a seven class sleep hypnogram for each 30 s epoch (movement time, wake, REM, and stages 1 though 4).
The limitations of these machine learning approaches may well be related to the key issues when training a piece of software to reproduce human observations, namely:
Having enough training and testing data (i.e., enough for the required free parameters of the classifier, as well as enough patients to be representative of the population to which the system may be applied), and
Assuming that the new unseen dataset will have similar characteristics to those used in the first place to train the model (often out-of-sample patients exhibit unusual characteristics), the performance on an unseen test set should be similar to a training set. Large differences in performances in folds of a cross-fold validation can indicate that test set performance reduction can be due to a lack of enough representative events in the training data, and that further data collection is required. It may be non-normal subjects exhibit a higher heterogeneity of features relevant to the disease, and therefore larger numbers of non-normal subjects are required to achieve similar classification accuracies as for normal subjects, and
Having a high enough Cohen’s κ coefficient between experts to avoid class confusion when presenting the data to the classifier (since experts often disagree of sleep stage classification and such ambiguities can reduce classifier performance).
In both systems mentioned above, the neural networks were trained and tested on relatively small numbers of patients. Moreover, the number of annotators used to ensure an accurate class label (sleep stage) were low (often only two). This causes two key problems. First, there is a small but non-negligible possibility two annotators can (incorrectly) agree on a class, either through fatigue-related errors, or because the signal is rather difficult to classify. Even small amounts of incorrectly labelled data can lead to large training errors in a non-linear classifier (such as a neural network). The second major issue caused by the low number of experts is that epochs where experts disagree are not used in training and testing. (In general at least three, but often more experts are needed, depending on the number of classes, training of the annotators, their independence and the quality and type of data (Reidsma & Carletta 2008, Artstein & Poesio 2005, Neamatullah et al. 2008).) This leads to a bias in classification accuracy towards epochs that are clear cut in terms of classification, which turns out to be the extreme values of very deep sleep or wakefulness.
The other key issue related to labelling is that temporal majority voting is used in the R&K scoring. This means that almost half the 30 s epoch (14.9 s) can be a different class to the actual label given, and yet still the entire segment is given the same label. (Arousals and micro-arousals, as well as other events may be annotated, but this information is not always made available or used during training.) When training BioSomina/BioSleep the entire segment was used (and broken down into 1 s segments, all with the same label as the epoch from which they were taken), since the intra-segment stage changes are not recorded by the annotator. This is particularly problematic for stages where the signal is less stable, and explains why the lighter stages of sleep are more confusing to the classifier. Classifying an entire epoch, such as in the QUISI system, may therefore make more sense (if trying to completely replicate the human classification approach), although it will still be partially susceptible to the problem of intra-epoch transient stage changes. However, the 30 s epoch was chosen (in the 1960’s) to reduce the human computational burden and break the tasks of reviewing the PSG down into a set of chunks with which a human could cope. Changes in sleep stage happen much more rapidly that this though, and with the appearance of extremely powerful computing, it may make sense to reduce the 30 s epoch in length, although comparability to current clinical norms would be reduced.
Apart from the issues mentioned above, related to the inter-rater agreement levels and coarseness of the temporal resolution of scoring, some of the key issues related to sleep staging include contamination by artefacts (Anderer et al. 1999), and the similarity between wakefulness and REM sleep on the EEG. REM sleep can sometimes be discerned if the EOG and/or EMG is used to identify rapid eye movements and mastication respectively. However, since such activity does not always manifest during REM sleep, it is by no means definitive. Finally, many studies indicate that sleep staging or event classification in pathological subjects (or subjects under the influence of certain medications) is far more difficult that in normals (Jensen et al. 2010, Fraiwan et al. 2011). It should be noted that some progress has been made on abnormal patients. The method of Roberts & Tarassenko (1992) was later extended by Tarassenko et al. (2001) to score the sleep of OSA subjects. It should be noted that there is a lot of sleep fragmentation in patients with OSA which makes any classification task difficult. There is also a lot of movement and sweating artefacts in the EEG in OSA patients. The authors showed that a network trained on normal sleep data could be used to score the sleep of patients with OSA. Although the EEG patterns are the same, there was heavy fragmentation of sleep and the sequence in which the patterns occur is different, with the subject falling into light sleep during the apnoea, then waking up at the cessation of the apnoea. This pattern can repeat many times during the night.
Automated sleep staging algorithms do offer the potential for low-cost screening, with reduced EEG lead sets, and less intensive human training required. However, since most algorithms have not been designed to replicate the clinical sleep stages exactly (partially because of the problems detailed above), there is not a general trust of automated sleep staging in the clinical setting.
Moreover, the variation in automated sleep staging algorithm outputs and sensor placement means that it is hard to validate commercial devices in terms of matching sleep stages. Despite this, several groups have tried. Schweitzer et al. (2004) evaluated BioSomnia in a population of 36 subjects with obstructive sleep apnoea, and an average sleep efficiency of 79%. The authors reported that BioSomnia had a bias of +4.1% for estimation of sleep efficiency compared with PSG, and over-estimated total sleep time by approximately 11 min (3.3%) above the average of 330 min. Caffarel et al. (2006) subsequently showed a per-epoch agreement with expert annotation of κ = 0.47 (overall epoch accuracy of 82.2%) and a bias of +6.9 min for total sleep time in a population of 114 patients with suspected OSA, exhibiting an average sleep efficiency of 77.8%. Fischer et al. (2004) reported on a study on the QUISI system in a mixed population of 40 patients with average sleep efficiency of 91.2%. The QUISI system underestimated total sleep time by 19.2 min, and 4.6% in sleep efficiency. Berthomier et al. (2007) assessed another single-channel EEG device (ASEEGA, Physip, Paris, France) by scoring sleep in 15 healthy volunteers (average sleep efficiency 85.3%), and reported κ=0.82, and an accuracy for sleep stage classification of 96.0%. Wright et al. (2008) studied the now unavailable Zeo (Newton, MA, USA) on 10 normal adults (average sleep efficiencies of 83%) and reported per-epoch classification accuracies of between 88% and 91%. Popovic et al. (2008) analysed a combined single-lead EEG plus a forehead mounted actigraph, with a reported accuracy of 79% and κ = 0.54. This highlights how it is generally easier to classify healthy patients.
4.2. ECG
Analysis of the ECG recorded during sleep is useful for more than simply HR and rhythm measurements. Respiration can be derived from the ECG and respiratory patterns are useful for detecting apnoea and phenotyping sleep sections.
4.2.1. ECG-derived respiration
In general ECG-derived respiration (EDR) can be obtained from two effects. The first method relies on the fact that the cardiac electrical axis changes as the air filling the lungs pushes the heart off axis compared to the electrode positions (Moody et al. 1985, Moody et al. 1986). The general effect is a periodic attenuation of the ECG amplitude (most obviously on the QRS height) in time with respiratory effort.
Another method of calculating EDR relies on a physiological modulation of the HR, or beat-to-beat (RR) interval which can be observed in many patients. The periodic changes in the RR interval manifests as a shortening with inspiration and lengthening with expiration, which generally lags respiratory effort with a variable phase. This phenomenon, known as respiratory sinus arrhythmia (RSA) is partly due to the Bainbridge reflex†, the expansion and contraction of the lungs and the cardiac filling volume caused by variations of intra-thoracic pressure (Guyton & Hall 2001). During inspiration, the pressure within the thorax decreases and venous return increases which stretches the right atrium resulting in a reflex which increases the local HR (i.e., shortens the RR intervals). During expiration, the reverse of this process results in a slowing of the local HR. Resampling the RR interval time series can therefore reveal a respiratory signal, if the average Nyquist frequency condition is met. (Note the data are irregularly sampled in time, so an average Nyquist condition is appropriate.) In subjects with rapid breathing (faster than half the average heart rate) the average Nyquist criterion is not met (Clifford et al. 2006). It should also be noted that the RR interval time series (or tachogram) contains more than just a respiratory frequency, and therefore caution must be taken in interpreting a given frequency as respiratory in origin (Nemati et al. 2010). An example of EDR with the actual ECG can be seen in Figure 5.
Figure 5.

Excerpt of the ECG of a healthy subject over 25 s. The R peaks have been calculated, along with the corresponding HR and EDR.
The phase between the respiratory RR interval oscillations and respiratory-related changes in ECG morphology is not static. The reason for this is that the mechanisms which alter amplitude and timing on the ECG are not exactly the same (although they are coupled either mechanically or neurally with a phase delay which may change from beat-to-beat). These phase changes turn out to provide information concerning sleep physiology, as we will discuss in section 4.2.3.
4.2.2. Heart Rate Variability and sleep
Bernardi et al. (2000) demonstrated that HR variability (HRV) in conscious patients as measured by the low-frequency (LF) to high-frequency (HF) ratio (-ratio) changes markedly depending on a subject’s activity. (The LF and HF bands are generally defined to be [0.04 : 0.15) Hz and [0.15 : 0.40) Hz respectively.) Their analysis involved measuring the ECG, respiration and BP of 12 healthy subjects, all aged around 29 years (yrs), for 5 min during a series of simple physical (verbal) and mental activities. Despite the similarity in subject physiology and physical activity, (all remained in the supine position for at least 20 min prior to, and during the recording), the day-time -ratio had a strong dependence on mental activity, ranging from 0.7 for controlled breathing to 3.6 for free talking. It may be argued that the changes in these values are simply an effect of changing breathing patterns (that modify the HF component). However, significant changes in both the LF component and BP readings were also observed, indicating that the feedback loop to the central nervous system (CNS) was definitely affected. The resultant change in HRV is therefore likely to be more than just a respiratory phenomenon. The HF contribution is often dominated by respiratory modulation on the beat-to-beat intervals (respiratory sinus arrhythmia) but is not the only component of the HF activity. Moreover, respiration can dip below 0.15 Hz into the LF region.
Differences in mental, as well as physical activity should therefore be minimised when comparing HRV metrics on an inter- or intra-patient basis. Since it is probably impossible to be entirely confident whether a subject is controlling their thought processes for a few minutes (the shortest time window for traditional HRV metrics (Malik 1996)), this would imply that HRV is best monitored while the subject is asleep, during which the level of mental activity can be more easily assessed.
Furthermore, artefacts in the ECG are significantly reduced during sleep (because there is less physical movement by the subject) and the variation in -ratio with respect to the mean value is reduced within a sleep state (Clifford & Tarassenko 2004, Clifford & Tarassenko 2005a, Clifford 2002). Sleep stages usually last more than 5 min (Lavie 1996), which is larger than the minimum required for spectral analysis of HRV (Malik & Camm 1995). Segmenting the RR time series according to sleep state basis therefore often provide data segments of sufficient length with minimal data corruption and departures from stationarity (which otherwise invalidate the use of Fourier techniques) (Clifford & Tarassenko 2004).
When loss of consciousness occurs, the parasympathetic nervous system begins to dominate with an associated rise in HF and decrease in -ratio. This trend is more marked for deeper levels of sleep (Otzenberger et al. 1998, Vanoli et al. 1995). The power spectral densities calculated from 5 min of RR interval data during wakefulness and REM sleep reveal similar spectral components and -ratios (Otzenberger et al. 1998). However, stage 2 sleep and SWS exhibit a shift towards an increase in percentage contributions from the HF components (above 0.15 Hz) with -ratio values around 0.5 to 1 in NREM sleep and 2 to 2.5 in REM sleep (Otzenberger et al. 1998). In patients suffering from a simple CNS but non-cardiac related problem, Lavie et al. (1999) found slightly elevated NREM -ratio values of between 2 and 3.5 and between 3.5 and 5.5 for REM sleep. Vanoli et al. (1995) report that myocardial infarction generally results in a raised overall -ratio during REM and NREM sleep with elevated LF and -ratio (as high as 8.9) and lower HF. Values for all subjects during wakefulness in these studies (2.4 to 4.0) lie well within the range of values found during sleep (0.5 to 8.9) for the same patient population (see Table 4). This demonstrates that comparisons of HRV between subjects should be performed on a sleep-stage specific basis.
Table 4.
-ratios during Wakefulness, NREM and REM sleep. N/A = not available, Post-MI = a few days after myocardial infarction, CNS = non-cardiac related problem. Results quoted from (Otzenberger et al. 1998, Vanoli et al. 1995, Lavie et al. 1999).
| Activity → Condition ↓ |
Population Size |
Awake | REM Sleep |
NREM Sleep |
| Normal (Otzenberger et al. 1998) | 15 | N/A | [2 : 2.5] | [0.5 : 1] |
| Normal (Vanoli et al. 1995) | 16 | 4.0 ± 1.4 | 3.1 ± 0.7 | 1.2 ± 0.4 |
| CNS Problem (Lavie et al. 1999) | 22 | N/A | [3.5 : 5.5] | [2 : 3.5] |
| Post-MI (Vanoli et al. 1995) | 16 | 2.4 ± 0.7 | 8.9 ± 1.6 | 5.1 ± 1.4 |
Some studies in the literature have shown that the segmentation of the ECG into sleep states and the comparison of HRV metrics between patients on a per-sleep stage basis increases the sensitivity sufficiently to allow the separation of subtly different patient groups (normals and sleep apnoeics†), as long as a suitable spectral estimation technique (such as the Lomb-Scargle periodogram) is also employed. In particular, it was found that SWS gave the lowest variance in the -ratio both in an intra- and inter-patient basis, with the fewest artefacts, confirming that SWS is the most stable of all the sleep stages. However, since certain populations do not experience much SWS, it was found that REM sleep is an alternative (although slightly more noisy) state in which to compare HRV metrics (Clifford & Tarassenko 2004, Clifford & Tarassenko 2005a). The HR or RR time series can be considered to be a series of states, connected by transitions (McSharry & Clifford 2005). Each state can be described by an interval length, a LF/HF-ratio, mean and variance (of the HR). The inter-state interval lengths are described by scaling laws which differ considerably depending on whether a subject is asleep or not. Specifically, they were modelled according to the findings of (Lo et al. 2004), who observed that duration of brief wake episodes during the sleep period exhibit a scale-free power-law behaviour with an exponent that remained the same (approximately equal to 2.2) across a diverse range of species, while sleep episode durations followed exponential distributions with characteristic time scales, which change across species in relation to body mass and metabolic rate. This indicates that the cardiovascular dynamics that govern sleep and wakefulness are very different and that the use of these dynamics is likely to reveal differences between sleep and wakefulness, rather than specific sleep stages, as observed in the published literature.
4.2.3. Coupling between HRV and respiration
The changes in the sequence of RR intervals during RSA are also heavily correlated with respiration through neurological modulation of the sino-atrial node. However, as noted earlier, since the QRS morphology shifts due to respiration are mostly mechanically mediated, the phase difference between the two signals is not always constant. Thomas et al. (2005) demonstrated that by tracking changes in this coupling through cross-spectral analysis of the EDR and RSA time series, they were able to quantify the type and depth of sleep that humans experience into CAP and NCAP sleep (rather than the traditional R&K scoring).
Following Thomas et al. (2005), frequency coupling can be measured using the cross-spectral density between RSA and EDR. Two slightly different measures are noted: (a) the coupling frequency with respect to magnitude of the sinusoidal oscillations A(f) and (b) the consistency in phase of the oscillations Θ(f). These are calculated separately such that
| (1) |
and
| (2) |
where ℰ[.] is the expectation operator across all the i = 1, …, N segments and is the cross-periodogram of the ith segment.
In general, Pxy(f) is complex even if X(t) and Y (t) are real. Since A(f) is calculated by taking the magnitude squared of Pxy(f) in each block followed by averaging, it corresponds to the frequency coupling of the two signals due to the oscillations in amplitude only. Similarly, since Θ(f) is computed by first averaging the real and imaginary parts of Pxy(f) across all blocks followed by magnitude squaring, it measures the consistency in phase of the oscillations across all blocks. A(f) and Θ(f) are normalised and multiplied together to obtain the cardiorespiratory coupling (CRC), a measure of the strength of coupling between RSA and EDR as follows:
| (3) |
CRC lies in the range between 0 and 1 with a low CRC indicating poor coupling and therefore increased activity. A high CRC (> 0.4) indicates decreased activity that can be interpreted as sleep or sometimes sedation (Clifford et al. 2005). A value closer to 1 means strong coupling of RSA and EDR at a given frequency. It should be noted that this method is a slight modification of the one described in Thomas et al. (2005) (called cardiopulmonary coupling, or CPC), where the squaring of the phase is taken before the averaging. This difference does not lead to significant differences in the metric as a predictor of stable (coupled high frequency) activity however. Furthermore, in CPC, the cross-power is thresholded at different frequencies to produce an output of wakefulness/REM sleep (WR), unstable/CAP sleep, or stable/NCAP sleep. NCAP sleep is correlated with low sedation/agitation (Riker) levels (Clifford et al. 2005, Riker et al. 1999) and WR is correlated with medium to high agitation (Riker) scores. Figure 6 illustrates the application of this technique to a patient in Physionet’s Chronic Heart Failure database (Baim et al. 1986, Goldberger et al. 2000a). The upper plot is a cross-spectrogram; a time series of the cross spectral density between the EDR and RSA.
Figure 6.

Spectrogram of EDR-RSA coherence (upper plot), and equivalent wavelet cross spectral coherence (lower plot) for the same overnight RR tachogram for a chronic heart failure patient. Note both signals are normalised to the interval [0 1] and frequencies ≥ 0.5 Hz are not considered because the average HR is ~60bpm (1 Hz). The wavelet approach also includes a bounding region inside which significant coupling is detected, and arrows to indicate phase of the coupling, with EDR leading RSA for right pointing arrows.
Coupling between RSA and EDR is more evident or easily obtainable when the subject is at rest (or in stable sleep, or perhaps, deep sleep) where there are fewer factors that may significantly influence changes in the respiratory rate or HR. Therefore, this technique has also been employed to detect changes in activity or stationarity in patients (Clifford et al. 2005). Furthermore, the strongest coupling frequency is directly correlated with respiration, which is also a good index of activity, as well as an estimate of the prevailing respiratory rate. A sensitivity analysis of this technique also shows that the CPC metric is extremely robust to noise (Clifford et al. 2005), since presence of noise on the ECG is correlated with changes in activity (Clifford et al. 2002).
It should be noted that the analysis of synchronisation between the cardiac cycle and the respiratory frequency has been an area of interest for a few years now (Hoyer et al. 2001), with promising results for determining the health of a certain patient groups. More recent (unpublished) work by the authors of this paper shows that a wavelet approach can produce similar results (see Figure 6, lower plot). A wavelet-based approach leads to a higher temporal resolution than a Fourier approach, and may therefore enable an identification of transient events such as short term arousals, which are known to be associated with changes in HR and respiratory patterns.
Subsequently, Redmond & Heneghan (2006) derived cardiorespiratory features from the ECG recorded from 37 subjects being evaluated for the presence of OSA. They trained a quadratic discriminant classifier to select between wakefulness, REM sleep, NREM sleep and ‘sleep (REM and NREM). For subject-independent training they achieved a κ of 0.32 and a classification accuracy of 67%. (By comparison, the same authors managed to achieve an accuracy of 84%, and a κ of 0.68 using EEG-derived features from the same population.) This illustrates the difficulty in actually classifying sleep states, and more focus has been given to identifying consequent conditions (such as OSA). In 2000, the first PhysioNet/Computing in Cardiology Challenge was ‘Detecting and quantifying apnoea based on the ECG (Moody et al. 2000). A training set of 35 ECG recordings was made available for algorithm development, and results from a test set of 35 different ECG recordings were made available for independent scoring. Of the 13 algorithms in the competition, the best made use of frequency-domain features to estimate changes in heart rate and the effect of respiration on the ECG waveform. Four of the algorithms achieved perfect scores of 100% on the training set, and two achieved an accuracy of over 90% on the independent test set. Penzel et al. (2002b) present an excellent summary of the entrants to the competition and an analysis of the issues involved. However, it is clear that the interplay between heart rate and respiration have a significant role to play in both identifying changes in sleep stages, and classifying sleep-related disorders.
4.3. The Photoplethysmogram and Oxygen Saturation
Together with ECG, PPG is the most widely used technique for at-home sleep monitoring and in simplified PSG systems. The main use of PPG in sleep studies is the measurement of SpO2, either for sleep apnoea alarm systems or for OSAS diagnosis.
Apnoea alarm systems usually derive the SpO2 from the PPG signal and provide an alarm trigger when the SpO2 falls below a predefined value, or when it drops by a certain amount from baseline. Acceptable SpO2 levels may vary with the type of patient; target values ranging from 85–95% have been considered acceptable for infants (Finer & Leone 2009), while desaturations of more than 2–5% have been considered indicative of OSAS in adults (Flemons et al. 2003). However, an important limitation of pulse oximetry monitors is the high rate of false alarms, produced by motion artefacts and poor sensor contact (Chambrin 2001). False alarm rates between 70% and 80% have been reported in the literature (Petterson et al. 2007, Monasterio et al. 2012), mainly due to movement artefacts.
Most pulse oximeters deal with this problem by averaging SpO2 measures to provide a smooth output and to reduce the impact of artefacts. Usual averaging time windows range from 5–12 s (Barker 2002). Furthermore, several manufacturers have included motion tolerant algorithms in their systems (Petterson et al. 2007, Barker 2002). Since these algorithms are proprietary, the details of such technologies are not generally available, and their performance is not well documented.
Rather than incorporating sophisticated algorithms into pulse oximeter systems, an alternative approach is to pass the output of pulse oximeters through a postprocessing step for artefact rejection (Lee et al. 2010, Krishnan et al. 2010, Sukor et al. 2011). For example, Gil et al. (2005) proposed an artefact rejection algorithm based on the Hjorth parameters (which represent an estimate of the spectral characteristics of the PPG signal) (Sornmo & Laguna 2005), and applied it to detect decreases in the amplitude of the PPG signal during polysomnography (DAP events) robustly, obtaining a sensitivity and positive predictive value over 70% in real signals; the number of DAP events per hour during sleep was found to be significantly higher in children with OSAS than in healthy controls (Gil et al. 2008). In Li & Clifford (2012) a dynamic time warping approach and a neural network were used to classify each PPG pulse as good or bad quality. Using separate training and testing sets a 95% accuracy (ACC) was achieved on independent test data. In Monasterio et al. (2012), the quality of the PPG signal was assessed using a characteristic feature called spectral purity (Sornmo & Laguna 2005), and the resulting quality indices were incorporated into a false alarm detection algorithm for SpO2 monitors. The resulting algorithm was able to differentiate between apnoea-related desaturations and false alarms with 90% ACC on independent test data from 27 neonatal patients.
Various quantitative indices have been derived from overnight pulse oximetry for the diagnosis of OSA. One of them is the oxygen desaturation index (ODI) which is the average number of oxygen desaturations per hour of sleep. In order to mirror the definition of an abnormal AHI, cut-off points for an abnormal ODI have been proposed (either 5, 10 or 15 desaturations per hour), but there is little evidence of one definition having greater validity than the others (Netzer et al. 2001). Another index is the cumulative time spent below a threshold of 90% (Martinez et al. 2005). Furthermore, more sophisticated signal processing techniques have been proposed in order to increase the sensitivity and specificity of conventional time-domain screening techniques. Hornero et al. (2007) analysed the SpO2 signal from 187 subjects (111 with OSA, 76 without OSA). They found that OSA patients had a significant increase in approximate entropy (ApEn) values, leading to SN = 82% and SP = 86% on the test set using a threshold of 0.77 for the mean ApEn. Morillo et al. (2009) studied 117 subjects (87 males, 30 females; mean age = 58.4 yrs; BMI = 31.4±5.3 kg/m2) using Poincaré quantitative descriptors and achieved SN = 90% and SP = 84% on the test set. Alvarez et al. (2010) analysed 148 subjects (116 males, 32 females; age = 52.9±14.1 yrs; BMI = 29.8±5.6 kg/m2) with suspected OSA. Sixteen time and frequency PPG features were used to characterise changes in the SpO2 profile during the night which achieved SN = 92%, SP = 85.4% and Acc = 89.7% using mulitvariate analysis.
In addition to SpO2, PPG also provides information on HR and respiration rate. The pulsatile component of the PPG is synchronous with the beating heart, and therefore can be a source of HR information. There has been extensive research on the derivation of HR from PPG signals. Existing methods usually compute heart rate by upsampling the PPG signal and detecting peaks or zero crossings, and sometimes they incorporate artefact-rejection algorithms (Allen 2007). A still open question is whether the variability of the PPG-derived HR (PR) accurately reflects the HRV as measured with ECG signals in sleep studies. Recent studies indicate that PR variability and HRV indices could be significantly different during OSA (Khandoker et al. 2011). The authors recorded ECG and PPG measurements simultaneously from 29 healthy subjects and 22 OSA patients. The HR and PR were significantly correlated (correlation coefficient r > 0, 95, p < 0.01). Comparing 2 min recording epochs demonstrated significant differences (p < 0.01) between normal and OSA events using PR variability and HRV measures.
A number of signal processing algorithms have been proposed to estimate the respiration rate from the PPG. This is possible because respiration causes variation in the peripheral circulation, which is reflected in the PPG as a low-frequency component (Allen 2007). Reported mean estimation errors range from 0.04 to 3 breaths/min (Fleming & Tarassenko 2007). Most existing methods, however, have only been validated in normal-breathing populations, which may preclude their use on sleep disorder breathing (SDB) patients (Allen 2007).
In summary, new developments on signal processing have greatly improved the usefulness of PPG. Traditionally, the main use of PPG was to detect desaturations by setting a threshold for the SpO2 time series. Recent signal processing techniques expand the utility of PPG in three ways. First, they reduce the influence of movement artefacts, thus decreasing the rate of false desaturation alarms; second, new quantitative indices can be computed from the SpO2 time series to improve the diagnosis of OSAS; and third, indirect information on HR and respiration can be extracted from the PPG waveform, which opens interesting possibilities for reduced PSG systems.
4.4. Blood Pressure and Arterial Tonometry
There is a growing interest in non-invasive BP measurement techniques for ambulatory sleep monitoring (Gesche et al. 2012, Chen et al. 2012). A widely used surrogate measure of BP is the evaluation of the pulse transit time (PTT), which gives a quantitative measure of the time that the pulse wave needs for passing from one artery, typically the aorta, to another, typically in the periphery, and is approximated as the interval between the ECG R peak and the corresponding PPG wave (this approximation is usually called the pulse arrival time) (Naschitz et al. 2004). On the other hand, Chua et al. (2010) compared the peak-to-trough amplitude of the PPG signal and the pulse arrival time as surrogate measures of systolic BP in 18 young, healthy subjects (14 males, 4 females; age = 24±5 yrs; BMI = 23.8±4.0 kg/m2). The authors found that the pulse amplitude showed stronger correlation with continuous systolic BP than pulse arrival time.
The correlation between attenuations in the PAT signal, declines in the PTT, and arousals has also been a subject of interest (Penzel et al. 2002a, Katz et al. 2003, O’Brien, L. M. and Gozal, D. 2005). O’Brien, L. M. and Gozal, D. (2007) analysed data from 10 healthy children and found that declines of at least 15 ms in the PTT and PAT amplitude attenuations from baseline of at least 20% were very sensitive for arousal recognition (SN of 96% and 92% respectively), although poorly specific (SP of 30% and 19% respectively). Also, a wrist-worn device based on the PAT signal, the WatchPAT 100 (Itamar Medical; Caesarea, Israel) has been designed for unattended home sleep studies. The scores for apnoea/hypopnoea computed by the WatchPAT 100 (using proprietary algorithms) have been found to strongly correlate with standard polysomnographic indices of respiratory disturbance (r = 0.88, p < 0.0001) when the data for 102 subjects were analysed (78 males, 24 females; 69 with OSAS, 33 normal volunteers; age = 41.1±15.2 yrs; BMI = 26.8±5.5 kg/m2) (Bar et al. 2003).
4.5. Respiration
In the analysis of respiration for SDB diagnosis, the automatic differentiation of obstructive and central respiratory events remains a major challenge (Morgenstern et al. 2010). The most reliable technique to differentiate these events is oesophageal pressure (Quan et al. 1999), which is a complex and invasive technique. Non-invasive alternatives have been proposed which make use of different techniques: wavelet analysis of the airflow signal (Fontenla-Romero et al. 2005), which achieved an accuracy of 84% in the classification of an independent test set with 120 obstructive and central apnoeas; forced-oscillation technique (Yen et al. 1997), with an accuracy of 100% in a small independent test set with 50 obstructive and central apnoeas; and automatic classifiers of nasal airflow measures (Morgenstern et al. 2010), with a cross-validation accuracy of 90% in a set of 769 central and obstructive hypopnoeas.
As explained in sections 4.2.1 and 4.3, respiratory estimations can also be obtained from ECG and PPG, which is specially interesting for reduced PSG systems. Recently, Nemati et al. (2010) and Li et al. (2008) developed a data fusion framework that combines respiratory estimations from different sources and computes a robust and more accurate estimate of the respiration rate. Results from 30 patients showed that the root mean square (RMS) error of the fused respiration rate estimation is between 1 and 4 breaths/min lower than the error of ECG and PPG-derived respiration rate estimations.
There is increased interest in the incorporation of automated respiratory detection algorithms into CPAP therapeutic devices for the follow-up of OSAS patients after diagnosis. Examples of this technology are the REMstar Pro II and the C-Flex systems (Philips Respironics, PA, USA). However, the utility of such systems for assessment of therapeutic effectiveness requires further outcome data (Prasad et al. 2010).
4.6. Audio
Due to the physiological similarities between speech and snoring, and the availability of common methods for digital processing and analysis, audio analysis of snoring has been approached from the perspective of speech analysis. It should be noted that the literature is replete with small population studies of snoring, with sensitivities and specificities ranging from 70 to 90% and accuracies for apnoea detection from 70 to 80%. However, not only have small populations been used (generally between 5 and 60 subjects), results on training (and not independent test sets) have been reported.
4.6.1. Snoring and Choke Formants
Linear predictive coding (LPC), developed in the late 1960s by Atal & Hanauer (1971), attempts to model each new speech sample as a linear combination of previous samples. LPC is a model of an all pole filter; the vocal tract can be approximated by LPC due to its resonant chambers, except for nasal sounds which introduce zeros. Ng et al. (2008b) analysed the snoring sounds of 30 apnoeic snorers (24 males, 6 females; age = 44 ± 13 yrs; BMI = 29.3±6.9 kg/m2; AHI = 46.9±25.7 events/h) and 10 benign snorers (6 males, 4 females; age = 41±12 yrs; BMI = 26.9±5.6 kg/m2; AHI = 4.6±3.4 events/h). The first three formant frequencies† (f1, f2, f3) were calculated using LPC and used to classify apnoeic snorers from benign snorers with SN = 88%, SP = 82%. Sola-Soler et al. (2003) analysed 447 snores of 8 simple snorers (6 males, 2 females; age = 46.0±8.15 yrs; BMI = 27.93±3.01 kg/m2; AHI = 8.78±2.64 events/h) and 236 normal and 429 post-apnoeic snores of 8 OSA patients (8 males; age = 50.75±8.01 yrs; BMI = 28.96±2.32 kg/m2; AHI = 34.04±25.1 events/h) (total sample size = 1112 snores). They calculated the formant frequencies of the spectral envelope and found that all snores have 2–6 marked formants in some common frequency ranges. On average, OSA patients had a lower mean formant in each band, regardless of whether normal snores or post-apnoeic snores are considered. Yadollahi & Moussavi (2009) analysed the formant frequencies of breath and snore sounds for 15 subjects (12 males, 3 females; age = 52.3±15.2 yrs; BMI = 35.1±4.6 kg/m2; AHI = 33.9±42.3 events/h). A total of 1636 snore segments and 3059 breath segments at different sleeping positions were selected from all subjects (total sample size = 4695) and the authors found that f1 and f3 were significantly different between breath and snore segments (p = 0.003 and p = 0.0244 respectively).
4.6.2. Frequency Analysis
A lot of work has been done on frequency/spectral analysis. Fiz et al. (1996) studied 17 male snorers: 10 with OSA (BMI = 32.9±7.6 kg/m2; AHI = 26.2 events/h) and 7 simple snorers (BMI = 29.7±7.2 kg/m2; AHI = 3.8 events/h). There was a significant negative correlation between AHI and peak and mean frequencies of the snoring power spectrum (p≤0.0016 and p≤0.0089, respectively). McCombe et al. (1995) studied 9 OSA patients (8 males, 1 female; BMI = 28.7±4.1 kg/m2; AHI>15 events/h) and 18 simple snorers (16 males, 2 females; BMI = 28.6±3.9 kg/m2; AHI≤15 events/h) and developed their own acoustic measure which classified subjects with SN = 67%, SP = 100%, PPV = 100% and NPV = 86%. Perez-Padilla et al. (1993) analysed 10 heavy snorers and 9 OSA patients using the fast Fourier transform (FFT) and found that most of the snoring noise power occurred below 2 kHz with a peak power less than 500 Hz. OSA patients showed a sequence of snores with spectral characteristics that varied markedly through an apnoea-respiration cycle. OSA patients exhibited residual energy at 1 kHz while heavy snorers did not.
Hara et al. (2006) analysed 46 OSA patients (40 males, mean BMI = 25.8 kg/m2; 6 females, mean BMI = 26.1 kg/m2; AHI ≥20 events/h) and 12 simple snorers (8 males, mean BMI = 24.5 kg/m2; 4 females, mean BMI = 24.8 kg/m2; AHI≤5 events/h). The parameters used were peak frequency, soft phonation index (SPI), noise to harmonics ratio (NHR), and power ratio. SPI is the average ratio of lower frequency harmonic energy in the 70–1600 Hz range to higher frequency harmonic energy in the 1600–4500 Hz range. NHR is the average ratio of the inharmoic spectral energy in the 1500–4500 Hz range to the harmonic spectral energy in the 70–4500 Hz range. The power ratio is the ratio of the power spectrum below 800 Hz to the power spectrum above 800 Hz. The authors found that simple snorers had a high SPI value, while OSA snores had a high NHR and a low power ratio. Herzog et al. (2008) studied the peak intensity of the power spectrum. There were 60 patients included in this study (60 males; mean age = 50 yrs; mean BMI = 29.6 kg/m2; 18 patients had an AHI≥10 events/h). A raised AHI correlated significantly with an increase in peak intensity of the FFT curve (p<0.001). A number of acoustic properties have been used to try to classify OSA including noise to harmonics ratio (Hara et al. 2006), peak intensity (Herzog et al. 2008), formant frequencies (Lee et al. 2000, Ng et al. 2008b) and phase coupling relations (Lee et al. 2000, Abeyratne et al. 2007, Ng et al. 2007).
It should be noted that the above techniques assume stationarity; an assumption which is likely to be broken. Wavelet analysis is a suitable method for analysing non-stationary signals such as speech/snoring signals. Ng et al. (2008a) used the snoring sounds of 30 snorers with OSA (24 males, 6 females; age = 44±13 yrs; BMI = 29.3±6.9 kg/m2; AHI = 46.9±25.7 events/h), and 10 snorers without OSA (6 males, 4 females; age = 41±12 yrs; BMI = 26.9±5.6 kg/m2; AHI = 4.6±3.4 events/h). A snore activity detector based on the translation-invariant discrete wavelet transform was applied in order to find the snore signals, which was 10% more accurate than the conventional energy and zero crossing rate approach.
4.6.3. Hidden Markov Models
Duckitt et al. (2006) recorded the sounds of 6 subjects (4 males, 2 females; age range = 43–75 yrs) sleeping in their own homes. None of the participants had been clinically diagnosed with OSA, but were self-reported snorers. The recordings were manually classified into epochs of snoring, breathing, duvet noise, silence, and other noise. The data were parametrised with mel-frequency cepstral coefficients† (MFCCs) (Davis & Mermelstein 1980) calculated for time n̂ as follows:
Hidden Markov models (HMMs) were used to model the different types of sounds. The audio data were both manually segmented as well as using the HMMs to segment the data into periods of snoring, silence, breathing, duvet noise and other noise. The authors found that the SN = 89% when the HMMs were trained on the training data from all 6 subjects and tested on the training data of all 6 subjects; when the HMMs were trained on 3 subjects and tested on the other 3 subjects the system had SN = 82% when comparing the results with the manually produced transcription of the same data.
4.6.4. Energy Distribution
Cavusoglu et al. (2007) analysed the energy distribution in order to distinguish between snoring and non-snoring events. The study used 30 subjects: 12 OSA patients (12 males; age = 53.26 (range 44.87–61.65) yrs; BMI = 32.76 (range 27.47–38.05) kg/m2; AHI = 39.21 (range 22.17–56.25) events/h) and 18 simple snorers (16 males, 2 females; age = 46.92 (range 40.21–53.63) yrs; BMI = 27.66 (range 23.41–31.91) kg/m2; AHI = 4.29 (range 3.03–5.55) events/h). Snoring episodes exhibited a regular pattern in the spectrogram and could be easily distinguished from other sounds. The algorithm had a SN = 90.2% and a PPV = 98.7% for simple snorers, and a SN = 86.8% and a PPV = 93.8% for OSA patients. Jones et al. (Jones et al. 2005, Jones, Walker, Ho, Earis, Swift & Charters 2006, Jones, Ho, Earis & Swift 2006) studied a number of acoustic features: snore duration, snore loudness, snore periodicity and sub-band energy distribution. There were 20 patients involved in this study (18 males, 2 females; age = 46 (33–65) yrs; BMI = 31.6 (26.9–44.1) kg/m2). The results were used to determine whether palatal surgery had been successful. The Pringle and Croft grading (using objective methods) had 62.5% SP, 50% SN, 66.6% PPV and 45.5% NPV; the Camilleri et al. grading (using objective methods) had 37.5% SP, 91.7% SN, 68.7% PPV and 75% NPV.
4.6.5. Pitch
Pitch is associated with the vibration frequency of the vocal cords and is the psycho-acoustic equivalent of the fundamental frequency. Because speech changes over time, the pitch will change as well, therefore it is common to track the pitch over time (Pevernagie et al. 2010). Abeyratne et al. (2005) divided snore-related sounds into pure breathing, silence and voiced/unvoiced snores. Voiced components, ssv(n), were separated from unvoiced ones, ssuv(n), using pitch information particular to ssv(n). A number of parameters in the pitch information could be changed, and when applied to a clinical database of 16 patients (8 males, 8 females; age = 52 (36 – 71) yrs; AHI = 30.3 (3.3 – 85.7) events/h), the SN ranged from 86% to 100%, with SP remaining between 50% and 80%. Abeyratne et al. (2001) divided snore-related sounds into three main classes: benign snoring (BS), apnoeic snoring (AS) and speech. The authors analysed snoring sounds from 14 patients, of which half were classed as AS and the other half as BS. Using a decision boundary of T = 1.85σ + 10.0 the authors found that the data could be separated into AS class with 92% accuracy and into BS with 90% accuracy, while the separation of speech from the rest of the data was 100% accurate.
4.6.6. Higher Order Statistics
Higher order statistics, also known as cumulants, and their associated Fourier transforms, also known as polyspectra, reveal both amplitude and phase information about a process (Mendel 1991). Ng et al. (2007) studied nine OSA patients (age 47±18 yrs; BMI= 29±7 kg/m2; AHI = 41±19 events/h), and seven simple snorers (age 38±11 yrs; BMI = 27±6 kg/m2; AHI = 4±3 events/h). They looked at the non-Gaussian and non-linear behaviour of snore signals using bispectral analysis. The raw snore signals were denoised using a modified level-wavelet-dependent thresholding scheme under an undecimated wavelet environment. Non-linear properties in the noise-suppressed snore signals were extracted to discriminate between apnoeic and simple snorers. The authors found that apnoeic snores exhibited a higher degree of phase coupling phenomena than simple snores (77% of benign snores indicated the presence of self-coupling, compared to only 49% of apnoeic snores).
4.6.7. Other methods
Roebuck & Clifford (2012) analysed 240 min of audio data from 146 subjects, 72 with OSA (55 males, 17 females; age = 51.4±11.9 yrs, BMI = 37.9±17.1 kg/m2) and 74 non-OSA (45 males, 29 females; age = 48.6±14.7 yrs, BMI = 32.6±8.6 kg/m2). The regularity of patterns between the audio signals of subjects with OSA and without OSA was characterised by multiscale entropy coefficients (Costa et al. 2003) calculated over 40 scales (1–40 s). Using three scales (scales 6, 21 and 30) and a linear SVM to classify the patients into OSA and non-OSA, SP = 90.5% and PPV = 83.5% was found on the unseen test data.
It is thought that the diagnosis of OSA may be more accurate if any structural and/or functional abnormalities of the upper airway are known (Shepard Jr et al. 1991). The SNAP Testing System (SNAP Laboratories, Glenview, Illinois) is a reflective acoustic device that is to be used for screening and analysis of OSA to locate the source of snoring and detect sleep apnoea conditions. A number of studies have been carried out comparing the SNAP testing system to conventional PSG. Liesching et al. (2004) found that SNAP did not assess the severity of OSA correctly; Michaelson et al. (2006) found that for an AHI ≥ 15 SNAP was 100% SN, 88.5% SP, 57% PPV and 100% NPV whereas Su et al. (2004) found that 20% of patients were classified incorrectly using the SNAP system. Galer et al. (2007) focused on the audio channel, and found that analysing snoring has limited use in the evaluation of patients with sleep apnoea although standard linear signal processing approaches were used.
An effort has been made recently to use snoring to estimate the AHI. Solà-Soler et al. (2012) analysed the sounds of 36 subjects (25 males, 11 females; age range = 23–69 years; AHI range = 0–90.8 events/h). Snoring sounds were automatically identified and both time and frequency domain features were computed. The authors found that they could classify into AHI<5, 5≤AHI<30 and AHI≥30 with 83.3% ACC using these features. Ben-Israel et al. (2012) automatically identified the snoring sounds from 90 subjects (57 males, 33 females; age = 53±13 yrs; BMI = 31±5 kg/m2) and calculated a variety of features (MFCCs, pitch density, etc.). These features correlated well with the AHI calculated from the PSG (r2 = 0.81, p < 0.001) and an AUC of 85% and 92% for thresholds of 10 and 20 events/h, respectively, were obtained for OSA detection. Fiz et al. (2010) automatically identified the snores of 37 snoring subjects (25 males, 12 females; age range = 40–65 yrs; BMI = 29.65±4.7 kg/m2). The number of snores, average intensity and power spectral density parameters were calculated for each subject, who were then classified with AHI = 5 and AHI = 15 thresholds giving a SN (SP) of 87% (71%) and 80% (90%), respectively.
4.7. Accelerometry
Actigraphy hardware is constantly evolving. Modern actimeters may include micro-electro-mechanical systems sensors for 3-dimensional acceleration measurement, light sensing in different spectral bands, body temperature, humidity, noise level and the capability to collect user-provided information, such as subjective mood scores. 3-dimensional actigraphs allow for a very precise automated classification of activity (Zhang et al. 2012).
However, a significant number of actimeters on the market are from the older generation, usually offering non-directional measurement of acceleration in arbitrary units (counts) rather than g. Such devices suffer from technological limitations, including limited amount of memory, low sampling rates (below 0.1 Hz) and non-linearity of acceleration measurements. Results of activity measurements in such devices are usually collected in epochs of several seconds or minutes. Activity data are often post-processed and available as zero-crossing timestamps (frequency of movement), time-above-threshold (duration of movement) or periodic integration information (intensity of movement) (Hersen 2006).
Actigraphic analysis results may depend not only on the type of actimeter used, but also on the selected device location on a human body. For sleep and circadian rhythms analysis, non-dominant wrist is usually selected as the preferred location of actimeter (Berger et al. 2008), but no significant difference in analysis results is reported between dominant and non-dominant wrists as well as waist (Sadeh et al. 1994, Paavonen et al. 2002). However, for certain scenarios waist or hip location may be chosen, for example to benefit from orientation information, available from 3-dimensional accelerometry sensors. Swartz et al. (2000) demonstrated that energy expenditure variations are explained mostly by hip positioned accelerometer and Parkka et al. (2007) found a strong correlation (r = 0.86) between energy cost of physical activities and ankle positioned accelerometer.
4.7.1. Body Position
It has been shown that there exists a correlation between severity of sleep apnoeic events and body position (A. Oksenberg et al. 2000). Studies regarding the effect of body posture on OSA have shown that the severity of sleep apnoea increases when sleeping in the supine posture (S.R. Lloyd & R.D. Cartwright 1987, N.B. Kavey et al. 1985, R.D. Cartwright 1984). For this reason, patient position (typically left side, right side, prone, supine, and sitting up) can be recorded over night and used as an adjunct to other signals for diagnosis. For instance, K. Yoshiba (2001) found that the effectiveness of therapeutic devices was influenced by body posture and that body position recorded by PSG may be useful in predicting whether that treatment would be successful or not for a given subject. Many systems such as Grey Flash (Stowood Scientific Instruments, Oxford, England), the Embla Embletta (Natus Medical Incorporated, San Carlos, USA) or SOMNOwatch (SOMNOmedics, Randersacker, Germany) have a body position sensor incorporated. van Kesteren et al. (2011) studied the effects of trunk and head position on the AHI in OSA. To differentiate the effect of the trunk supine position and head supine position, they used two position sensors one placed on the mid-forehead and the other one placed on the trunk of the subject. From the 199 patients in the study, the AHI was not position dependent in 41.2% of cases, the AHI was dependent on the supine position based on the trunk sensor alone in 52.3% of cases, while the AHI was supine position dependent based on the head sensor alone in 6.5% of cases. In 46.2% of the trunk supine position-dependent group, head position was of considerable influence on the AHI (AHI was more than five times higher when the head was also in supine position compared to when the head was turned to the side). The authors therefore suggest that for patients with suspected OSA two position sensors placed on the head and trunk should be considered for sleep recordings. Ozeke et al. (2011) studied 131 patients who were referred for suspected OSA. The subjects spent the same amount of time on left side and right side sleeping position and the authors showed that while the supine sleeping position caused the highest AHI score, the left side sleeping position had a statistically higher AHI score than right side sleeping position (30.2±32.6 events/h vs. 23.6±30.1 events/h, p < 0.001).
Body position can be derived from the accelerometer sensor together with a magnetometer or using a gyroscope. The accelerometer is primarily used to create an actogram (for describing physical motion) in the context of sleep analysis. The form of the actigraph depends largely on the sensor, which range from piezo-electric sensors, to gyroscopes and HEMP. However, to identify position a frame of reference relative to the gravitational field is needed. The force of the gravitational field is used as an input to determine the orientation of an object by calculating the degree of tilt (tilt is a static measurement) (K. Tuck 2007). For an internal accelerometer the DC component allows for the assessment of slow motion and change in position referring to the gravitational axis. The AC component of the raw signal represents acceleration along the sensitive axis of the sensor (J. Fahrenberg et al. 1997). By band-pass filtering the raw acceleration signal, it is possible to separate the DC and AC components, which approximate acceleration due to gravity and acceleration due to movement respectively. For the three dimensional accelerometer the pitch and roll angles can be computed: pitch (ρ) is defined as the angle of rotation around the X-axis relative to ground; roll (ϕ) is defined as the angle of rotation around the Y-axis relative to the ground; (θ) is the angle of the Z axis relative to the gravity line (see Figure 7) and are calculated as follows (K. Tuck 2007):
where a = (ax, ay, az) is the acceleration along the three orthogonal axes of the accelerometer. The yaw angle requires the use of a magnetometer.
Figure 7.
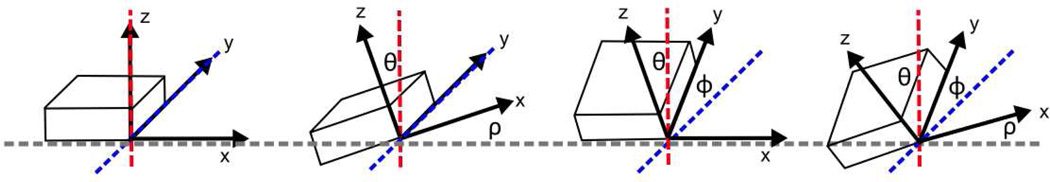
Three axis measuring tilt. Adapted from (K. Tuck 2007).
Thus an estimate of the orientation of the sensor can be derived from the force of gravity and a magnetometer. Note that a gyroscope can be used as an alternative to derive the pitch, roll and yaw angles. The mapping between sensor orientation and the body position then depends on where the sensor is worn and its ‘default’ orientation with respect to the anatomical planes.
4.7.2. Sleep-wake segmentation and sleep analysis
The use of actigraphy for sleep-wake assessment was first proposed by Webster et al. (1982). As an extension of Webster’s work for the commercially available Motionlogger (Ambulatory Monitoring Inc., Ardsley, NY, USA) actigraph, Cole et al. (1992) proposed a metric, D, based on weighted sum of preceding and subsequent epochs, which was shown to distinguish wakefulness 88% of the time:
| (4) |
where D < 1 indicates sleep and D ≥ 1 indicates wakefulness, Ai is an activity score for current, previous or subsequent minutes.
Sadeh et al. (1994) proposed an algorithm for the AMA-32 actigraph (Ambulatory Monitoring Inc., Ardsley, NY, USA), robust to changes in activity levels and device placement (dominant or non-dominant wrist). Overall agreement with PSG analysis was 91–93%. The algorithm performs sleep-wake segmentation using the four most predictive activity features (identified using stepwise discriminate analysis):
| (5) |
where PS ≥ 0 is sleep and PS < 0 is wake, MW5 is an average number of activity counts of the current and 5 preceding and following minutes, NAT is the number of minutes with activity ≥ 50 but < 100 in an 11 min window, SDL6 is the standard deviation of the activity counts during current and preceding 5 min, LOGA is the natural logarithm of the number of activity counts in the current and next minute.
The fundamental assumption of sleep identification as the absence of movement introduces a significant problem in the detection of quiet wakefulness by actigraphy. A wakefulness detection specificity of 35–50% is often reported, especially with increased subject wakefulness (Sadeh 2011, Paquet et al. 2007) and this affects all derived sleep characteristics. Therefore special care needs to be taken when using actigraphy for sleep analysis in subjects with limited mobility and serious sleep disturbances. However, it is necessary to note that most of these results are obtained with older generation unidirectional actigraphs whereas newer devices may allow development of more sensitive algorithms.
The role of actigraphy in diagnosing insomnia is well documented and it has been consistently reported that actigraphy overestimates sleep time due to individuals lying motionless for extended periods. Natale et al. (2007) analysed the actograms of 126 insomnia patients (68 males, 58 females; age = 40.39±14.28) and 282 normal controls (117 males, 165 females; age = 38.51±14.06), where the actigraph was worn on the non-dominant wrist. There were significant differences between the groups: light off, sleep end, sleep onset latency (SOL), TST, mean motor activity (number of movement in one minute) (MA), the number of awakenings longer than 5 min, wake after sleep onset (WASO) and sleep efficiency (SE) all differentiated the two groups significantly (p < 0.00001) while time in bed (TIB) did not. Sivertsen et al. (2006) looked at the clinical utility of actigraphy in 34 chronic insomniacs (17 males, 17 females; age = 60.5±4.5) where the placement of the actigraph is not specified. The sensitivity of the actigraphic epoch-by-epoch sleep-wake scoring was 95.2% when compared with PSG but specificity was only 36.3% (i.e. poor ability to detect wakefulness). However, Lichstein et al. (2006) studied the differences between PSG and actigraphy based on one night’s sleep in a laboratory for 57 subjects with insomnia (26 males, 31 females; age range = 21 – 87) where the actigraph was placed on the dominant wrist. Unlike other studies, the authors found no significant differences between PSG and actigraphy means of TST, WASO, SE, number of night-wakings (p < 0.01 for all four metrics) and SOL (p > 0.01).
Actigraphy has also been used to detect PLMS. Sforza et al. (2005) used a device specifically tailored to detect limb movements. 43 patients (33 males, 10 females; age = 57.6±3.7) referred for insomnia and/or EDS underwent one or two nights of PSG with simultaneous bilateral recording of limb activity. The authors found that actigraphy-PLMS correlated highly with PGS-PLMS (r = 0.87) and found that actigraphy-PLMS had SN = 88% and SP = 76% for detecting PLMS index > 10. King et al. (2005) fixed an actigraphy to the big toe of five patients with known PLMS. For a PLMS index > 25, the Actiwatch had 100% SN and 97% SP.
Sadeh et al. (Sadeh & Acebo 2002, Sadeh 2011) found that actigraphy is not considered a valid tool for assessing SDB. Elbaz et al. (2002) analysed 20 subjects (15 males, 5 females; age = 52±15; BMI = 28±5) with suspected OSAS using an actimeter worn on the non-dominant wrist as well as computerised PSG. The authors found that an actigraphy-based estimate of TST improved the validity of the AHI estimate based on simple respiratory polygraphy (SN went from 50% to 88% while NPV increased from 75% to 92.5%).
Despite the widespread use of actigraphy for sleep assessment, there is no standard in actigraphic sleep-wake scoring rules comparable to the R&K rules (Tilmanne et al. 2009). Sleep-wake scoring algorithms for newer devices may not be developed yet or may need to be validated against PSG standard scores. Due to differences in hardware, most actigraphs implement their own sleep detection algorithms, and manufacturer differences in data sampling, processing and analysis makes it difficult to compare actigraphic studies (Berger et al. 2008).
4.7.3. Circadian rhythm analysis
Another important area of actigraphy usage is the analysis of circadian rhythm abnormalities (Ancoli-Israel et al. 2003), often linked with psychiatric and neurodegenerative diseases (Wirz-Justice 2007, Wulff et al. 2010). It has been suggested that circadian rhythm and sleep disruptions could initiate further worsening of mental conditions (Wulff & Joyce 2011). Reported evidence includes sleep and activity disruptions in conditions such as bipolar disorder (Indic et al. 2011), depression (Hauge et al. 2011), schizophrenia (Wulff et al. 2012, Waters et al. 2011, Hauge et al. 2011, Wulff et al. 2006, Walther et al. 2009, Wirz-Justice et al. 2001), Korsakoff psychosis (Wirz-Justice et al. 2010), Alzheimer’s disease (Wirz-Justice 2007, Van Someren et al. 1999), Huntington’s disease and multiple sclerosis (see review (Wulff et al. 2010)).
Analysis of circadian rhythms mostly includes methods for detection of activity rhythmicity, such as Fourier analysis (Refinetti et al. 2007), Cosinor and cosine fit (Teicher & Barber 1990), Enright periodogram (Enright 1965), Chi square periodogram (Sokolove & Bushell 1978), Lomb-Scargle periodogram (LSP) (Scargle 1982, Van Dongen et al. 1999) and various methods for estimation of rhythm characteristics, such as frequency, amplitude, etc. (Refinetti et al. 2007). Among these methods, the Cosinor method and LSP (Scargle 1982) are the most widely accepted and used in research (see for example (Wulff et al. 2006, Wirz-Justice et al. 2001)) as they are suited to unevenly sampled and missing data, and hence can be applied in a wide range of settings. The LSP and its tolerance of missing data has been well documented in HRV analysis (Clifford & Tarassenko 2005b).
To characterise 24 h activity variability, Witting et al. (1990) proposed non-parametrical activity metrics, including levels of activity during 5 least active hours (L5), 10 most active hours (M10), Relative Amplitude (RA = (M10−L5)/(M10+L5)), Interdaily Stability (IS)
| (6) |
where n is the total number of data, p is the number of data per day, x̄h are hourly means, x̄ is the mean of all data, and xi represents the individual data points (Van Someren et al. 1999), and intradaily variability (IV) (Witting et al. 1990, Van Someren et al. 1999)
| (7) |
where definition of variables is the same as for equation 6.
Actigraphy is also often used in multiparametric methods of circadian system status evaluation together with other signals, such as light, body temperature or hormones levels. Sarabia et al. (2008) proposed to use wrist temperature for evaluation of circadian rhythmicity while Ortiz-Tudela et al. (2010) suggested an integrated index based on thermometry, actimetry and body position.
In summary, actigraphy is actively used for both for sleep and circadian rhythms analysis. The sensitivity of actigraphy in wakefulness detection can be as high as 95%, but specificity as low as 35% in certain patient’s populations. However, availability and simplicity of actigraphic analysis tools makes it a preferred choice for ambulatory sleep monitoring scenarios.
4.8. Video
Video recordings, despite being widely available in sleep laboratories for research and clinical purposes, have mainly been used as an aide for the observation of sleep behaviour rather than a source of data for automated analysis. Research on automated analysis of sleep video is relatively young and sparse. In recent years, with the improvements in the video technology and image processing techniques, computation of video data has been used for the analysis of sleep-wake patterns, monitoring breathing rhythm, detecting sleep posture, and diagnosis of sleep disorders.
4.8.1. Sleep Activity and Sleep-Wake Analysis
The use of video recordings to manually analyse sleep activity and correlate it with sleep parameters goes back before 1980. In one of the earliest studies, Anders & Sostek (1976) used time-lapse video recordings of sleep-wake behaviour in human infants. They collected both polygraphic and video recordings of six normal full term infants (4 male and 2 female) at 2 weeks and 8 weeks of age. They concluded that the inter-rater reliability of the video recordings were high at 0.92 and the sleep-wake state proportions correspond relatively well with judgements based on polygraphic recordings with a 0.79 correlation between the two methods for all states and ages (p < 0.05).
Later in 1982, Aaronson et al. (1982) carried out a study to understand the relationship of activity during sleep with sleep cycle phase and to understand the power of activity data to quantify sleep parameters. Two men aged 21 and 29 and two women aged 28 and 37 yrs participated in the study. The subjects slept in a specially designed sleep room in Boston Museum of Science and a video camera sensitive to low levels of light and a time-lapse video recorder with a sampling frequency of 1 frame/min were used to record the data. Polygraphic data, including EEG, EMG, EOG and ECG were also acquired from each subject. Video recordings were manually analysed frame by frame independent of polygraphic recordings to detect different degrees of movements during sleep. The polygraphic data were analysed using the R&K criteria. Movement patterns from sleep videos were used for estimating sleep latency and prediction of sleep cycles. It was found that in all four subjects, 85.4% of sleep cycle phase transitions were marked by a major movement. 60% of all major movements were observed at the two minute epochs centred between the end of descending NREM and termination of REM phases. The periods of inactivity lasting for more than 35 min were assumed to be a descending NREM episode, and out of 66 such periods, 86.4% were verified as NREM sleep by EEG, the remaining 13.6% were identified as REM. Movements longer than 75 min were assumed to include a REM episode as well as NREM and 75% of such periods were verified to include REM. Smaller movements were seen more frequently during ascending NREM, REM and awake periods.
Balzamo et al. (1998) analysed sleep and wakefulness by scoring video recordings of rhesus monkeys and comparing them with conventional EEG analysis. Simultaneous polysomnograms and video recordings at 1 frame/s were performed on six adult rhesus monkeys (Macaca mulatta) during a 24 h period. Wakefulness, NREM sleep and REM sleep were scored by manual analysis of animal behaviour from video data, using characteristic criteria for each state of vigilance. Results were then compared with those of conventional EEG scoring. Values of the total amount for each state obtained by the two scoring methods during the light and the dark periods were significantly closely related (p ≤ 0.001) with a high correlation coefficient for wakefulness (r1 = 0.999), for NREM sleep (r1 = 0.996) and for REM sleep (r1 = 0.987). Moreover, the epoch by epoch analysis between both methods showed a high concordance with percent agreement values of 95.68% for wakefulness, 93.52% for NREM sleep and 94.02% for REM sleep. The number of REM sleep episodes was similarly defined. The patterns of successive sleep-wake cycles determined from both scorings were superimposable, as were the frequent state changes for the same time segments. The main limitation of the video method was that the four stages of NREM sleep could not be differentiated. These results suggest that the video methodology is relevant as a non-invasive technique and complementary to conventional EEG analysis for sleep studies in rhesus monkeys.
In recent years, with the improvements in the digital video technology, researchers have used computational (automated) video analysis methods to extract sleep activity. Liao & Yang (2008) presented a near-infra-red video-based system to estimate sleep-wake status by detecting human movements and posture. Their method is based on thresholded frame differencing prior to which the video frames are modified to remove the effect of distance from the near-infra-red light source in the changes in the image intensity. Additionally, the motion history image technique (Bradski & Davis 2002) was adopted for finding the direction of the movement. The method is tested on 10 video recordings of subjects with simultaneous PSG studies and acti-watch recordings (only available for 8 of the total 10 studies). PSG assessments of sleep-wake episodes were assumed to be the ground truth. The results showed that the average recognition accuracy using video recordings (92.13%) was slightly higher than recognition accuracy using acti-watch (91.24%).
Cuppens et al. (2010) used optical flow computations (Horn & Schunck 1981) from nocturnal video recordings of paediatric patients with epilepsy to discriminate periods of movement vs. non-movement. Their aim was to find an alternative method of monitoring epileptic seizures to video-EEG which is difficult to use for home monitoring over long periods of time. Their study was performed on nocturnal video recordings of patients from the Child Neurology Department of University Hospital Leven (Belgium). All movements in the video data including epileptic seizures were labelled by an expert and these labels were used for the validation of the proposed method. From the two approaches of having either a global or a variable threshold for distinguishing between movement and non-movements periods, the authors concluded that a variable threshold resulted in improved performance with a SN of 100% and a PPV between 86.21% and 100% on test data using three-fold cross-validation.
Scatena et al. (2012) used an integrated video-analysis system to detect and quantify movements during sleep. The aim of movement detection in their study was to evaluate sleep-wake periods. They used ZoneMinder (http://www.zoneminder.com), an open source video-surveillance application, to get information about each motion event such as the start and end times and the amount of movement (the amount of movement was proportional to changes in pixel values during the event). Video recordings were obtained from 25 healthy volunteers (13 males, 12 females; age = 44.3±18.4 yrs). All subjects underwent laboratory-based video-PSG in the sleep lab of the Department of Neurosciences, Catholic University (Rome, Italy) and wore wrist actigraphs. They first compared four parameters including sleep latency, sleep duration, number of awakenings, and sleep efficiency derived from video data to those derived from actigraphy and PSG recordings using Kendall’s coefficient of concordance (Kendall & Smith 1939). Next, they used the following statistical methods to analyse the agreement between video, actigraphy, and PSG: the Bland-Altman method (Martin Bland & Altman 1986) showed that video derived parameters had a substantial overlap with those obtained from PSG and actigraphy, however, video derived information had a slight tendency to over estimate nocturnal awakenings; an epoch by epoch analysis using Cohen’s κ coefficient (Cohen et al. 1960) showed a moderate amount of agreement between video vs. actigraphy and video vs. PSG (κ = 0.654 and κ = 0.478 respectively); the ACC, SN, and SP of the video derived parameters compared to actigraphy were 83.1%, 89.5%, and 65.4% respectively and the ACC, SN, and SP of the video derived parameters compared to PSG were 79.9%, 90.4%, and 42.3% respectively.
4.8.2. Respiration Analysis
Aside from sleep activity analysis, the use of video recordings for monitoring sleep breathing rhythm has been a key area of focus. Nakajima et al. (2001) developed a real-time monocular vision analysis technique to monitor respiration rate and posture change of a subject in bed without any direct contact. The chest or blanket movement was tracked by using an optical flow method. Their database consisted of one 23 year old male volunteer and five patients at a nursing home (3 males, 2 females) in 7 h monitoring periods. The patients motions were classified into five categories: respiration, cessation of breath, full posture change, limb movement, and out of the view. This monitoring system included a CCD camera and a personal computer equipped with a high-speed image processor. The results were compared with a thermistor in a nasal cavity but no PSG data was available for the study, therefore the authors were not able to diagnose whether the subjects had any abnormal breathing events during the study. The results showed that the system could detect 99.4% of the movements during the period the subjects are monitored.
Takemura et al. (2005) designed a non-contact system to monitor respiratory movements using a fibre grating vision sensor to diagnose and discriminate between OSA and CSA. By measuring the vertical motion of 100 or more sample points of the upper half of the body a respiratory volume change was computed. Apnoea and hypopnoea events were considered to follow two criteria: 1) a more than 50% decrease in the amplitude of a valid measure of breathing from the baseline, where baseline is defined as the mean amplitude of breathing in the two min preceding onset of the event or the mean amplitude of the three largest breaths in two min preceding onset of the event in individuals without a stable breathing pattern; 2) the event lasts more than 10 s. Their automatic classification technique using the respiratory movement was validated on three patients (2 males and 1 female) for all apnoeic events and was validated on two male patients for central apnoea events. The results showed that the error rate of the classification for CSA events was 14.5% and for OSA was 7.6%.
Wang et al. (2006) proposed a method to detect abnormal breathing activities for diagnosis of sleep apnoea. Their method aimed to distinguish respiratory movements from the general body movements of a patient. They made two main assumptions: 1) respiration is a low frequency activity compared to general body movements and 2) the entire surface of the upper frontal body moves in the vertical plane during respiratory movements. Initially, movement shapes which were the differences between the current frame and a reference background frame were created. Then the total number of pixels that were different between the current frame and the background frame was calculated as the degree of motion. By comparing to the old scenes, they determined if the surface had moved back to its original position and detected breathing movements which happen at a slower pace. The technique was tested on two subjects sleeping with three main postures and simulating general breath, obstructive apnoea and body movements, however, no quantification of the test results or the accuracy of the method is presented in the paper.
4.8.3. Body Posture
Several generalised models to detect and track articulations of people from a video sequence have been proposed in the literature (Ramanan et al. 2007, Ferrari et al. 2009), however, monitoring body posture during sleep is particularly challenging since different body parts may be completely occluded or partially visible. Wang et al. (2010) described an automated monocular video monitoring method to recover the posture (head, torso, and upper legs) of a person during sleep and their aim was to specifically tailor their algorithms for sleep monitoring scenarios where head, torso and upper legs may be occluded. Their method was tested on video clips of eight subjects with different skin colour, height, weight, and gender. From these individuals, 32 video clips were filmed with different environment settings such as different illuminations, camera angles, and various occlusion levels. From the 32 video clips, 18 were randomly chosen. The frames were sampled at 0.3 s intervals and 555 frames were randomly selected from these frames for evaluation. The results were compared with a method by Ramanan et al. (2007) designed to identify and track individuals and recover in case the person leaves the view. McNemars statistical test was applied on the outcome of both methods to analyse whether there was a statistically significant difference between the results. The presented results showed that Wang et al.’s method outperformed Ramanan’s in detecting head, torso, and lower body, however, the full analyses tables are ambiguous due to missing title and labels.
4.8.4. Analysis of Sleep Disorders
Classification of sleep disorders based on differences between normal sleep activity versus sleep activity which is typically associated with certain sleep disturbances may be the new and next step to the automated analysis of sleep video data. Gederi & Clifford (2012) studied a technique to use low-cost offbody cameras for the automated screening of OSA. They used the video recordings of 21 PSG studies, 11 from patients with OSA at different severity levels (9 males, 2 females; age = 52.7±11.2 yrs; neck size = 17.7±2.0 inches; BMI = 35.2±8.0 kg/m2) and 10 from patients who were referred to the hospital with suspected OSA but were diagnosed as normal (8 males, 2 females; age = 46.7±10.6 yrs; neck size = 16.4±2.1 inches; BMI = 29.6±9.0 kg/m2). The activity signal of each patient was derived from the video recordings using a consecutive frame differencing technique. To investigate the regularity of patterns of movement between patients with and without OSA, the complexity of the activity signals were scored using multi-scale entropy analysis. A 5-fold cross validation technique was used to train a SVM with the calculated complexity scores and validate the classifier. Their results showed that patients with OSA can be differentiated from non-OSA patients with 90% ACC (SN 80%, SP 100%). Moreover, an OSA severity score was derived from the probability estimates of the SVM classifier and was compared to the ODI taken from PSG studies. The comparison showed that the severity scores from SVM probability are better indicators of OSA severity for patients with moderate and severe OSA than ODI.
4.9. mHealth and Mobile Phone-based Systems
The recent widespread adoption of ‘smart’ mobile phones, with multiple built-in sensors, has led to an explosion of applications to monitor sleep quality on the phone. All currently available smart phone applications (or ‘apps’) for OSA detection use some combination of a screening questionnaire, actigraphy from the in-built accelerometer, and an analysis of the audio signal recorded from the phone’s in-built microphone or hands-free kit. However, multiple issues currently exist with all these apps. First and foremost is that none of the current apps are based on any published scientific evidence. Second, the placement of the accelerometer (and hence phone) is crucial, although no app currently requires the user to place it in a particular location. Third, the location of the microphone and its characteristic acoustic recording properties will cause enormous variations in the quality of the analysis. Moreover, the varying quality of audio processing cards on phones can lead to significant distortions in the recordings. Therefore, to-date, no standardised system has been developed for a mobile phone which can produce reliable and scientifically valid outputs. Finally, in order to provide a screening system, valid for a general populous, it will be important to adjust the system to be relevant to populations outside of a standard clinic. A review of the apps currently available can be found in (Behar et al. 2013b) and a prototype for an OSA screening app can be found in (Behar & Clifford 2011, Behar et al. 2013a), which uses features derived from audio, accelerometry and pulse oximetry and a support vector machine to generate a probability that a patient has OSA. They have used questionnaires, audio, on-body actigraphy and video actigraphy from the clinical data and had variable results. However, the prototype described in (Behar & Clifford 2011) currently uses a modified version of the STOP BANG questionnaire, audio and on-body actigraphy recorded using the in-built microphone and accelerometer. The results on the clinical data have been promising, and once applied to data collected using the phone, will provide the first clinically validated phone app for OSA screening.
5. Discussion and Conclusions
The field of sleep analysis is complex and multi-faceted, with monitoring applications almost always involving several different sensor types, depending on the suspected conditions and to some extent, the local culture. Although EEG monitoring (along with EOG and EMG) is considered the gold standard approach for monitoring brain activity during sleep, it is insufficient on its own for many sleep conditions, and measurements of respiration, HR, and oxygen saturation are often required.
However, modern signal processing tools, coupled with faster and cheaper processing hardware, are opening up opportunities to provide rapid first-level screening using equipment and signals that were once considered only as adjuncts to sleep analysis (such as ECG and audio recordings). Furthermore, improved video processing software and hardware is beginning to allow automation of a monitoring paradigm that was once the exclusive purview of clinical experts (i.e. visual review). In particular, modern data fusion and machine learning techniques provide the possibility to combine disparate measures of physiology into a coherent global picture of sleep health. It should be noted that the scientific literature is mostly comprised of almost anecdotal studies with patient class sizes ranging from single digits to less than 10 or 20. Systematic studies on larger cohorts of patients are needed to evaluate properly many of the now automated analysis modalities.
Debate has occurred over the years regarding which signals are crucial to monitor for the adequate assessment of patients with sleep complaints. In general the addition of more channels/signals provides more data but adds to the burden of the patient particularly if the equipment is cumbersome. A trend has occurred in Europe and more recently in the United States whereby home sleep testing (HST) is being performed rather than in-laboratory PSG. The potential advantages of HST include reduced cost (compared to the requirement to bring the patient into an inpatient facility), the familiarity of the surroundings for the patient who may sleep poorly in an unfamiliar environment, and the possibility of recording multiple consecutive nights to provide more representative data than from a single night recording. However, critics of the HST suggest that the extra data provided by in-laboratory PSG (which includes the EEG) may justify the extra cost/burden to the patient. A general consensus has emerged that HST is acceptable for most patients, although the pros and cons of EEG continue to be discussed. The EEG has limitations beyond the inconvenience and expense required to obtain the data. Some studies suggest that the reproducibility of the findings from EEG may be modest compared to signals such as pulse oximetry which can be quantified objectively (Kuna et al. 2012). In addition, EEG measures such as the arousal frequency are relatively poor predictors of clinical outcomes such as sleepiness or cardiovascular risk. As a result, some have advocated for simpler measures without the need for EEG (Bennett et al. 1998). On the other hand, some data suggest that the optimal metrics might depend on the outcome of interest. That is, for the myriad of complications which have been attributed to OSA, one might not expect a single variable to predict all the various complications (e.g. hypertension, diabetes, myocardial infarction, cardiovascular risk, memory impairment, etc.) Thus, it has been suggested that the optimal definition of sleep apnoea might depend on the outcome of interest. For example, desaturations of 4% or greater may be predictive of cardiovascular risk, whereas desaturations of 2% or greater might the optimal predictor of insulin resistance (Punjabi et al. 2008, Stamatakis et al. 2008). Djonlagic et al. (2012) have recently shown that the frequency of arousal (as determined by the EEG) may be a better predictor of memory consolidation than measures of desaturation. Thus, the optimal variable(s) to record during sleep remain unclear despite substantial ongoing research; the ultimate answer might depend on the clinical outcome of interest. Cost considerations and improvements in technology (e.g. simplified EEG recorders) may also help to define the future standard of care.
The use of home testing has been compared with PSG and tested favourably with regards to clinical outcome for sleep aponea, but its utility with other sleep disorders such as insomnia or other movement disorders is less clear. We also note the surge of recreational sleep monitoring (e.g. the ‘Quantified Self’ movement) due to the proliferation of cheap devices. In particular, the rapid adoption of smartphones has led to a proliferation of apps which allow a general user to have easy access to some form of self-applied monitoring. Great caution should be taken with such approaches, as there is no regulation or quality control of such apps and devices, and relatively little scientific evaluation of their performances, particularly with respect to the enormous heterogeneity of hardware and possible methods of use. However, their existence, if calibrated appropriately and used in conjunction with proper decision support, these new developments may spur cost-effective large-scale data collection and screening, and lead to a deeper understanding of society’s sleep-related problems.
Acknowledgements
The authors would also like to acknowledge the support the funding agencies: AR, EG and MO acknowledge the support of the RCUK Digital Economy Programme grant number EP/G036861/1 (Oxford Centre for Doctoral Training in Healthcare Innovation). VM acknowledges the support of CIBER-BBN, nanced by the Instituto de Salud Carlos III with assistance from the European Regional Development Fund (Spain), and Projects TEC2010-21703-C03-02 of Ministerio de Ciencia e Innovacion (MICINN) and GTC T-30 from DGA (Spain). JB acknowledges the support of the Engineering and Physical Sciences Research Council and the Balliol French Anderson Scholarship Fund. AM is funded by National Institutes of Health and American Heart Association. TP received funding from the Technical University of Sydney, grant no. LP100200842, The Sino-German Center for Research Promotion, grant no. GZ 538, the German Ministry for Education and Research, grant no. 01EZ1132. GC acknowledges support of the Wellcome Trust through Centre Grant No. 098461/Z/12/Z (Sleep, Circadian Rhythms & Neuroscience Institute), and the EPSRC through grant EP/K020161/1 (Multiscale markers of circadian rhythm changes for monitoring of mental health).
Glossary
- AARC-APT
American Association of Respiratory Care - Association of Polysomnography Technologists
- AASM
American Academy of Sleep Medicine
- AC
Alternating Current, pulsatile waveform
- ACC
Accuracy
- AHI
Apnoea Hypopnoea Index, the average number of apnoeas and hypopnoeas per hour of sleep
- AIS
Athens Insomnia Scale
- APAP
Autopositive Airway Pressure
- AR
Autoregression
- ASPS
Advanced Sleep Phase Syndrome
- BiPAP
Bilevel Positive Airway Pressure
- BMI
Body Mass Index, a proxy for measuring body fat based on an individuals height and weight
- BP
Blood Pressure
- BQ
Berlin Questionnaire
- CAP
Cyclic Alternating Pattern
- CBT
Core Body Temperature
- CNS
Central Nervous System
- CPAP
Continuous Positive Airway Pressure
- CPC
Cardiopulmonary Coupling
- CRC
Cardiorespiratory Coupling
- CRDs
Circadian Rhythm Disorders
- CSA
Central Sleep Apnoea
- DAP
Decreases in the amplitude of the photoplethysmogram signal during polysomnography
- DC
Direct Current
- DIST
Distal Skin Temperature
- DSPS
Delayed Sleep Phase Syndrome
- ECG
Electrocardiogram
- EDR
Electrocardiogram Derived Respiration
- EDS
Excessive Daytime Sleepiness
- EEG
Electroencephalogram
- EMG
Electromyogram
- EOG
Electrooculogram
- ESS
Epworth Sleepiness Scale
- HMM
Hidden Markov Model
- HR
Heart Rate
- HRV
Heart Rate Variability
- HST
Home Sleep Test
- ICSD
International Classification of Sleep Disorders
- IP
Impedance Pneumography
- MAD
Mandibular Advancement devices, tongue trusses
- NCAP
Non Cyclic Alternating Pattern
- NPV
Negative Predictive Value
- NREM
Non Rapid Eye Movement
- OA
Oral Appliance
- ODI
Oxygen Desaturation Index, the average number of oxygen desaturations per hour of sleep
- OHS
Obesity Hypoventilation Syndrome
- OSA
Obstructive Sleep Apnoea
- OSAS
Obstructive Sleep Apnoea Syndrome
- PAT
Peripheral Arterial Tonometry
- PPG
Photoplethysmogram
- PPV
Positive Predictive Value
- PR
Photoplethysmogram-derived Heart Rate
- PROX
Proximal Skin Temperature
- PSG
Polysomnogram, overnight sleep study
- PTT
Pulse Transit Time
- RDI
Respiratory Disturbance Index
- REM
Rapid Eye Movement
- RIP
Respiratory Inductance Plethysmography
- RMS
Root Mean Square
- RSA
Respiratory Sinus Arrhythmia
- SAS
Sleep Apnoea Syndrome
- SDB
Sleep Disordered Breathing
- SN
Sensitivity
- SP
Specificity
- SpO2
indirect measure of blood oxygen saturation from pulse oximetry
- STOP BANG
A questionnaire used to identify the presence of obstructive sleep apnoea
- SWS
Slow Wave Sleep
- SWSD
Shift Work Sleep Disorder
- TRDs
Tongue Retaining Devices
- TST
Total Sleep Time
- UA
Upper Airway
- UARS
Upper Airway Resistance Syndrome
- US
United States
Footnotes
Dedication
This article is dedicated to the memory of Joe Mietus, who spent his life in the service of cardiorespiratory analysis, often with a focus in the field of sleep. His friendship, hard work, persistence and exceptional skills will be sadly missed.
amount of actual sleep time in a sleep attempt (or sleep period); equal to total sleep period less movement and awake time. Total sleep time is the total of all REM and NREM sleep in a sleep period.
Bed wetting during the night. See Warrell et al. (2003) for a full definition.
Teeth grinding. See Warrell et al. (2003) for a full definition.
Named after the eight questions which comprise the test: Snoring, Tired, Observed, Blood pressure, BMI, Age, Neck circumference, Gender.
the Respiratory Disturbance Index which is comprised of the Apnoea Hypopnoea Index (AHI) (the average number of apnoeas and hypopnoeas per hour (see section 2.4 for more details)) plus any other occurrence that may disrupt sleep.
a proxy for measuring body fat based on an individual’s height and weight.
The ‘10’ and ‘20’ refer to the fact that the actual distances between adjacent electrodes are either 10% or 20% of the total front-back or right-left distance of the skull.
both spontaneously and in response to both internal and external stimuli such as respiratory, tactile and audio events
a statistical measure of inter-rater agreement or inter-annotator agreement for categorical items
The acceleration of the HR resulting from increased BP in, or increased distension of, the large systemic veins and the right upper chamber of the heart which prevents the pooling of blood in the venous system (Dorland 2003).
Even when all data associated with the apnoeic episodes were excluded.
Formant frequencies appear where there is a concentration of acoustic energy around a particular frequency in the acoustic wave
MFCCs make up a Mel-frequency cepstrum which is a representation of the short-term power spectrum of a sound, based on a linear cosine transform of a log power spectrum on a non-linear mel scale of frequency
References
- Oksenberg A, Khamaysi I, Silverberg DS, Tarasiuk A. Association of body position with severity of apneic events in patients with severe nonpositional obstructive sleep apnea. Chest. 2000;118(4):1018–1024. doi: 10.1378/chest.118.4.1018. [DOI] [PubMed] [Google Scholar]
- AARC-APT. AARC-APT clinical practice guideline. Polysomnography. Respir Care. 1995;40(12):1336–1343. [PubMed] [Google Scholar]
- Aaronson S, Rashed S, Biber M, Hobson J. Brain state and body position: a time-lapse video study of sleep. Arch Gen Psychiat. 1982;39(3):330–335. doi: 10.1001/archpsyc.1982.04290030062011. [DOI] [PubMed] [Google Scholar]
- AASM. The International Classification of Sleep Disorders: Diagnostic and Coding Manual. second edn. AASM; 2005. [Google Scholar]
- Abeyratne U, Patabandi C, Puvanendran K. Pitch-jitter analysis of snoring sounds for the diagnosis of sleep apnea. Engineering in Medicine and Biology Society, 2001; Proceedings of the 23rd Annual International Conference of the IEEE; IEEE; 2001. pp. 2072–2075. [Google Scholar]
- Abeyratne UR, Karunajeewa AS, Hukins C. Mixed-phase modeling in snore sound analysis. Med Biol Eng Comput. 2007;45(8):791–806. doi: 10.1007/s11517-007-0186-x. [DOI] [PubMed] [Google Scholar]
- Abeyratne UR, Wakwella AS, Hukins C. Pitch jump probability measures for the analysis of snoring sounds in apnea. Physiol Meas. 2005;26(5):779–798. doi: 10.1088/0967-3334/26/5/016. [DOI] [PubMed] [Google Scholar]
- Ahmadi N, Chung S, Gibbs A, Shapiro C. The berlin questionnaire for sleep apnea in a sleep clinic population: relationship to polysomnographic measurement of respiratory disturbance. Sleep Breath. 2008;12(1):39–45. doi: 10.1007/s11325-007-0125-y. [DOI] [PubMed] [Google Scholar]
- Ahmed B, Redissi A, Tafreshi R. An automatic sleep spindle detector based on wavelets and the teager energy operator. Engineering in Medicine and Biology Society, 2009. EMBC 2009; Annual International Conference of the IEEE; IEEE; 2009. pp. 2596–2599. [DOI] [PubMed] [Google Scholar]
- Aldrich MS. Automobile accidents in patients with sleep disorders. Sleep. 1989;12(6):487–494. doi: 10.1093/sleep/12.6.487. [DOI] [PubMed] [Google Scholar]
- Allen J. Photoplethysmography and its application in clinical physiological measurement. Physiol Meas. 2007;28(3):R1–R39. doi: 10.1088/0967-3334/28/3/R01. [DOI] [PubMed] [Google Scholar]
- Alvarez D, Hornero R, Marcos JV, del Campo F. Multivariate analysis of blood oxygen saturation recordings in obstructive sleep apnea diagnosis. IEEE T Bio-Med Eng. 2010;57(12):2816–2824. doi: 10.1109/TBME.2010.2056924. [DOI] [PubMed] [Google Scholar]
- Ancoli-Israel S, Cole R, Alessi C, Chambers M, Moorcroft W, Pollak CP. The role of actigraphy in the study of sleep and circadian rhythms. Sleep. 2003;26(3):342–392. doi: 10.1093/sleep/26.3.342. [DOI] [PubMed] [Google Scholar]
- Anderer P, Roberts S, Schlögl A, Gruber G, Herrmann GKW, Rappelsberger P, Filz O, Barbanoj MJ, Dorffner G, Saletu B. Artifact processing in computerized analysis of sleep eeg - a review. Neuropsychobiology. 1999;40(3):150–157. doi: 10.1159/000026613. [DOI] [PubMed] [Google Scholar]
- Anders T, Sostek A. The use of time lapse video recording of sleep-wake behavior in human infants. Psychophysiology. 1976;13(2):155–158. doi: 10.1111/j.1469-8986.1976.tb00092.x. [DOI] [PubMed] [Google Scholar]
- Antic NA, Buchan C, Esterman A, Hensley M, Naughton MT, Rowland S, Williamson B, Windler S, Eckermann S, McEvoy RD. A randomized controlled trial of nurse-led care for symptomatic moderate-severe obstructive sleep apnea. Am J Resp Crit Care. 2009;179(6):501–508. doi: 10.1164/rccm.200810-1558OC. [DOI] [PubMed] [Google Scholar]
- Artstein R, Poesio M. Bias decreases in proportion to the number of annotators. Proc of FG-MoL. 2005:139–148. [Google Scholar]
- Aschoff J. Circadian control of body temperature. J Therm Biol. 1983;8(1–2):143–147. [Google Scholar]
- Aserinsky E, Kleitman N. Regularly occurring periods of eye motility, and concomitant phenomena, during sleep. Science. 1953;118(3062):273–274. doi: 10.1126/science.118.3062.273. [DOI] [PubMed] [Google Scholar]
- Atal B, Hanauer S. Speech analysis and synthesis by linear prediction of the speech wave. J Acoust Soc Am. 1971;50(2):637–655. doi: 10.1121/1.1912679. [DOI] [PubMed] [Google Scholar]
- Baim D, Colucci W, Monrad E, Smith H, Wright R, Lanoue A, Gauthier D, Ransil B, Grossman W, Braunwald E. Survival of patients with severe congestive heart failure treated with oral milrinone. J Am Coll Cardiol. 1986;7(3):661–670. doi: 10.1016/s0735-1097(86)80478-8. [DOI] [PubMed] [Google Scholar]
- Balzamo E, Beers PV, Lagarde D. Scoring of sleep and wakefulness by behavioral analysis from video recordings in rhesus monkeys: comparison with conventional EEG analysis. Electroen Clin Neuro. 1998;106(3):206–212. doi: 10.1016/s0013-4694(97)00152-1. [DOI] [PubMed] [Google Scholar]
- Banno K, Kryger M. Use of polysomnography with synchronized digital video recording to diagnose pediatric sleep breathing disorders. Cab Med Assoc J. 2005;173(1):28–30. doi: 10.1503/cmaj.1041413. [DOI] [PMC free article] [PubMed] [Google Scholar]
- Bar A, Pillar G, Dvir I, Sheffy J, Schnall RP, Lavie P. Evaluation of a portable device based on peripheral arterial tone for unattended home sleep studies. Chest. 2003;123(3):695–703. doi: 10.1378/chest.123.3.695. [DOI] [PubMed] [Google Scholar]
- Barker SJ. Motion-Resistant pulse oximetry: a comparison of new and old models. Anesth Analg. 2002;95(4):967–972. doi: 10.1097/00000539-200210000-00033. [DOI] [PubMed] [Google Scholar]
- Bearpark H, Elliott L, Grunstein R, Cullen S, Schneider H, Althaus W, Sullivan C. Snoring and sleep apnea. A population study in Australian men. Am J Resp Crit Care. 1995;151(5):1459–1465. doi: 10.1164/ajrccm.151.5.7735600. [DOI] [PubMed] [Google Scholar]
- Behar J, Clifford GD. Master’s thesis. University of Oxford; 2011. Analysis of accelerometer data for apnea screening. [Google Scholar]
- Behar J, et al. An evidence based android osa screening application. Comput Cardiol. 2013a [Google Scholar]
- Behar J, et al. A review of current sleep screening applications for smartphones. Physiol Meas. 2013b;34(7):R29–R46. doi: 10.1088/0967-3334/34/7/R29. [DOI] [PubMed] [Google Scholar]
- Ben-Israel N, Tarasiuk A, Zigel Y. Obstructive apnea hypopnea index estimation by analysis of nocturnal snoring signals in adults. Sleep. 2012;35(9):1299. doi: 10.5665/sleep.2092. [DOI] [PMC free article] [PubMed] [Google Scholar]
- Bennett LS, Langford BA, Stradling JR, Davies RJ. Sleep fragmentation indices as predictors of daytime sleepiness and ncpap response in obstructive sleep apnea. Am J Resp Crit Care. 1998;158(3):778–786. doi: 10.1164/ajrccm.158.3.9711033. [DOI] [PubMed] [Google Scholar]
- Berger AM, Wielgus KK, Young-McCaughan S, Fischer P, Farr L, Lee KA. Methodological challenges when using actigraphy in research. J Pain Symptom Manage. 2008;36(2):191–199. doi: 10.1016/j.jpainsymman.2007.10.008. [DOI] [PMC free article] [PubMed] [Google Scholar]
- Bernardi L, Wdowczyk-Szulc J, Valenti C, Castoldi S, Passino C, Spadacini G, Sleight P. Effects of controlled breathing, mental activity and mental stress with or without verbalization on heart rate variability. J Am Coll Cardiol. 2000;35(6):1462–1469. doi: 10.1016/s0735-1097(00)00595-7. [DOI] [PubMed] [Google Scholar]
- Berthomier C, Drouot X, Herman-Stoïca M, Berthomier P, Prado J, Bokar-Thire D, Benoit O, Mattout J, d’Ortho MP. Automatic analysis of single-channel sleep eeg: validation in healthy individuals. Sleep. 2007;30(11):1587. doi: 10.1093/sleep/30.11.1587. [DOI] [PMC free article] [PubMed] [Google Scholar]
- Bixler EO, Kales A, Soldatos C, Kales J, Healey S. Prevalence of sleep disorders in the Los Angeles metropolitan area. Am J Psychiat. 1979;136(10):1257–1262. doi: 10.1176/ajp.136.10.1257. [DOI] [PubMed] [Google Scholar]
- Bixler EO, Vgontzas AN, Lin HM, Ten Have T, Rein J, Vela-Bueno A, Kales A. Prevalence of sleep-disordered breathing in women. Effects of gender. Am J Resp Crit Care. 2001;163(3):608–613. doi: 10.1164/ajrccm.163.3.9911064. [DOI] [PubMed] [Google Scholar]
- Bradski G, Davis J. Motion segmentation and pose recognition with motion history gradients. Mach Vision Appl. 2002;13(3):174–184. [Google Scholar]
- Brzezinski A. Mechanisms of disease: melatonin in humans. New Engl J Med. 1997;336(3):186–195. doi: 10.1056/NEJM199701163360306. [DOI] [PubMed] [Google Scholar]
- Caffarel J, Gibson GJ, Harrison JP, Griffiths CJ, Drinnan MJ. Comparison of manual sleep staging with automated neural network-based analysis in clinical practice. Medical Biol Eng Comput. 2006;44(1–2):105–110. doi: 10.1007/s11517-005-0002-4. [DOI] [PubMed] [Google Scholar]
- Cagnacci A, Kruchi K, Wirz-Justice A, Volpe A. Homeostatic versus circadian effects of melatonin on core body temperature in humans. J Biol Rhythms. 1997;12(6):509–517. doi: 10.1177/074873049701200604. [DOI] [PubMed] [Google Scholar]
- Cartwright R, Stefoski D, Caldarelli D, Kravitz H, Knight S, Lloyd S, Samelson C. Toward a treatment logic for sleep apnea: the place of the tongue retaining device. Behaviour research and therapy. 1988;26(2):121–126. doi: 10.1016/0005-7967(88)90111-8. [DOI] [PubMed] [Google Scholar]
- Cavusoglu M, Kamasak M, Erogul O, Ciloglu T, Serinagaoglu Y, Akcam T. An efficient method for snore/nonsnore classification of sleep sounds. Physiol Meas. 2007;28(8):841–853. doi: 10.1088/0967-3334/28/8/007. [DOI] [PubMed] [Google Scholar]
- Challoner AV. Photoelectric plethysmography for estimating cutaneous blood flow. Non-invasive physiological measurements. 1979;1:125–151. [Google Scholar]
- Chambrin MC. Alarms in the intensive care unit: How can the number of false alarms be reduced? Crit Care. 2001;5(4):184–188. doi: 10.1186/cc1021. [DOI] [PMC free article] [PubMed] [Google Scholar]
- Chen Y, Wen C, Tao G, Bi M. Continuous and noninvasive measurement of systolic and diastolic blood pressure by one mathematical model with the same model parameters and two separate pulse wave velocities. Ann Biomed Eng. 2012;40(4):871–882. doi: 10.1007/s10439-011-0467-2. [DOI] [PubMed] [Google Scholar]
- Cho HJ, Lavretsky H, Olmstead R, Levin MJ, Oxman MN, Irwin MR. Sleep disturbance and depression recurrence in community-dwelling older adults: a prospective study. Am J Psychiat. 2008;165(12):1543–1550. doi: 10.1176/appi.ajp.2008.07121882. [DOI] [PMC free article] [PubMed] [Google Scholar]
- Chua ECP, Redmond SJ, McDarby G, Heneghan C. Towards using photo-plethysmogram amplitude to measure blood pressure during sleep. Ann Biomed Eng. 2010;38(3):945–954. doi: 10.1007/s10439-009-9882-z. [DOI] [PubMed] [Google Scholar]
- Chung F, Yegneswaran B, Liao P, Chung SA, Vairavanathan S, Islam S, Khajehdehi A, Shapiro CM. STOP questionnaire: a tool to screen patients for obstructive sleep apnea. Anesthesiology. 2008;108(5):812–821. doi: 10.1097/ALN.0b013e31816d83e4. [DOI] [PubMed] [Google Scholar]
- Clifford GD. PhD thesis. University of Oxford; 2002. Signal Processing Methods for Heart Rate Variability. [Google Scholar]
- Clifford GD, Azuaje F, McSharry PE. Advanced methods and tools for ECG data analysis. Cambridge, MA: Artech House; 2006. [Google Scholar]
- Clifford GD, McSharry PE, Tarassenko L. Characterizing artefact in the normal human 24-hour RR time sieries to aid identification and artificial replication of circadian variations in human beat to beat heart reate using a simple threshold. Comput Cardiol. 2002;29:129–132. [Google Scholar]
- Clifford GD, Tarassenko L. Segmenting cardiac-related data using sleep stages increases separation between normal subjects and apnoeic patients. Physiol Meas. 2004;25(6):N27–N35. doi: 10.1088/0967-3334/25/6/n03. [DOI] [PubMed] [Google Scholar]
- Clifford GD, Tarassenko L. Quantifying errors in spectral estimates of HRV due to beat replacement and resampling. IEEE T Bio-Med Eng. 2005a;52(4):630–638. doi: 10.1109/TBME.2005.844028. [DOI] [PubMed] [Google Scholar]
- Clifford GD, Tarassenko L. Quantifying errors in spectral estimates of HRV due to beat replacement and resampling. IEEE T Bio-Med Eng. 2005b;52(4):630–638. doi: 10.1109/TBME.2005.844028. [DOI] [PubMed] [Google Scholar]
- Clifford GD, Zapanta L, Janz B, Mietus J, Mark R. Segmentation of 24-Hour Cardiovascular Activity Using ECG-Based Sleep/Sedation and Noise Metrics. Comput Cardiol. 2005;32:595–598. [Google Scholar]
- Cohen J, et al. A coefficient of agreement for nominal scales. Educ Psechol Meas. 1960;20(1):37–46. [Google Scholar]
- Cohn MA, Rao AS, Broudy M, Birch S, Watson H, Atkins N, Davis B, Stott FD, Sackner MA, et al. The respiratory inductive plethysmograph: a new non-invasive monitor of respiration. B Eur Physiopath Res. 1982;18(4):643–658. [PubMed] [Google Scholar]
- Cole RJ, Kripke DF, Gruen W, Mullaney DJ, Gillin JC. Automatic sleep/wake identification from wrist activity. Sleep. 1992;15(5):461–469. doi: 10.1093/sleep/15.5.461. [DOI] [PubMed] [Google Scholar]
- Collop NA, Tracy SL, Kapur V, Mehra R, Kuhlmann D, Fleishman SA, Ojile JM. Obstructive sleep apnea devices for out-of-center (OOC) testing: technology evaluation. J Clin Sleep Med. 2011;7(5):531–548. doi: 10.5664/JCSM.1328. [DOI] [PMC free article] [PubMed] [Google Scholar]
- Collop N, Anderson WM, Boehlecke B, Claman D, Goldberg R, Gottlieb D, Hudgel D, Sateia M, Schwab R. Clinical guidelines for the use of unattended portable monitors in the diagnosis of obstructive sleep apnea in adult patients. J Clin Sleep Med. 2007;3(7):737–747. [PMC free article] [PubMed] [Google Scholar]
- Costa M, Peng C, Goldberger A, Hausdorff J. Multiscale entropy analysis of human gait dynamics. Physica A. 2003;330(1–2):53–60. doi: 10.1016/j.physa.2003.08.022. [DOI] [PMC free article] [PubMed] [Google Scholar]
- Crawford C. Sleep recording in the home with automatic analysis of results. Eur Neurol. 1986;25(2):30–35. doi: 10.1159/000116078. [DOI] [PubMed] [Google Scholar]
- Crowell D, Brooks L, Colton T, Corwin M, Hoppenbrouwers T, Hunt C, Kapuniai L, Lister G, Neuman M, Peucker M, Ward S, Weese-Mayer D, Willinger M. Infant polysomnography: reliability. collaborative home infant monitoring evaluation (chime) steering committee. Sleep. 1997;20(7):553–560. [PubMed] [Google Scholar]
- Cuppens K, Lagae L, Ceulemans B, Van Huffel S, Vanrumste B. Automatic video detection of body movement during sleep based on optical flow in pediatric patients with epilepsy. Med Biol Eng Comput. 2010;48(9):923–931. doi: 10.1007/s11517-010-0648-4. [DOI] [PubMed] [Google Scholar]
- Dalmasso F, Prota R. Snoring: analysis, measurement, clinical implications and applications. Eur Respir J. 1996;9(1):146–159. doi: 10.1183/09031936.96.09010146. [DOI] [PubMed] [Google Scholar]
- Davis S, Mermelstein P. Comparison of parametric representations for monosyllabic word recognition in continuously spoken sentences. IEEE T Acoust Speech. 1980;28(4):357–366. [Google Scholar]
- Djonlagic I, Saboisky J, Carusona A, Stickgold R, Malhotra A. Increased sleep fragmentation leads to impaired off-line consolidation of motor memories in humans. PloS one. 2012;7(3):e34106. doi: 10.1371/journal.pone.0034106. [DOI] [PMC free article] [PubMed] [Google Scholar]
- Dorland N. Dorland’s Illustrated Medical Dictionary, Deluxe Edition. W.B. Saunders Company; 2003. [Google Scholar]
- Duckitt W, Tuomi S, Niesler T. Automatic detection, segmentation and assessment of snoring from ambient acoustic data. Physiol Meas. 2006;27(10):1047–1056. doi: 10.1088/0967-3334/27/10/010. [DOI] [PubMed] [Google Scholar]
- Earley CJ. Restless legs syndrome. New Engl J Med. 2003;348(21):2103–2109. doi: 10.1056/NEJMcp021288. [DOI] [PubMed] [Google Scholar]
- Eckert DJ, Malhotra A. Pathophysiology of adult obstructive sleep apnea. Proceedings of the American Thoracic Society. 2008;5(2):144. doi: 10.1513/pats.200707-114MG. [DOI] [PMC free article] [PubMed] [Google Scholar]
- Ehlert I, Danker-Hopfe H, Höller L, Von Rickenbach P, Baumgart-Schmitt R, Herrmann W. A comparison between EEG-Recording and Scoring by QUISI Version 1.0 and Standard PSG with visual scoring. Somnologie-Schlafforschung und Schlafmedizin. 1998;2(3):104–116. [Google Scholar]
- Elbaz M, Roue GM, MD FL, Salva M. Utility of actigraphy in the diagnosis of obstructive sleep apnea. Sleep. 2002;25(5):525–529. [PubMed] [Google Scholar]
- Enright J. The search for rhythmicity in biological time-series. J Theor Biol. 1965;8(3):426–468. doi: 10.1016/0022-5193(65)90021-4. [DOI] [PubMed] [Google Scholar]
- Ferber R, Millman R, Coppola M, Fleetham J, Murray CF, Iber C, McCall V, Nino-Murcia G, Pressman M, Sanders M, et al. Portable recording in the assessment of obstructive sleep apnea. ASDA standards of practice. Sleep. 1994;17(4):378. doi: 10.1093/sleep/17.4.378. [DOI] [PubMed] [Google Scholar]
- Ferguson KA, Cartwright R, Rogers R, Schmidt-Nowara W. Oral appliances for snoring and obstructive sleep apnea: a review. Sleep. 2006;29(2):244–262. doi: 10.1093/sleep/29.2.244. [DOI] [PubMed] [Google Scholar]
- Ferrari V, Marín-Jiménez M, Zisserman A. Statistical and Geometrical Approaches to Visual Motion Analysis. Springer; 2009. pp. 128–147. [Google Scholar]
- Ferri R, Bruni O, Miano S, Smerieri A, Spruyt K, Terzano MG. Inter-rater reliability of sleep cyclic alternating pattern (cap) scoring and validation of a new computer-assisted cap scoring method. Clin Neurophysiol. 2005;116(3):696–707. doi: 10.1016/j.clinph.2004.09.021. [DOI] [PubMed] [Google Scholar]
- Ferri R, Parrino L, Smerieri A, Terzano MG, Elia M, Musumeci SA, Pettinato S, Stam CJ. Non-linear eeg measures during sleep: effects of the different sleep stages and cyclic alternating pattern. Int J Psychophysiol. 2002;43(3):273–286. doi: 10.1016/s0167-8760(02)00006-5. [DOI] [PubMed] [Google Scholar]
- Finer N, Leone T. Oxygen saturation monitoring for the preterm infant: the evidence basis for current practice. Pediatr Res. 2009;65(4):375–380. doi: 10.1203/PDR.0b013e318199386a. [DOI] [PubMed] [Google Scholar]
- Fischer Y, Junge-hülsing B, Rettinger G, Panis A. The use of an ambulatory, automatic sleep recording device (quisi™ version 1.0) in the evaluation of primary snoring and obstructive sleep apnoea. Clin Otolaryngol. 2004;29(1):18–23. doi: 10.1111/j.1365-2273.2004.00759.x. [DOI] [PubMed] [Google Scholar]
- Fiz JA, Jané R, Solà-Soler J, Abad J, García M, Morera J. Continuous analysis and monitoring of snores and their relationship to the apnea-hypopnea index. Laryngoscope. 2010;120(4):854–862. doi: 10.1002/lary.20815. [DOI] [PubMed] [Google Scholar]
- Fiz J, Abad J, Jané R, Riera M, Mananas M, Caminal P, Rodenstein D, Morera J. Acoustic analysis of snoring sound in patients with simple snoring and obstructive sleep apnoea. Eur Respir J. 1996;9(11):2365–2370. doi: 10.1183/09031936.96.09112365. [DOI] [PubMed] [Google Scholar]
- Fleming SG, Tarassenko L. A comparison of signal processing techniques for the extraction of breathing rate from the photoplethysmogram. Int J Biol Med Sci. 2007;2(4):232–236. [Google Scholar]
- Flemons W, Reimer M. Development of a Disease-specific Health-related Quality of Life Questionnaire for Sleep Apnea. Am J Respir Crit Care Med. 1998;158:494–503. doi: 10.1164/ajrccm.158.2.9712036. [DOI] [PubMed] [Google Scholar]
- Flemons WW, Douglas NJ, Kuna ST, Rodenstein DO, Wheatley J. Access to diagnosis and treatment of patients with suspected sleep apnea. Am J Resp Crit Care. 2004;169(6):668–672. doi: 10.1164/rccm.200308-1124PP. [DOI] [PubMed] [Google Scholar]
- Flemons WW, Littner MR, Rowley JA, Gay P, Anderson WM, Hudgel DW, McEvoy RD, Loube DI. Home diagnosis of sleep apnea: A systematic review of the literature. Chest. 2003;124(4):1543–1579. doi: 10.1378/chest.124.4.1543. [DOI] [PubMed] [Google Scholar]
- Folke M, Cernerud L, Ekström M, Hök B. Critical review of non-invasive respiratory monitoring in medical care. Med Biol Eng Comput. 2003;41(4):377–383. doi: 10.1007/BF02348078. [DOI] [PubMed] [Google Scholar]
- Fontenla-Romero O, Guijarro-Berdiñas B, Alonso-Betanzos A, Moret-Bonillo V. A new method for sleep apnea classification using wavelets and feedforward neural networks. Artif Intell Med. 2005;34(1):65–76. doi: 10.1016/j.artmed.2004.07.014. [DOI] [PubMed] [Google Scholar]
- Foster R, Wulff K. The rhythm of rest and excess. Nat Rev Neurosci. 2005;6(5):407–414. doi: 10.1038/nrn1670. [DOI] [PubMed] [Google Scholar]
- Fraiwan L, Lweesy K, Khasawneh N, Fraiwan M, Wenz H, Dickhaus H. Time frequency analysis for automated sleep stage identification in fullterm and preterm neonates. J Med Syst. 2011;35(4):693–702. doi: 10.1007/s10916-009-9406-2. [DOI] [PubMed] [Google Scholar]
- Galer C, Yonkers A, Duff W, Heywood B. Clinical significance of SNAP somnography test acoustic recording. Otolaryng Head Neck. 2007;136(2):241–245. doi: 10.1016/j.otohns.2006.09.018. [DOI] [PubMed] [Google Scholar]
- Gederi E, Clifford GD. Fusion of image and signal processing for the detection of obstructive sleep apnea. Biomedical and Health Informatics (BHI), 2012 IEEE-EMBS International Conference on; IEEE; 2012. pp. 890–893. [Google Scholar]
- Gesche H, Grosskurth D, Kuchler G, Patzak A. Continuous blood pressure measurement by using the pulse transit time: comparison to a cuff-based method. Eur J Appl Physiol. 2012;112(1):309–315. doi: 10.1007/s00421-011-1983-3. [DOI] [PubMed] [Google Scholar]
- Gil E, Maria Vergara J, Laguna P. Detection of decreases in the amplitude fluctuation of pulse photoplethysmography signal as indication of obstructive sleep apnea syndrome in children. Biomed Signal Proces. 2008;3(3):267–277. [Google Scholar]
- Gil E, Monasterio V, Laguna P, Vergara JM. Pulse photopletismography amplitude decrease detector for sleep apnea evaluation in children. Engineering in Medicine and Biology Society, 2005. IEEE-EMBS 2005; 27th Annual International Conference of the; IEEE; 2005. pp. 2743–2746. [DOI] [PubMed] [Google Scholar]
- Goldberger A, Amaral L, Glass L, Hausdorff J, Ivanov P, Mark R, Mietus J, Moody G, Peng CK, Stanley H. PhysioBank, PhysioToolkit and PhysioNet: components of a new research resource for complex physiologic signals. Circulation. 2000a;101(23):e215–e220. doi: 10.1161/01.cir.101.23.e215. [DOI] [PubMed] [Google Scholar]
- Goldberger AL, Amaral LA, Glass L, Hausdorff JM, Ivanov PC, Mark RG, Mietus JE, Moody GB, Peng CK, Stanley HE. PhysioBank, PhysioToolkit, and PhysioNet: Components of a new research resource for complex physiologic signals. Circulation. 2000b;101(23):e215–e220. doi: 10.1161/01.cir.101.23.e215. [DOI] [PubMed] [Google Scholar]
- Griffiths C, Cooper B, Gibson G. A video system for investigating breathing disorders during sleep. Thorax. 1991;46(2):136–140. doi: 10.1136/thx.46.2.136. [DOI] [PMC free article] [PubMed] [Google Scholar]
- Gudmundsson S, Runarsson TP, Sigurdsson S. Automatic sleep staging using support vector machines with posterior probability estimates. Computational Intelligence for Modelling, Control and Automation, 2005 and International Conference on Intelligent Agents, Web Technologies and Internet Commerce, International Conference on; IEEE; 2005. pp. 366–372. [Google Scholar]
- Guilleminault C, Abad VC. Obstructive sleep apnea. Curr Treat Option N. 2004;6(4):309–317. doi: 10.1007/s11940-004-0030-7. [DOI] [PubMed] [Google Scholar]
- Guilleminault C, Tilkian A, Dement WC. The sleep apnea syndromes. Annu Rev Med. 1976;27(1):465–484. doi: 10.1146/annurev.me.27.020176.002341. [DOI] [PubMed] [Google Scholar]
- Guilleminault C, Winkle R, Connolly S, Melvin K, Tilkian A. Cyclical variation of the heart rate in sleep apnoea syndrome: mechanisms, and usefulness of 24 h electrocardiography as a screening technique. Lancet. 1984;323:126–131. doi: 10.1016/s0140-6736(84)90062-x. [DOI] [PubMed] [Google Scholar]
- Guyton AC, Hall JE. Textbook of Medical Physiology. Philadelphia, PA: W.B. Saunders Company; 2001. [Google Scholar]
- Hanzel D, Proia N, Hudgel D. Response of obstructive sleep apnea to fluoxetine and protriptyline. Chest. 1991;100(2):416–421. doi: 10.1378/chest.100.2.416. [DOI] [PubMed] [Google Scholar]
- Hara H, Murakami N, Miyauchi Y, Yamashita H. Acoustic analysis of snoring sounds by a multidimensional voice program. Laryngoscope. 2006;116(3):379–381. doi: 10.1097/01.mlg.0000195378.08969.fd. [DOI] [PubMed] [Google Scholar]
- Hauge ER, Berle JO, Oedegaard KJ, Holsten F, Fasmer OB. Nonlinear analysis of motor activity shows differences between schizophrenia and depression: A study using fourier analysis and sample entropy. PLoS ONE. 2011;6(1):e16291. doi: 10.1371/journal.pone.0016291. [DOI] [PMC free article] [PubMed] [Google Scholar]
- Heinzer R, White D, Jordan A, Lo Y, Dover L, Stevenson K, Malhotra A. Trazodone increases arousal threshold in obstructive sleep apnoea. Eur Respir J. 2008;31(6):1308–1312. doi: 10.1183/09031936.00067607. [DOI] [PMC free article] [PubMed] [Google Scholar]
- Hersen M. Clinician’s handbook of child behavioral assessment. Academic Press; 2006. [Google Scholar]
- Herzog M, Schmidt A, Bremert T, Herzog B, Hosemann W, Kaftan H. Analysed snoring sounds correlate to obstructive sleep disordered breathing. Eur Arch Oto-Rhino-L. 2008;265(1):105–113. doi: 10.1007/s00405-007-0408-8. [DOI] [PubMed] [Google Scholar]
- Hoffstein V. Review of oral appliances for treatment of sleep-disordered breathing. Sleep Breath. 2007;11(1):1–22. doi: 10.1007/s11325-006-0084-8. [DOI] [PMC free article] [PubMed] [Google Scholar]
- Horn B, Schunck B. Determining optical flow. Artif Intell. 1981;17(1):185–203. [Google Scholar]
- Hornero R, Alvarez D, Abasolo D, del Campo F, Zamarron C. Utility of approximate entropy from overnight pulse oximetry data in the diagnosis of the obstructive sleep apnea syndrome. IEEE T Bio-Med Eng. 2007;54(1):107–113. doi: 10.1109/TBME.2006.883821. [DOI] [PubMed] [Google Scholar]
- Hossain JL, Shapiro CM. The prevalence, cost implications, and management of sleep disorders: an overview. Sleep Breath. 2002;6(2):85–102. doi: 10.1007/s11325-002-0085-1. [DOI] [PubMed] [Google Scholar]
- Hoyer D, Frasch M, Eiselt M, Hoyer O, Zwiener U. Validating phase relations between cardiac and breathing cycles during sleep. IEEE Eng Med Biol. 2001;20(2):101–106. doi: 10.1109/51.917730. [DOI] [PubMed] [Google Scholar]
- Iber C. Sleep-related breathing disorders. Neurol Clin. 2005;23(4):1045–1057. doi: 10.1016/j.ncl.2005.08.001. [DOI] [PubMed] [Google Scholar]
- Iber C of Sleep Medicine T A A. The AASM manual for the scoring of sleep and associated events: rules, terminology and technical specifications. American Academy of Sleep Medicine; 2007. [Google Scholar]
- Indic P, Salvatore P, Maggini C, Ghidini S, Ferraro G, Baldessarini RJ, Murray G. Scaling behavior of human locomotor activity amplitude: Association with bipolar disorder. PLoS ONE. 2011;6(5):e20650. doi: 10.1371/journal.pone.0020650. [DOI] [PMC free article] [PubMed] [Google Scholar]
- Ip MS, Lam B, Lauder IJ, Tsang KW, Chung KF, Mok YW, Lam WK. A community study of sleep-disordered breathing in middle-aged Chinese men in Hong Kong. Chest. 2001;119(1):62–69. doi: 10.1378/chest.119.1.62. [DOI] [PubMed] [Google Scholar]
- Ip MS, Lam B, Tang LC, Lauder IJ, Ip TY, Lam WK. A community study of sleep-disordered breathing in middle-aged Chinese women in Hong Kong: prevalence and gender differences. Chest. 2004;125(1):127–134. doi: 10.1378/chest.125.1.127. [DOI] [PubMed] [Google Scholar]
- Fahrenberg J, Foerster F, Smeja M, Muller W. Assessement of posture and motion by multichannel piezoresistive accelerometer recordings. Psychophysiology. 1997;34:607–612. doi: 10.1111/j.1469-8986.1997.tb01747.x. [DOI] [PubMed] [Google Scholar]
- Jensen PS, Sorensen HB, Leonthin HL, Jennum P. Automatic sleep scoring in normals and in individuals with neurodegenerative disorders according to new international sleep scoring criteria. J Clin Neurophysiol. 2010;27(4):296–302. doi: 10.1097/WNP.0b013e3181eaad4b. [DOI] [PubMed] [Google Scholar]
- Jiayi G, Peng Z, Xin Z, Mingshi W. Sample entropy analysis of sleep EEG under different stages. Complex Medical Engineering, 2007. CME 2007. IEEE/ICME International Conference on; IEEE; 2007. pp. 1499–1502. [Google Scholar]
- Johns MW. A new method for measuring daytime sleepiness: the Epworth sleepiness scale. Sleep. 1991;14(6):540–545. doi: 10.1093/sleep/14.6.540. [DOI] [PubMed] [Google Scholar]
- Jones TM, Ho MS, Earis JE, Swift AC. Acoustic parameters of snoring sound to assess the effectiveness of the Müller Manoeuvre in predicting surgical outcome. Auris Nasus Larynx. 2006;33(4):409–416. doi: 10.1016/j.anl.2006.05.003. [DOI] [PubMed] [Google Scholar]
- Jones TM, Walker P, Ho M, Earis JE, Swift AC, Charters P. Acoustic parameters of snoring sound to assess the effectiveness of sleep nasendoscopy in predicting surgical outcome. Otolaryng Head Neck. 2006;135(2):269–275. doi: 10.1016/j.otohns.2005.11.051. [DOI] [PubMed] [Google Scholar]
- Jones T, Swift A, Calverley P, Ho M, Earis J. Acoustic analysis of snoring before and after palatal surgery. Eur Respir J. 2005;25(6):1044–1049. doi: 10.1183/09031936.05.00101703. [DOI] [PubMed] [Google Scholar]
- Tuck K. Tilt sensing using linear accelerometers. Freescale Semiconductors Inc. Application Note AN3461. 2007:1–8. [Google Scholar]
- Yoshiba K. Influence of sleep posture on response to oral appliance therapy for sleep apnea syndrome. Sleep. 2001;24(5):538–544. doi: 10.1093/sleep/24.5.538. [DOI] [PubMed] [Google Scholar]
- Katz E, Lutz J, Black C, Marcus C. Pulse transit time as a measure of arousal and respiratory effort in children with sleep-disordered breathing. Pediatr Res. 2003;53(4):580–588. doi: 10.1203/01.PDR.0000057206.14698.47. [DOI] [PubMed] [Google Scholar]
- Kendall M, Smith B. The problem of m rankings. The annals of mathematical statistics. 1939:275–287. [Google Scholar]
- Khandoker AH, Karmakar CK, Palaniswami M. Comparison of pulse rate variability with heart rate variability during obstructive sleep apnea. Med Eng Phys. 2011;33(2):204–209. doi: 10.1016/j.medengphy.2010.09.020. [DOI] [PubMed] [Google Scholar]
- Kim J, In K, Kim J, You S, Kang K, Shim J, Lee S, Lee J, Lee S, Park C, Shin C. Prevalence of sleep-disordered breathing in middle-aged Korean men and women. Am J Resp Crit Care. 2004;170(10):1108–1113. doi: 10.1164/rccm.200404-519OC. [DOI] [PubMed] [Google Scholar]
- King M, Jaffre M, Morrish E, Shneerson J, Smith I. The validation of a new actigraphy system for the measurement of periodic leg movements in sleep. Sleep Med. 2005;6(6):507–513. doi: 10.1016/j.sleep.2004.12.010. [DOI] [PubMed] [Google Scholar]
- Kingshott R, Engelman H, Deary I, Douglas N. Does arousal frequency predict daytime function? Eur Respir J. 1998;12:1264–1270. doi: 10.1183/09031936.98.12061264. [DOI] [PubMed] [Google Scholar]
- Klerman EB, Gershengorn HB, Duffy JF, Kronauer RE. Comparisons of the variability of three markers of the human circadian pacemaker. J Biol Rhythms. 2002;17(2):181–193. doi: 10.1177/074873002129002474. [DOI] [PubMed] [Google Scholar]
- Kolodyazhniy V, Späti J, Frey S, Gtz T, Wirz-Justice A, Kräuchi K, Cajochen C, Wilhelm FH. Estimation of human circadian phase via a Multi-Channel ambulatory monitoring system and a multiple regression model. J Biol Rhythms. 2011;26(1):55–67. doi: 10.1177/0748730410391619. [DOI] [PubMed] [Google Scholar]
- Kräuchi K, Cajochen C, Pache M, Flammer J, WirzJustice A. Thermoregulatory effects of melatonin in relation to sleepiness. Chronobiol Int. 2006;23:475–484. doi: 10.1080/07420520500545854. [DOI] [PubMed] [Google Scholar]
- Kräuchi K, Wirz-Justice A. Circadian clues to sleep onset mechanisms. Neuropsychopharmacol. 2001;25(5) Supplement 1:S92–S96. doi: 10.1016/S0893-133X(01)00315-3. [DOI] [PubMed] [Google Scholar]
- Krishnan R, Natarajan BB, Warren S. Two-stage approach for detection and reduction of motion artifacts in photoplethysmographic data. IEEE T Bio-Med Eng. 2010;57(8):1867–1876. doi: 10.1109/TBME.2009.2039568. [DOI] [PubMed] [Google Scholar]
- Kryger M, Roth T, Dement W. Principles and Practice of Sleep Medicine. third edn. W.B. Saunders Company; 2000. [Google Scholar]
- Kuna ST, Benca R, Kushida CA, Walsh J, Younes M, Staley B, Hanlon A, Pack AI, Pien GW, Malhotra A. Agreement in computer-assisted manual scoring of polysomnograms across sleep centers. Sleep. 2012;36(4):583–589. doi: 10.5665/sleep.2550. [DOI] [PMC free article] [PubMed] [Google Scholar]
- Lam B, Lam D, Ip M. Obstructive sleep apnoea in Asia. Int J Tuberc Lung D. 2007;11(1):2–11. [PubMed] [Google Scholar]
- Lavie P. The Enchanted World of Sleep. New Haven, CT: Yale University Press; 1996. [Google Scholar]
- Lavie P, Shlitner A, Nave R. Cardiac autonomic function during sleep in psychogenic and organic erectile dysfunction. J Sleep Res. 1999;8(2):135–142. doi: 10.1046/j.1365-2869.1999.00137.x. [DOI] [PubMed] [Google Scholar]
- Lee B, Han J, Baek HJ, Shin JH, Park KS, Yi WJ. Improved elimination of motion artifacts from a photoplethysmographic signal using a kalman smoother with simultaneous accelerometry. Physiol Meas. 2010;31(12):1585–1603. doi: 10.1088/0967-3334/31/12/003. [DOI] [PubMed] [Google Scholar]
- Lee T, Abeyratne U, Puvanendran K, Goh K. Formant-structure and phase-coupling analysis of human snoring sounds for detection of obstructive sleep apnea. Comput Method Biomec. 2000;3:243–248. [Google Scholar]
- Li Q, Clifford GD. Dynamic time warping and machine learning for signal quality assessment of pulsatile signals. Physiol Meas. 2012;33(9):1491–1501. doi: 10.1088/0967-3334/33/9/1491. [DOI] [PubMed] [Google Scholar]
- Li Q, Mark RG, Clifford GD. Robust heart rate estimation from multiple asynchronous noisy sources using signal quality indices and a Kalman filter. Physiol Meas. 2008;29:15–32. doi: 10.1088/0967-3334/29/1/002. [DOI] [PMC free article] [PubMed] [Google Scholar]
- Liang SF, Chen YH, Kuo CE, Chen JY, Hsu SC. A fuzzy inference system for sleep staging. Fuzzy Systems (FUZZ), 2011 IEEE International Conference on; IEEE; 2011. pp. 2104–2107. [Google Scholar]
- Liao W, Kuo J. Sleep monitoring system in real bedroom environment using texture-based background modeling approaches. Journal of Ambient Intelligence and Humanized Computing. 2011:1–10. [Google Scholar]
- Liao W, Yang C. Video-based activity and movement pattern analysis in overnight sleep studies. Pattern Recognition, 2008. ICPR 2008; 19th International Conference on; IEEE; 2008. pp. 1–4. [Google Scholar]
- Lichstein KL, Stone KC, Donaldson J, Nau SD, Soeffing JP, Murray D, Lester KW, Aguillard RN. Actigraphy validation with insomnia. Sleep. 2006;39(2):232–239. [PubMed] [Google Scholar]
- Liesching TN, Carlisle C, Marte A, Bonitat A, Millman RP. Evaluation of the Accuracy of SNAP Technology Sleep Sonography in Detecting Obstructive Sleep Apnea in Adults Compared to Standard Polysomnography. Chest. 2004;125(3):886–891. doi: 10.1378/chest.125.3.886. [DOI] [PubMed] [Google Scholar]
- Lo C, Chou T, Penzel T, Scammell TE, Strecker RE, Stanley HE, Ivanov PC. Common scale-invariant patterns of sleep-wake transitions across mammalian species. PNAS. 2004;101(50):17545–17548. doi: 10.1073/pnas.0408242101. [DOI] [PMC free article] [PubMed] [Google Scholar]
- Loomis AL, Harvey EN, Hobart G. Electrical potentials of the human brain. J Exp Psychol. 1936;19(3):249–279. [Google Scholar]
- Loomis AL, Harvey EN, Hobart G. Cerebral states during sleep, as studied by human brain potentials. J Exp Psychol. 1937;21(2):127–144. [Google Scholar]
- Mahowald M, Schenck C, et al. NREM sleep parasomnias. Neurol Clin. 1996;14(4):675. doi: 10.1016/s0733-8619(05)70280-2. [DOI] [PubMed] [Google Scholar]
- Malik M. Heart rate variability: Standards of measurement, physiological interpretation, and clinical use. Circulation. 1996;93:1043–1065. [PubMed] [Google Scholar]
- Malik M, Camm AJ. Heart Rate Variability. Armonk, NY: Futura Publishing; 1995. [Google Scholar]
- Martin Bland J, Altman D. Statistical methods for assessing agreement between two methods of clinical measurement. The lancet. 1986;327(8476):307–310. [PubMed] [Google Scholar]
- Martin SE, Engleman HM, Kingshott RN, Douglas NJ. Microarousals in patients with sleep apnoea/hypopnoea syndrome. J Sleep Res. 1997;6(4):276–280. doi: 10.1111/j.1365-2869.1997.00276.x. [DOI] [PubMed] [Google Scholar]
- Martinez MW, Rodysill KJ, Morgenthaler TI. Use of ambulatory overnight oximetry to investigate sleep apnea in a general internal medicine practice. Mayo Clinic Proceedings. 2005;80(4):455–462. doi: 10.4065/80.4.455. [DOI] [PubMed] [Google Scholar]
- McCombe A, Kwok V, Hawke W. An acoustic screening test for obstructive sleep apnoea. Clin Otolaryngol. 1995;20(4):348–351. doi: 10.1111/j.1365-2273.1995.tb00057.x. [DOI] [PubMed] [Google Scholar]
- McGown A, Makker H, Battagel J, L’Estrange P, Grant H, Spiro S. Long-term use of mandibular advancement splints for snoring and obstructive sleep apnoea: a questionnaire survey. Eur Respir J. 2001;17(3):462–466. doi: 10.1183/09031936.01.17304620. [DOI] [PubMed] [Google Scholar]
- McNicholas W. Impact of sleep in respiratory failure. Eur Respir J. 1997;10(4):920–933. [PubMed] [Google Scholar]
- McSharry PE, Clifford GD. A statistical model of the sleep-wake dynamics of the cardiac rhythm. Comput Cardiol. 2005;32:591–594. [Google Scholar]
- Mendel J. Tutorial on higher-order statistics (spectra) in signal processing and system theory: Theoretical results and some applications. P IEEE. 1991;79(3):278–305. [Google Scholar]
- Michaelson PG, Allan P, Chaney J, Mair EA. Validations of a portable home sleep study with twelve-lead polysomnography: comparisons and insights into a variable gold standard. Ann Oto Rhinol Laryn. 2006;115(11):802–809. doi: 10.1177/000348940611501102. [DOI] [PubMed] [Google Scholar]
- Mignot E. Genetic and familial aspects of narcolepsy. Neurology. 1998;50(2) Suppl 1:S16–S22. doi: 10.1212/wnl.50.2_suppl_1.s16. [DOI] [PubMed] [Google Scholar]
- Monasterio V, Burgess F, Clifford GD. Robust classification of neonatal apnoea-related desaturations. Physiol Meas. 2012;33(9):1503–1516. doi: 10.1088/0967-3334/33/9/1503. [DOI] [PubMed] [Google Scholar]
- Moody G, Mark R, Bump M, Weinstein J, Berman A, Mietus J, Goldberger A. Clinical validation of the ECG-derived respiration (EDR) technique. Comput Cardiol. 1986;13:507–510. [Google Scholar]
- Moody G, Mark R, Goldberger A, Penzel T. Computers in Cardiology 2000. IEEE; 2000. Stimulating rapid research advances via focused competition: the computers in cardiology challenge 2000; pp. 207–210. [Google Scholar]
- Moody G, Mark R, Zoccola A, Mantero S. Derivation of respiratory signals from multi-lead ECGs. Comput Cardiol. 1985;12:113–116. [Google Scholar]
- Morgenstern C, Schwaibold M, Randerath WJ, Bolz A, Jané R. An invasive and a noninvasive approach for the automatic differentiation of obstructive and central hypopneas. IEEE T Bio-Med Eng. 2010;57(8):1927–1936. doi: 10.1109/TBME.2010.2047505. [DOI] [PubMed] [Google Scholar]
- Morillo DS, Rojas JL, Crespo LF, León A, Gross N. Poincaré analysis of an overnight arterial oxygen saturation signal applied to the diagnosis of sleep apnea hypopnea syndrome. Physiol Meas. 2009;30:405–420. doi: 10.1088/0967-3334/30/4/005. [DOI] [PubMed] [Google Scholar]
- Nakai H, Ishihara K, Miyake Y, Watanabe M. Non-restrictive visual respiration monitoring. Pattern Recognition, 2000; Proceedings. 15th International Conference on; IEEE; 2000. pp. 647–651. [Google Scholar]
- Nakajima K, Matsumoto Y, Tamura T. Development of real-time image sequence analysis for evaluating posture change and respiratory rate of a subject in bed. Physiol Meas. 2001;22(3):N21–N28. doi: 10.1088/0967-3334/22/3/401. [DOI] [PubMed] [Google Scholar]
- Naschitz JE, Bezobchuk S, Mussafia-Priselac R, Sundick S, Dreyfuss D, Khorshidi I, Karidis A, Manor H, Nagar M, Peck ER, et al. Pulse transit time by R-wave-gated infrared photoplethysmography: review of the literature and personal experience. J Clin Monitor Comp. 2004;18(5):333–342. doi: 10.1007/s10877-005-4300-z. [DOI] [PubMed] [Google Scholar]
- Natale V, Plazzi G, Martoni M. Actigraphy in the assessment of insomnia: a quantitative approach. Sleep. 2007;32(6):767–771. doi: 10.1093/sleep/32.6.767. [DOI] [PMC free article] [PubMed] [Google Scholar]
- Kavey NB, Blitzer A, Gidro-Frank S, Korstanje K. Sleeping position and sleep apnea syndrome. Am J Otolaryng. 1985;6(5):373–377. doi: 10.1016/s0196-0709(85)80015-6. [DOI] [PubMed] [Google Scholar]
- Neamatullah I, Douglass M, Li-wei H, Reisner A, Villarroel M, Long W, Szolovits P, Moody G, Mark R, Clifford G. Automated de-identification of free-text medical records. BMC Med Inform Decis. 2008;8(8):32. doi: 10.1186/1472-6947-8-32. [DOI] [PMC free article] [PubMed] [Google Scholar]
- Nemati S, Malhotra A, Clifford GD. Data fusion for improved respiration rate estimation. EURASIP J Adv Signal Process. 2010;2010:1–10. doi: 10.1155/2010/926305. [DOI] [PMC free article] [PubMed] [Google Scholar]
- Network SIG. Management of obstructive sleep apnoea/hypopnoea syndrome in adults. A national clinical guideline. 2003 [Google Scholar]
- Netzer NC, Stoohs RA, Netzer CM, Clark K, Strohl KP. Using the Berlin Questionnaire to identify patients at risk for the sleep apnea syndrome. Ann Intern Med. 1999;131(7):485–491. doi: 10.7326/0003-4819-131-7-199910050-00002. [DOI] [PubMed] [Google Scholar]
- Netzer N, Eliasson AH, Netzer C, Kristo DA. Overnight pulse oximetry for sleep-disordered breathing in adults. Chest. 2001;120(2):625–633. doi: 10.1378/chest.120.2.625. [DOI] [PubMed] [Google Scholar]
- Ng AK, et al. Snore signal enhancement and activity detection via translation-invariant wavelet transform. IEEE T Bio-Med Eng. 2008a;55(10):2332–2342. doi: 10.1109/TBME.2008.925682. [DOI] [PubMed] [Google Scholar]
- Ng A, Wong K, Tan C, Koh T. Bispectral analysis of snore signals for obstructive sleep apnea detection. Engineering in Medicine and Biology Society, 2007. EMBS 2007; 29th Annual International Conference of the IEEE; IEEE; 2007. pp. 6195–6198. [DOI] [PubMed] [Google Scholar]
- Ng A, et al. Could formant frequencies of snore signals be an alternative means for the diagnosis of obstructive sleep apnea? Sleep Med. 2008b;9(8):894–898. doi: 10.1016/j.sleep.2007.07.010. [DOI] [PubMed] [Google Scholar]
- Niedermeyer E, Da Silva F. Electroencephalography: basic principles, clinical applications, and related fields. Lippincott Williams & Wilkins; 2005. [Google Scholar]
- O’Brien LM, Gozal D. Autonomic dysfunction in children with sleep-disordered breathing. Sleep. 2005;28(6):747–752. doi: 10.1093/sleep/28.6.747. [DOI] [PubMed] [Google Scholar]
- O’Brien LM, Gozal D. Potential usefulness of noninvasive au-tonomic monitoring in recognition of arousals in normal healthy children. J Clin Sleep Med. 2007;3(1):41–47. [PubMed] [Google Scholar]
- Ohayon MM, Caulet M, Philip P, Guilleminault C, Priest RG. How sleep and mental disorders are related to complaints of daytime sleepiness. Arch Intern Med. 1997;157(22):2645–2652. [PubMed] [Google Scholar]
- Oliven A, OHearn DJ, Boudewyns A, Odeh M, Backer WD, van de Heyning P, Smith PL, Eisele DW, Allan L, Schneider H, Testerman R, Schwartz AR. Upper airway response to electrical stimulation of the genioglossus in obstructive sleep apnea. J Appl Physiol. 2003;95(5):2023–2029. doi: 10.1152/japplphysiol.00203.2003. [DOI] [PubMed] [Google Scholar]
- Oliven A, Schnall R, Pillar G, Gavriely N, Odeh M. Sublingual electrical stimulation of the tongue during wakefulness and sleep. Resp Physiol. 2001;127(2–3):217–226. doi: 10.1016/s0034-5687(01)00254-7. [DOI] [PubMed] [Google Scholar]
- Ortiz-Tudela E, Martinez-Nicolas A, Campos M, Rol M, Madrid JA. A new integrated variable based on thermometry, actimetry and body position (TAP) to evaluate circadian system status in humans. PLoS Comput Biol. 2010;6(11):e1000996. doi: 10.1371/journal.pcbi.1000996. [DOI] [PMC free article] [PubMed] [Google Scholar]
- Otzenberger H, Gronfier C, Simon C, Charloux A, Ehrhart J, Piquard F, Brandenberger G. Dynamic heart rate variability: a tool for exploring sympathovagal balance continuously during sleep in men. Am J Physiol - Heart C. 1998;275(3):H946–H950. doi: 10.1152/ajpheart.1998.275.3.H946. [DOI] [PubMed] [Google Scholar]
- Ozeke O, Erturk O, Gungor M, Hızel S, Aydın D, Celenk M, Dıncer H, Ilıcın G, Ozgen F, Ozer C. Influence of the right-versus left-sided sleeping position on the apnea-hypopnea index in patients with sleep apnea. Sleep Breath. 2011:1–4. doi: 10.1007/s11325-011-0547-4. [DOI] [PubMed] [Google Scholar]
- Paavonen EJ, Fjällberg M, Steenari M, Aronen ET. Actigraph placement and sleep estimation in children. Sleep. 2002;25(2):235–237. doi: 10.1093/sleep/25.2.235. [DOI] [PubMed] [Google Scholar]
- Pagel J. Excessive daytime sleepiness. Am Fam Physician. 2009;79(5):391–396. [PubMed] [Google Scholar]
- Paquet J, Kawinska A, Carrier J. Wake detection capacity of actigraphy during sleep. Sleep. 2007;30(10):1362–1369. doi: 10.1093/sleep/30.10.1362. [DOI] [PMC free article] [PubMed] [Google Scholar]
- Pardey J, Roberts S, Tarassenko L, Stradling J. A new approach to the analysis of the human sleep/wakefulness continuum. J Sleep Res. 1996;5(4):201–210. doi: 10.1111/j.1365-2869.1996.00201.x. [DOI] [PubMed] [Google Scholar]
- Parkes J, Chen S, Clift S, Dahlitz M, Dunn G. The clinical diagnosis of the narcoleptic syndrome. J Sleep Res. 1998;7:41–52. doi: 10.1046/j.1365-2869.1998.00093.x. [DOI] [PubMed] [Google Scholar]
- Parkka J, Ermes M, Antila K, van Gils M, Manttari A, Nieminen H. Estimating intensity of physical activity: A comparison of wearable accelerometer and gyro sensors and 3 sensor locations. Engineering in Medicine and Biology Society, 2007. EMBS 2007; 29th Annual International Conference of the IEEE; IEEE; 2007. pp. 1511–1514. [DOI] [PubMed] [Google Scholar]
- Penzel T, Kesper K, Pinnow I, Becker HF, Vogelmeier C. Peripheral arterial tonometry, oximetry and actigraphy for ambulatory recording of sleep apnea. Physiol Meas. 2004;25(4):1025–1036. doi: 10.1088/0967-3334/25/4/019. [DOI] [PubMed] [Google Scholar]
- Penzel T, Zhange X, Fietze I. Inter-scorer reliability between sleep centers can teach us what to improve in the scoring rules. J Clin Sleep Med. 2013;9(1):81–87. doi: 10.5664/jcsm.2352. [DOI] [PMC free article] [PubMed] [Google Scholar]
- Penzel T, et al. Peripheral arterial tonometry for the diagnosis of obstructive sleep apnea. Biomed Tech/Biomed Eng. 2002a;47(s1a):315–317. doi: 10.1515/bmte.2002.47.s1a.315. [DOI] [PubMed] [Google Scholar]
- Penzel T, et al. Systematic comparison of different algorithms for apnoea detection based on electrocardiogram recordings. Med Biol Eng Comput. 2002b;40(4):402–407. doi: 10.1007/BF02345072. [DOI] [PubMed] [Google Scholar]
- Pepperell J, Davies R, Stradling J. Sleep studies for sleep apnoea. Physiol Meas. 2002;23(2):R39–R74. doi: 10.1088/0967-3334/23/2/201. [DOI] [PubMed] [Google Scholar]
- Perez-Padilla JR, Salwinski E, Difrancesco L, Feige R, Remmers J, Whitelaw W. Characteristics of the snoring noise in patients with and without occlusive sleep apnea. Am J Resp Crit Care. 1993;147(3):635–644. doi: 10.1164/ajrccm/147.3.635. [DOI] [PubMed] [Google Scholar]
- Petterson MT, Begnoche VL, Graybeal JM. The effect of motion on pulse oximetry and its clinical significance. Anesth Analg. 2007;105(6S Suppl):S78–S84. doi: 10.1213/01.ane.0000278134.47777.a5. [DOI] [PubMed] [Google Scholar]
- Pevernagie D, Aarts RM, De Meyer M. The acoustics of snoring. Sleep Med Rev. 2010;14(2):131–144. doi: 10.1016/j.smrv.2009.06.002. [DOI] [PubMed] [Google Scholar]
- Popovic D, Ayappa I, Hauri P, Levendowski D, Velimirovic V, Burschtin O, Rapoport DM, Westbrook P. Accuracy of automated sleep staging using signals from a single forehead site. Sleep. 2008;31:332. [Google Scholar]
- Portier F, Portmann A, Czernichow P, Vascaut L, Devin E, Benhamou D, Cuvelier A, Muir JF. Evaluation of home versus laboratory polysomnography in the diagnosis of sleep apnea syndrome. Am J Resp Crit Care. 2000;162(3):814–818. doi: 10.1164/ajrccm.162.3.9908002. [DOI] [PubMed] [Google Scholar]
- Prasad B, Carley D, Herdegen J. Continuous positive airway pressure device-based automated detection of obstructive sleep apnea compared to standard laboratory polysomnography. Sleep Breath. 2010;14:101–107. doi: 10.1007/s11325-009-0285-z. [DOI] [PubMed] [Google Scholar]
- Punjabi NM, Newman AB, Young TB, Resnick HE, Sanders MH. Sleep-disordered breathing and cardiovascular disease: an outcome-based definition of hypopneas. Am J Resp Crit Care. 2008;177(10):1150. doi: 10.1164/rccm.200712-1884OC. [DOI] [PMC free article] [PubMed] [Google Scholar]
- Quan SF, Gillin JC, Littner MR, Shepard JW. Sleep-related breathing disorders in adults: Recommendations for syndrome definition and measurement techniques in clinical research. Editorials. Sleep. 1999;22(5):662–689. [PubMed] [Google Scholar]
- Ramanan D, Forsyth D, Zisserman A. Tracking people by learning their appearance. IEEE T Pattern Anal. 2007:65–81. doi: 10.1109/tpami.2007.250600. [DOI] [PubMed] [Google Scholar]
- Raymann RJ, Swaab DF, Van Someren EJ. Skin temperature and sleep-onset latency: Changes with age and insomnia. Physiol Behav. 2007;90(2–3):257–266. doi: 10.1016/j.physbeh.2006.09.008. [DOI] [PubMed] [Google Scholar]
- Cartwright RD. Effect of sleep position on sleep apnea severity. Sleep. 1984;7(2):110–114. doi: 10.1093/sleep/7.2.110. [DOI] [PubMed] [Google Scholar]
- Rechtschaffen A, Kales A. A manual of standardized terminology, techniques and scoring system for sleep stages of human subjects. Arch Gen Psychiat. 1969;20(2):246. doi: 10.1046/j.1440-1819.2001.00810.x. [DOI] [PubMed] [Google Scholar]
- Redline S, Budhiraja R, Kapur V, Marcus CL, Mateika JH, Mehra R, Parthasarthy S, Somers VK, Strohl KP, Sulit LG, Gozal D, Wise MS, Quan SF. The scoring of respiratory events in sleep: reliability and validity. J Clin Sleep Med. 2007;3(2):169–200. [PubMed] [Google Scholar]
- Redmond SJ, Heneghan C. Cardiorespiratory-based sleep staging in subjects with obstructive sleep apnea. Biomedical Engineering, IEEE Transactions on. 2006;53(3):485–496. doi: 10.1109/TBME.2005.869773. [DOI] [PubMed] [Google Scholar]
- Refinetti R, Cornélissen G, Halberg F. Procedures for numerical analysis of circadian rhythms. Biol Rhythm Res. 2007;38(4):275–325. doi: 10.1080/09291010600903692. [DOI] [PMC free article] [PubMed] [Google Scholar]
- Reidsma D, Carletta J. Reliability measurement without limits. Comput Linguist. 2008;34(3):319–326. [Google Scholar]
- Riker R, Picard J, Fraser G. Prospective evaluation of the sedation-agitation scale for adult critically ill patients. Crit Care Med. 1999;27(7):1325–1329. doi: 10.1097/00003246-199907000-00022. [DOI] [PubMed] [Google Scholar]
- Roberts S, Tarassenko L. New method of automated sleep quantification. Med Biol Eng Comput. 1992;30(5):509–517. doi: 10.1007/BF02457830. [DOI] [PubMed] [Google Scholar]
- Roebuck A, Clifford GD. Multiscale entropy applied to audio data for classifying obstructive sleep apnoea patients. Am J Respir Crit Care Med. 2012;185:A3841. [Google Scholar]
- Rosa A, Alves GR, Brito M, Lopes MC, Tufik S. Visual and automatic cyclic alternating pattern (CAP) scoring: inter-rater reliability study. Arq Neuropsiquiatr. 2006;64(3A):578–581. doi: 10.1590/s0004-282x2006000400008. [DOI] [PubMed] [Google Scholar]
- Rossow AB, Salles EOT, Coco KF. Automatic sleep staging using a single-channel EEG modeling by Kalman Filter and HMM. Biosignals and Biorobotics Conference (BRC), 2011 ISSNIP; IEEE; 2011. pp. 1–6. [Google Scholar]
- Sack R, Auckley D, Auger R, Carskadon M, Wright K, Jr, Vitiello M, Zhdanova I. Circadian rhythm sleep disorders: Part i, basic principles, shift work and jet lag disorders: An american academy of sleep medicine review. Sleep. 2007a;30(11):1460–1483. doi: 10.1093/sleep/30.11.1460. [DOI] [PMC free article] [PubMed] [Google Scholar]
- Sack R, Auckley D, Auger R, Carskadon M, Wright K, Jr, Vitiello M, Zhdanova I. Circadian rhythm sleep disorders: part ii, advanced sleep phase disorder, delayed sleep phase disorder, free-running disorder, and irregular sleep-wake rhythm: an american academy of sleep medicine review. Sleep. 2007b;30(11):1484–1501. doi: 10.1093/sleep/30.11.1484. [DOI] [PMC free article] [PubMed] [Google Scholar]
- Sadeh A. The role and validity of actigraphy in sleep medicine: An update. Sleep Med Rev. 2011;15(4):259–267. doi: 10.1016/j.smrv.2010.10.001. [DOI] [PubMed] [Google Scholar]
- Sadeh A, Acebo C. The role of actigraphy in sleep medicine. Sleep Med Rev. 2002;6(2):113–124. doi: 10.1053/smrv.2001.0182. [DOI] [PubMed] [Google Scholar]
- Sadeh A, Sharkey KM, Carskadon MA. Activity-based sleep-wake identification: an empirical test of methodological issues. Sleep. 1994;17(3):201–207. doi: 10.1093/sleep/17.3.201. [DOI] [PubMed] [Google Scholar]
- Saeed M, Villarroel M, Reisner AT, Clifford G, Lehman LW, Moody G, Heldt T, Kyaw TH, Moody B, Mark RG. Multiparameter intelligent monitoring in intensive care ii (mimic-ii): a public-access intensive care unit database. Crit Care Med. 2011;39(5):952–960. doi: 10.1097/CCM.0b013e31820a92c6. [DOI] [PMC free article] [PubMed] [Google Scholar]
- Sarabia J, Rol M, Mendiola P, Madrid J. Circadian rhythm of wrist temperature in normal-living subjects: A candidate of new index of the circadian system. Physiol Behav. 2008;95(4):570–580. doi: 10.1016/j.physbeh.2008.08.005. [DOI] [PubMed] [Google Scholar]
- Scargle JD. Studies in astronomical time series analysis. II - statistical aspects of spectral analysis of unevenly spaced data. Astrophys J. 1982;263:835–853. [Google Scholar]
- Scatena M, Dittoni S, Maviglia R, Frusciante R, Testani E, Vollono C, Losurdo A, Colicchio S, Gnoni V, Labriola C, et al. An integrated video-analysis software system designed for movement detection and sleep analysis. validation of a tool for the behavioural study of sleep. Clin Neurophysiol. 2012;123(2):318–323. doi: 10.1016/j.clinph.2011.07.026. [DOI] [PubMed] [Google Scholar]
- Schenck C, Mahowald M, et al. REM sleep parasomnias. Neurol Clin. 1996;14(4):697. doi: 10.1016/s0733-8619(05)70281-4. [DOI] [PubMed] [Google Scholar]
- Schnall RP, Shlitner A, Sheffy J, Kedar R, Lavie P. Periodic, profound peripheral vasoconstriction–a new marker of obstructive sleep apnea. Sleep. 1999;22(7):939–946. [PubMed] [Google Scholar]
- Schwartz A, Eisele D, Hari A, Testerman R, Erickson D, Smith P. Electrical stimulation of the lingual musculature in obstructive sleep apnea. J Appl Physiol. 1996;81(2):643–652. doi: 10.1152/jappl.1996.81.2.643. [DOI] [PubMed] [Google Scholar]
- Schweitzer M, Mohammad A, Binder R, Steinberg R, Schreiber WH, Weeß HG. Biosomnia–validity of a mobile system to detect sleep and sleep quality. Somnologie. 2004;8(4):131–138. [Google Scholar]
- Seppa V, Viik J, Hyttinen J. Assessment of pulmonary flow using impedance pneumography. IEEE Trans Biomed Eng. 2010;57(9):2277–2285. doi: 10.1109/TBME.2010.2051668. [DOI] [PubMed] [Google Scholar]
- Sforza E, Johannes M, Claudio B. The pam-rl ambulatory device for detection of periodic leg movements: a validation study. Sleep Med. 2005;6(5):407–413. doi: 10.1016/j.sleep.2005.01.004. [DOI] [PubMed] [Google Scholar]
- Shapiro C. Fatigue: how many types and how common? J Psychosom Res. 1998;45(1):33–38. [PubMed] [Google Scholar]
- Sharma SK, Kumpawat S, Banga A, Goel A. Prevalence and risk factors of obstructive sleep apnea syndrome in a population of Delhi, India. Chest. 2006;130(1):149–156. doi: 10.1378/chest.130.1.149. [DOI] [PubMed] [Google Scholar]
- Shepard J, Jr, Gefter W, Guilleminault C, Hoffman E, Hoffstein V, Hudgel D, Suratt P, White D. Evaluation of the upper airway in patients with obstructive sleep apnea. Sleep. 1991;14(4):361–371. doi: 10.1093/sleep/14.4.361. [DOI] [PubMed] [Google Scholar]
- Silvestri R, Gagliano A, Aricņ I, Calarese T, Cedro C, Bruni O, Condurso R, Germanņ E, Gervasi G, Siracusano R, et al. Sleep disorders in children with Attention-Deficit/Hyperactivity Disorder (ADHD) recorded overnight by video-polysomnography. Sleep Med. 2009;10(10):1132–1138. doi: 10.1016/j.sleep.2009.04.003. [DOI] [PubMed] [Google Scholar]
- Sivan Y, Kornecki A, Schonfeld T. Screening obstructive sleep apnoea syndrome by home videotape recording in children. Eur Respir J. 1996;9(10):2127–2131. doi: 10.1183/09031936.96.09102127. [DOI] [PubMed] [Google Scholar]
- Sivertsen B, Omvik S, Havik OE, Pallesen S, Bjorvatn B, Nielsen GH, Straume S, Nordhus IH. A comparison of actigraphy and polysomnography in older adults treated for chronic primary insomnia. Sleep. 2006;29(10):1353–1358. doi: 10.1093/sleep/29.10.1353. [DOI] [PubMed] [Google Scholar]
- Smith I, Quinnell T. Pharmacotherapies for obstructive sleep apnoea: where are we now? Drugs. 2004;64(13):1385–1399. doi: 10.2165/00003495-200464130-00001. [DOI] [PubMed] [Google Scholar]
- So K, Michael Adamson T, Horne RSC. The use of actigraphy for assessment of the development of sleep/wake patterns in infants during the first 12 months of life. J Sleep Res. 2007;16(2):181–187. doi: 10.1111/j.1365-2869.2007.00582.x. [DOI] [PubMed] [Google Scholar]
- Sokolove PG, Bushell WN. The chi square periodogram: Its utility for analysis of circadian rhythms. J Theor Biol. 1978;72(1):131–160. doi: 10.1016/0022-5193(78)90022-x. [DOI] [PubMed] [Google Scholar]
- Solà-Soler J, Fiz JA, Morera J, Jané R. Multiclass classification of subjects with sleep apnoea–hypopnoea syndrome through snoring analysis. Medical Eng Phys. 2012;34(9):1213–1220. doi: 10.1016/j.medengphy.2011.12.008. [DOI] [PubMed] [Google Scholar]
- Sola-Soler J, Jane R, Fiz J, Morera J. Spectral envelope analysis in snoring signals from simple snorers and patients with obstructive sleep apnea. Engineering in Medicine and Biology Society, 2003; Proceedings of the 25th Annual International Conference of the IEEE; IEEE; 2003. pp. 2527–2530. [Google Scholar]
- Soldatos C, Dikeos D, Paparrigopoulos T. The diagnostic validity of the Athens Insomnia Scale. J Psychosom Res. 2003;55(3):263–267. doi: 10.1016/s0022-3999(02)00604-9. [DOI] [PubMed] [Google Scholar]
- Soldatos CR, Allaert FA, Ohta T, Dikeos DG. How do individuals sleep around the world? Results from a single-day survey in ten countries. Sleep Med. 2005;6(1):5–13. doi: 10.1016/j.sleep.2004.10.006. [DOI] [PubMed] [Google Scholar]
- Soldatos CR, Dikeos DG, Paparrigopoulos TJ. Athens Insomnia Scale: validation of an instrument based on ICD-10 criteria. J Psychosom Res. 2000;48(6):555–560. doi: 10.1016/s0022-3999(00)00095-7. [DOI] [PubMed] [Google Scholar]
- Sornmo L, Laguna P. Bioelectrical Signal Processing. Amsterdam: Elsevier; 2005. [Google Scholar]
- Lloyd SR, Cartwright RD. Physiologic basis of therapy for sleep apnea. Am Rev Respir Dis. 1987;136(2):525–526. doi: 10.1164/ajrccm/136.2.525b. [DOI] [PubMed] [Google Scholar]
- Stamatakis K, Sanders MH, Caffo B, Resnick HE, Gottlieb DJ, Mehra R, Punjabi NM. Fasting glycemia in sleep disordered breathing: lowering the threshold on oxyhemoglobin desaturation. Sleep. 2008;31(7):1018. [PMC free article] [PubMed] [Google Scholar]
- Stein IM, Shannon DC. The pediatric pneumogram: a new method for detecting and quantitating apnea in infants. Pediatrics. 1975;55(5):599–603. [PubMed] [Google Scholar]
- Stepnowsky CJ, Berry C, Dimsdale JE. The effect of measurement unreliability on sleep and respiratory variables. Sleep. 2004;27(5):990–995. doi: 10.1093/sleep/27.5.990. [DOI] [PubMed] [Google Scholar]
- Stoller M. Economic effiects of insomnia. Clin Ther. 1994;16(5):873–897. [PubMed] [Google Scholar]
- Stradling J, Crosby J. Predictors and prevalence of obstructive sleep apnoea and snoring in 1001 middle-aged men. Thorax. 1991;46(2):85–90. doi: 10.1136/thx.46.2.85. [DOI] [PMC free article] [PubMed] [Google Scholar]
- Su S, Baroody FM, Kohrman M, Suskind D. A comparison of polysomnography and a portable home sleep study in the diagnosis of obstructive sleep apnea syndrome. Otolaryng Head Neck. 2004;131(6):844–850. doi: 10.1016/j.otohns.2004.07.014. [DOI] [PubMed] [Google Scholar]
- Sukor JA, Redmond SJ, Lovell NH. Signal quality measures for pulse oximetry through waveform morphology analysis. Physiol Meas. 2011;32(3):369–384. doi: 10.1088/0967-3334/32/3/008. [DOI] [PubMed] [Google Scholar]
- Swartz AM, Strath SJ, Bassett DRJ, O’Brien WL, King GA, Ainsworth BE. Estimation of energy expenditure using CSA accelerometers at hip and wrist sites. Med Sci Sports Exercise. 2000;32(9 Suppl):S450–S456. doi: 10.1097/00005768-200009001-00003. [DOI] [PubMed] [Google Scholar]
- Takemura Y, Sato J, Nakajima M. A respiratorymovement monitoring system using fiber-grating vision sensor for diagnosing sleep apnea syndrome. Opt Rev. 2005;12:46–53. [Google Scholar]
- Tarassenko L, Zamora M, Pardey J. Cambridge University Press chapter Neural network analysis of sleep disorders. 2001:90–101. [Google Scholar]
- Teicher MH, Barber NI. COSIFIT: an interactive program for simultaneous multioscillator cosinor analysis of time-series data. Comput Biomed Res. 1990;23(3):283–295. doi: 10.1016/0010-4809(90)90022-5. [DOI] [PubMed] [Google Scholar]
- Terzano MG, Parrino L, Boselli M, Smerieri A, Spaggiari MC. CAP components and EEG synchronization in the first 3 sleep cycles. Clin Neurophysiol. 2000;111(2):283–290. doi: 10.1016/s1388-2457(99)00245-x. [DOI] [PubMed] [Google Scholar]
- Terzano MG, Parrino L, SpaggiariM C. The cyclic alternating pattern sequences in the dynamic organization of sleep. Electroencephalogr Clin Neurophysiol. 1988;69(5):437–447. doi: 10.1016/0013-4694(88)90066-1. [DOI] [PubMed] [Google Scholar]
- Thalhofer S, Dorow P. Central sleep apnea. Respiration. 1997;64(1):2–9. doi: 10.1159/000196635. [DOI] [PubMed] [Google Scholar]
- Thomas R, Mietus J, Peng C, Goldberger A, et al. An electrocardiogram-based technique to assess cardiopulmonary coupling during sleep. Sleep. 2005;28(9):1151. doi: 10.1093/sleep/28.9.1151. [DOI] [PubMed] [Google Scholar]
- Thorpy M. The International Classification of Sleep Disorders: Diagnostic and Coding Manual. Rochester, MN Westchester, IL, USA: American Sleep Disorders Association; 1990. [Google Scholar]
- Tilmanne J, Urbain J, Kothare MV, Wouwer AV, Kothare SV. Algorithms for sleepwake identification using actigraphy: a comparative study and new results. J Sleep Res. 2009;18(1):85–98. doi: 10.1111/j.1365-2869.2008.00706.x. [DOI] [PubMed] [Google Scholar]
- Titze IR. Principles of voice production. 2 edn. National Center for Voice and Speech; 2000. [Google Scholar]
- Titze I, Story B. Acoustic interactions of the voice source with the lower vocal tract. J Acoust Soc Am. 1997;101:2234–2243. doi: 10.1121/1.418246. [DOI] [PubMed] [Google Scholar]
- Udwadia ZF, Doshi AV, Lonkar SG, Singh CI. Prevalence of sleep-disordered breathing and sleep apnea in middle-aged urban Indian men. Am J Resp Crit Care. 2004;169(2):168–173. doi: 10.1164/rccm.200302-265OC. [DOI] [PubMed] [Google Scholar]
- Üstün T, Privett M, Lecrubier Y, Weiller E, Simon G, Korten A, Bassett S, Maier W, Sartorius N. Form, frequency and burden of sleep problems in general health care: A report from the WHO Collaborative Study on Psychological Problems in General Health Care. Eur Psychiat. 1996;11:5s–10s. [Google Scholar]
- Van Dongen H, Olofsen E, VanHartevelt J, Kruyt E. Searching for biological rhythms: peak detection in the periodogram of unequally spaced data. J Biol Rhythm. 1999;14(6):617–620. doi: 10.1177/074873099129000984. [DOI] [PubMed] [Google Scholar]
- van Kesteren E, van Maanen J, Hilgevoord A, Laman D, de Vries N. Quantitative effects of trunk and head position on the apnea hypopnea index in obstructive sleep apnea. Sleep. 2011;34(8):1075–1081. doi: 10.5665/SLEEP.1164. [DOI] [PMC free article] [PubMed] [Google Scholar]
- Van Someren EJ, Swaab DF, Colenda CC, Cohen W, McCall WV, Rosenquist PB. Bright light therapy: improved sensitivity to its effects on rest-activity rhythms in alzheimer patients by application of nonparametric methods. Chronobiol Int. 1999;16(4):505–518. doi: 10.3109/07420529908998724. [DOI] [PubMed] [Google Scholar]
- Vanoli E, Adamson PB, Ba-Lin, Pinna GD, Lazzara R, Orr WC. Heart rate variability during specific sleep stages. Circulation. 1995;91:1918–1922. doi: 10.1161/01.cir.91.7.1918. [DOI] [PubMed] [Google Scholar]
- Walther S, Horn H, Razavi N, Koschorke P, Müller TJ, Strik W. Quantitative motor activity differentiates schizophrenia subtypes. Neuropsychobiology. 2009;60(2):80–86. doi: 10.1159/000236448. [DOI] [PubMed] [Google Scholar]
- Wang C, Ahmed A, Hunter A. Vision analysis in detecting abnormal breathing activity in application to diagnosis of obstructive sleep apnoea. Engineering in Medicine and Biology Society, 2006. EMBS 2006; 28th Annual International Conference of the IEEE; IEEE; 2006. pp. 4469–4473. [DOI] [PubMed] [Google Scholar]
- Wang C, Ahmed A, Hunter A. Proceedings of World Congress on Engineering. Vol. 2. Citeseer; 2007. Locating the upper body of covered humans in application to diagnosis of obstructive sleep apnea; pp. 662–667. [Google Scholar]
- Wang C, Hunter A, Gravill N, Matusiewicz S. Real time pose recognition of covered human for diagnosis of sleep apnoea. Comput Med Imag Grap. 2010;34(6):523–533. doi: 10.1016/j.compmedimag.2009.11.004. [DOI] [PubMed] [Google Scholar]
- Wang Y, Wang W, Liu Y, Wang D, Liu B, Shi Y, Gao P. Feature Extracting of Weak Signal in Real-Time Sleeping EEG with Approximate Entropy and Bispectrum Analysis. Bioinformatics and Biomedical Engineering, 2009. ICBBE 2009; 3rd International Conference on; IEEE; 2009. pp. 1–4. [Google Scholar]
- Warrell DA, Cox TM, Firth JD. Oxford Textbook of Medicine. United Kingdom: Oxford University Press Oxford; 2003. [Google Scholar]
- Waters F, Sinclair C, Rock D, Jablensky A, Foster RG, Wulff K. Daily variations in sleepwake patterns and severity of psychopathology: A pilot study in community-dwelling individuals with chronic schizophrenia. Psychiat Res. 2011;187(1):304–306. doi: 10.1016/j.psychres.2011.01.006. [DOI] [PubMed] [Google Scholar]
- Webster JG. Design of pulse oximeters. Taylor & Francis; 1997. [Google Scholar]
- Webster J, Kripke D, Messin S, Mullaney D, Wyborney G. An activity-based sleep monitor system for ambulatory use. Sleep. 1982;5(4):389. doi: 10.1093/sleep/5.4.389. [DOI] [PubMed] [Google Scholar]
- Wirz-Justice A. Chronobiology and psychiatry. Sleep Med Rev. 2007;11(6):423–427. doi: 10.1016/j.smrv.2007.08.003. [DOI] [PubMed] [Google Scholar]
- Wirz-Justice A, Haug H, Cajochen C. Disturbed circadian Rest-Activity cycles in schizophrenia patients: An effect of drugs? Schizophrenia Bull. 2001;27(3):497–502. doi: 10.1093/oxfordjournals.schbul.a006890. [DOI] [PubMed] [Google Scholar]
- Wirz-Justice A, Schröder CM, Gasio PF, Cajochen C, Savaskan E. The circadian Rest-Activity cycle in korsakoff psychosis. Am J Geriat Psychiat. 2010;18(1):33–41. doi: 10.1097/JGP.0b013e3181b0467a. [DOI] [PubMed] [Google Scholar]
- Witting W, Kwa I, Eikelenboom P, Mirmiran M, Swaab D. Alterations in the circadian rest-activity rhythm in aging and Alzheimer’s disease. Biol Psychiatry. 1990;27(6):563–572. doi: 10.1016/0006-3223(90)90523-5. [DOI] [PubMed] [Google Scholar]
- Wright K, Johnstone Y, Fabregas S, Shambroom J. Sleep. Vol. 31. AMER ACAD SLEEP MEDICINE ONE WESTBROOK CORPORATE CTR, STE 920, WESTCHESTER, IL 60154 USA; 2008. Evaluation of a portable dry sensor based automatic sleep monitoring system; pp. A337–A337. [Google Scholar]
- Wulff K, Dijk DJ, Middleton B, Foster RG, Joyce EM. Sleep and circadian rhythm disruption in schizophrenia. Brit J Psychiat. 2012;200(4):308–316. doi: 10.1192/bjp.bp.111.096321. [DOI] [PMC free article] [PubMed] [Google Scholar]
- Wulff K, Gatti S, Wettstein J, Foster R. Sleep and circadian rhythm disruption in psychiatric and neurodegenerative disease. Nat Rev Neurosci. 2010;11(8):589–599. doi: 10.1038/nrn2868. [DOI] [PubMed] [Google Scholar]
- Wulff K, Joyce E. Circadian rhythms and cognition in schizophrenia. Brit J Psychiat. 2011;198(4):250–252. doi: 10.1192/bjp.bp.110.085068. [DOI] [PubMed] [Google Scholar]
- Wulff K, Joyce E, Middleton B, Dijk D, Foster RG. The suitability of actigraphy, diary data, and urinary melatonin profiles for quantitative assessment of sleep disturbances in schizophrenia: a case report. Chronobiol Int. 2006;23(1–2):485–495. doi: 10.1080/07420520500545987. [DOI] [PubMed] [Google Scholar]
- Yadollahi A, Moussavi Z. Formant analysis of breath and snore sounds. Engineering in Medicine and Biology Society, 2009. EMBC 2009; Annual International Conference of the IEEE; IEEE; 2009. pp. 2563–2566. [DOI] [PubMed] [Google Scholar]
- Yen FC, Behbehani K, Lucas EA, Burk JR, Axe JR. A noninvasive technique for detecting obstructive and central sleep apnea. IEEE T Bio-Med Eng. 1997;44(12):1262–1268. doi: 10.1109/10.649998. [DOI] [PubMed] [Google Scholar]
- Yeung CK, Sihoe JDY, Sit F, Bower WF, Sreedhar B, Lau JTF. Characteristics of primary nocturnal enuresis in adults: an epidemiological study. BJU Int. 2004;93(3):341–345. doi: 10.1111/j.1464-410x.2003.04612.x. [DOI] [PubMed] [Google Scholar]
- Young T, Evans L, Finn L, Palta M. Estimation of the clinically diagnosed proportion of sleep apnea syndrome in middle-aged men and women. Sleep. 1997;20(9):705–706. doi: 10.1093/sleep/20.9.705. [DOI] [PubMed] [Google Scholar]
- Young T, Palta M, Dempsey J, Skatrud J, Weber S, Badr S. The occurrence of sleep-disordered breathing among middle-aged adults. New Engl J Med. 1993;328(17):1230–1235. doi: 10.1056/NEJM199304293281704. [DOI] [PubMed] [Google Scholar]
- Young T, Peppard PE, Gottlieb DJ. Epidemiology of obstructive sleep apnea: a population health perspective. Am J Resp Crit Care. 2002;165(9):1217–1239. doi: 10.1164/rccm.2109080. [DOI] [PubMed] [Google Scholar]
- Zhang S, Rowlands AV, Murray P, Hurst TL. Physical activity classification using the GENEA Wrist-Worn accelerometer. Med Sci Sports Exercise. 2012;44(4):742–748. doi: 10.1249/MSS.0b013e31823bf95c. [DOI] [PubMed] [Google Scholar]