Abstract
The method of phasing broadband FT-ICR spectra allows plotting the spectra in the absorption-mode; this new approach significantly improves the quality of the data at no extra cost. Herein, an internal calibration method for calculating the phase function has been developed, and successfully applied to the top-down spectra of modified proteins, where the peak intensities vary by >100×. The result shows that the use of absorption-mode spectra allows more peaks to be discerned within the recorded data, and this can reveal much greater information about the protein and modifications under investigation. In addition, noise and harmonic peaks can be assigned immediately in the absorption-mode.
Keywords: absorption-mode, top-down, harmonics, apodization
Introduction
Fourier transform ion cyclotron resonance (FT-ICR) mass spectrometry is used extensively in the field of proteomics, metabolomics, and petroleomics because of its superior mass resolving power, accuracy, and comparable sensitivity.1-2 Furthermore, its compatibility with different fragmentation methods makes FT-ICR ideal for tandem mass spectrometric analysis of large biological molecules.3-5 The quality of a spectrum is the key for data interpretation, and in real experiments, not all protein fragments provide sufficient number of detectable multiple charge states for classic “deconvolution”.6 Furthermore, mass spectra from FT instruments often contain harmonic and noise peaks which leads to false results in the interpretation of complex spectra.7-8 Therefore, any method which could both increase the number of detectable peaks and identify any artificial peaks in a spectrum would be of great benefit in the study of complex samples.
Recently, different methods have been developed for phase correcting FT-ICR spectra, allowing the spectra to be displayed in the absorption-mode. The method by F. Xian et al., uses a detailed model of the excitation pulse from each experiment.9 Unfortunately, commercial instruments do not record these data sufficiently accurately, and additionally, interference from the image charge effect or other field inhomogeneities introducing space charge, can also affect the accuracy of the phase function.10 Another method by Y. Qi et al., uses quadratic least-squares fit and iteration to form a phase function for spectra from without prior knowledge of the instrument pulse program;11 this method only requires the raw transient and signal acquisition rate, and allows phase correction to be largely automated for broad application.10
As noted in previous publications, compared to the conventional magnitude-mode presentation of spectra, the absorption-mode offers improvements in both the resolving power and the S/N of spectra: 1) the resolving power improves approximately by a factor of √3-2×, depending on the damping of the transient;12 2) the S/N increases by a factor of √2×, as phase correction aligns the data points (vectors) with the real axis of the complex space so that the values of the imaginary part become zero;13 3) the correlation between the intensities of the fine-structure isotopic peaks compared to their theoretical intensities improves by over 2×.14 Apart from that, recent research shows that the artificial peaks in the spectrum (from harmonics or radio-frequency interference) can be easily distinguished in absorption-mode spectra as these peaks do not phase correctly. And furthermore, use of a half window apodization function retains the most intense signal at beginning of the transient so that the absorption-mode signal will not be over-suppressed as often occurs in the magnitude-mode (see below). Given the combined effect of all the factors described above, the overall ‘quality’ of an absorption-mode spectrum can be improved by much more than 2× over the equivalent magnitude-mode. And by using the absorption-mode spectrum, it is possible to make many new peak assignments which could not be found using the magnitude-mode spectrum of the same data.
Previously, most demonstrations on absorption-mode spectra have used petroleum data where the m/z is below 1000, because calculation of the phase function initially requires a spectrum with a sufficient peak density across the entire mass range of interest (e.g. petroleum spectra).9, 13 This phase function could then be applied to other, low peak density spectra (e.g. protein spectra) in order to allow them to be displayed in absorption-mode. This approach is akin to external mass calibration in difficulty. In this study, a method for performing internal phase correction has been investigated, where the phase function is derived using ions of cesium perfluoroheptanoic acetate (CsPFHA), added into other samples as an internal calibrant. This paper provides the first examples for phase correction of top-down spectra, ranging from small peptides (bombesin, digested collagen) to large proteins (calmodulin, hemoglobin tetramer), as well as a MS3 spectrum of β2 microglobulin acquired from a different research laboratory. In these examples, the absorption-mode spectra display a significant number of additional low S/N and high m/z peaks, which were previously undetectable in the baseline, and so reveal much more information which was not apparent in the magnitude-mode spectra. Besides that, it is proved that the phase correction method can be applied to FT-ICR spectra worldwide, regardless of the experimental conditions and instrument parameters on which the spectrum was recorded, because this method is a post-process procedure requiring only the raw transient and acquisition rate, and to promote its application, an Autophaser program10 will be available soon from our group.
Experimental
Sample Description
Collagen, bombesin, calmodulin, hemoglobin, β2 microglobulin, trypsin, cesium iodide, and perfluoroheptanoic acid were purchased from Sigma Aldrich (Gillingham, UK); the crude oil standard (SRM 2721, light-sour) was purchased from NIST (Gaithersburg, MD, USA). The hemoglobin powder was diluted to 5 uM in 100 mM ammonium acetate (pH 6.8) for native state spectrum without desalting. Preparation of other samples can be found in previous publications.13, 15-19 The CsPFHA clusters (m/z up to 8000) were prepared according to the literature.20 In order to generate sufficient peaks in the high m/z range for the calculation of phase function, CsPFHA ions were added to each experiment by dual-electrospray, to reduce the matrix effect.21
Data Processing
All spectra were recorded using a solariX 12 T FT-ICR mass spectrometer (Bruker Daltonik GmbH, Bremen, Germany), equipped with an Infinity cell.22 300 individual transients (2.3 s) of hemoglobin were collected and co-added. 40–300 individual transients (1.7 s) for the bombesin, collagen, calmodulin, microglobulin were collected and co-added. The acquired transients were then apodized by either a full Hanning for magnitude-mode23 or a half Hanning for absorption-mode24 (see supplemental information, Fig. S1) without any truncation of the signal, then zero-filled two times, and fast Fourier transformed in MatLab R2010a (MathWorks, Natick, MA, USA). The phase function was calculated utilizing the CsPFHA peaks across the entire spectrum. The pre-processed data sets were then written in Xmass format with appropriate parameters based on the data, and loaded into Bruker DataAnalysis software for peak detection and spectral interpretation.13
Results and Discussion
Detecting the Harmonics and other Artefacts
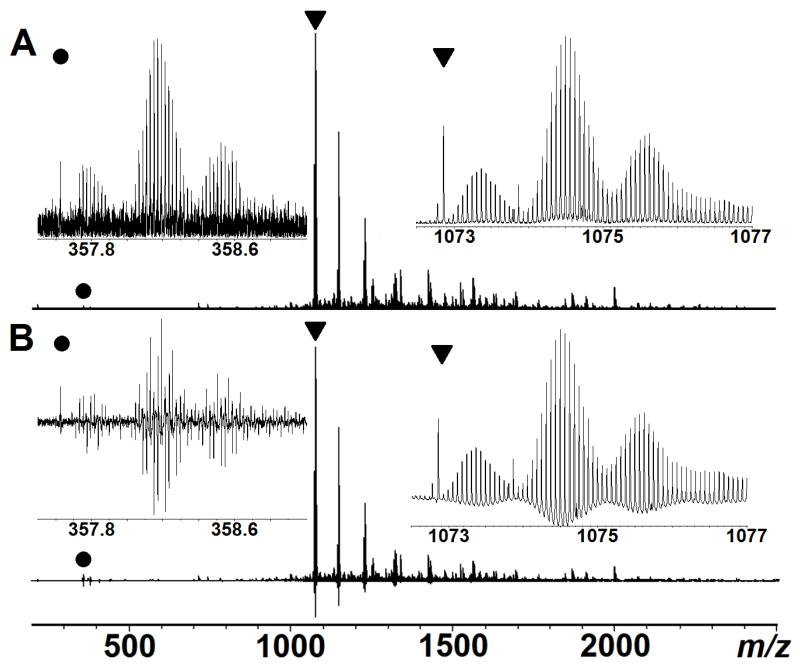
Second, third, and higher harmonic peaks are common artefacts which always exist in FT-based mass spectrometer (e.g., FT-ICR, Orbitrap, and ion trap instruments). In FT-ICR, odd harmonics are mostly generated by non-sinusoidal image current from finite size detection electrodes, while even harmonics are generated by non-zero magnetron radius or imbalance in the detection amplifiers.8 In addition to harmonics, imperfect electronics (e.g. imbalance of the amplifiers, overloading the analog-to-digital converter, radio-frequency interference) can also result in artefact peaks in the recorded spectrum.7 These artificial peaks contain no chemical information, but can greatly complicate the task of data interpretation, especially when the spectrum is complex. Fig.1 (left inset) expands the 3rd harmonic region in a top-down tandem mass spectrum of calmodulin bound with cisplatin; in the conventional magnitude-mode, the harmonics appear like a typical protein isotopic distributions. Generally, identifying the harmonics requires correlation of the peaks to higher m/z primary signals which is easily done in simple spectra, but can be challenging for complex spectra. Here, in the absorption-mode, any artefacts can be directly recognized by the anomalous phase variation because they cannot be phased properly using the correct phase function. Therefore, by plotting the spectrum in the absorption-mode, any artefacts can be easily recognized which facilitates data interpretation. Apart from that, it is interesting to note that the absorption-mode spectrum shows an oscillation at the baseline (Fig.1B), such oscillation is caused by two different sources: 1) a low periodic frequency oscillation (known as baseline roll),25 and 2) distortion near signal peaks proportional to signal magnitude (known as Sinc function deviations).12 However, such baseline distortion can be removed or ameliorated by post-processing.10, 25
Figure 1.
ECD spectrum of calmodulin+cisplatin mixture in both magnitude (A) and absorption-mode (B). The inserts on the right are zoom in of the original peaks (labeled with a triangle in the spectra), and the inserts on the left are their 3rd harmonics (labeled with a dot).
Effects of Apodization
The Fourier transform of a damped, finite, periodic signal will generate tails on the peak which vary in intensity based on the damping mode of the transient, and these tails can interfere with low-intensity peaks nearby. Therefore, the time-domain transient is multiplied by a window function prior to Fourier transform in order to smooth the peak shape and minimize the sideband intensities (see supplementary information, Fig.S1).8 This procedure is called “apodization”; an optimal window function removes the sidebands at a cost of S/N and resolving power. However, the effect of apodization is dependent on the ratio of sample acquisition time and its damping constant (T/τ), which varies significantly from spectrum to spectrum. The effect of full window versus half window apodization functions is fully discussed in the supplementary information, but generally the half window apodization is best for absorption-mode, while a full window is useful for magnitude-mode. Furthermore, use of a full window apodization function with the absorption-mode suppresses the signal at the beginning of the transient, and generates artificial negative intensity sidebands on both sides of the peak which greatly distort the spectrum (details in supplementary information).
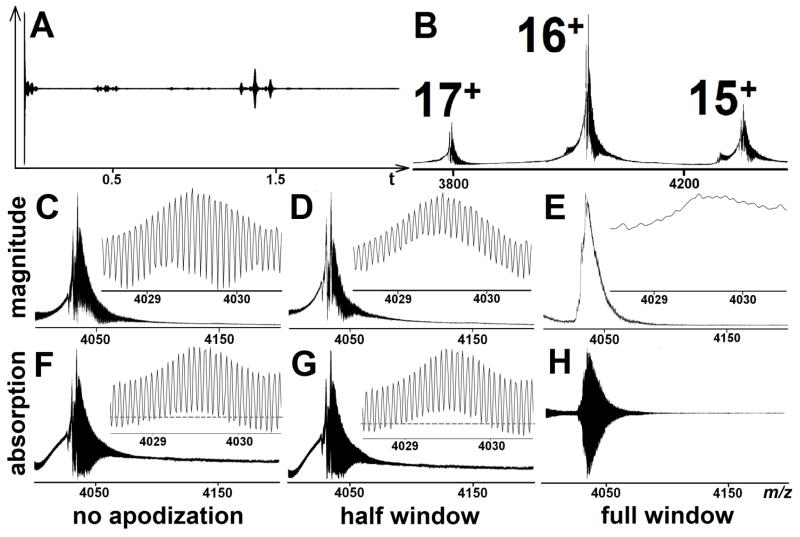
Fig.2 shows a particularly difficult case involving the low charge states of intact hemoglobin (Hb, 65 kDa) by applying different window functions. Hb is an assembly of four subunits, each subunit is associated with a heme group, and thus allows study of non-covalent bond interactions.26 During the experiment, the Hb powder was dissolved in ammonium acetate without desalting to deliberately complicate the spectrum, and a 2.3 s transient was recorded with the corresponding m/z spectra showing the peaks of Hb tetramer. As is seen in Fig.2, the distribution of each charge state was broadened significantly, as the presence of salts in the sample reduced the overall molecular ion abundances and distributed the signal of each charge state into many adducted forms (m/z 3800-4400). Because of the high mass and low charge for the adduct form, only FT-ICR offers sufficient performance to resolve the isotopic peaks. In the unapodized magnitude-mode (Fig.2C), peaks are partially overlapped, but they can be resolved and their charge states can be assigned, however, the use of apodization greatly decreases the resolution. When the same spectrum is plotted in the absorption-mode, the isotopes are almost resolved at the baseline, and there is no significant change in the unapodized and half window apodized spectra. Furthermore, a surprising effect was observed when the full window function was applied. In the magnitude-mode shown in Fig.2E, the isotopic peaks become unresolved. From Fig.2A, it is clear to see that the first beat pattern of the Hb tetramer appears within 0.01 s which is the most intense part of the transient, and the second one appears at ~1.4 s (the period agrees with the theoretical calculation). Consequently, a full window function zeros the signal at the beginning of the transient; such suppression effect is expected to vary with the ratio of T/τ. In certain cases, as is shown here, the full window function seriously degrades the performance of the spectrum because the S/N and resolution are significantly reduced. Therefore, in Fig.2H, when the same phase correction was applied in the absorption-mode, the peaks were completely distorted. In summary, while lack of apodization is preferred, if apodization is needed for improvement of sidebands and peak shape for centroiding algorithms, a half window function is recommended for the absorption-mode spectrum.
Figure 2.
Transient and m/z spectra of hemoglobin tetramer with the charge states from 15 to 17. (A): original transient recorded for 2.3 s; (B): conventional magnitude-mode spectrum with no apodization. (C-E): Close-up of the 16+ magnitude-mode spectra with no apodization, half window, and full window apodization (baseline of spectrum is the m/z axis). (F-H): Close-up of the 16+ absorption-mode spectra with no apodization, half window, and full window apodization (baseline is labelled by dash).
Application to Modified Peptides and Proteins
For MS/MS spectra of peptides, due to the low mass and charge state, the resolution of the 12 T instrument is sufficient to separate the individual isotopic peaks so that most fragments from inter-residue bond cleavage can be confirmed in top-down spectrum; however, in some cases, S/N is insufficient. When the peptides bind to the metallodrugs, the anomalous isotopic pattern of the metal ion tends to distribute signal of the original peaks into different modified forms, thus, reducing the overall ion abundances and shifting the m/z of all peaks.
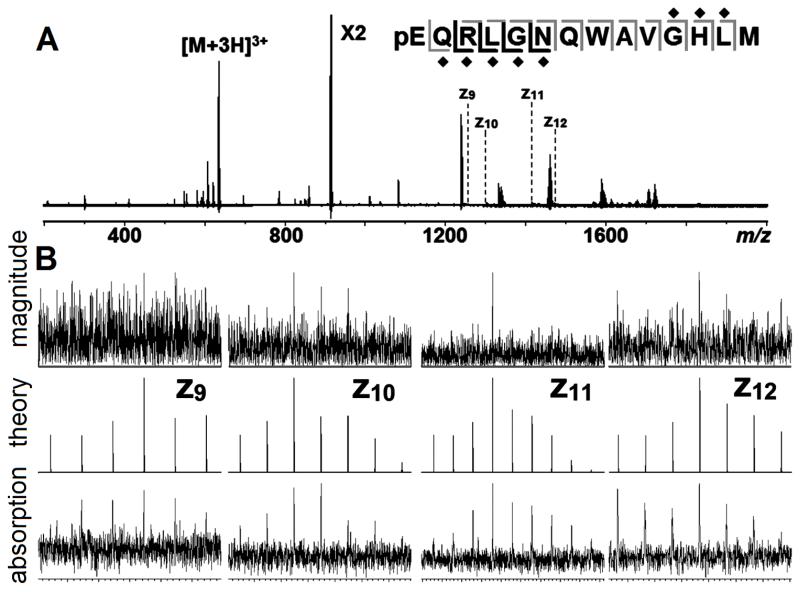
Organometallic Ru complexes have been investigated as a potent anticancer agent,27 and FT-ICR studies have provided insights into its preferred binding sites on proteins. As shown in Fig.3A&B, the ECD spectrum of Ru bound to bombesin yielded almost all the inter-residue bond cleavages. However, the S/N of a Ru modified bombesin are much lower than in the corresponding unmodified spectrum due to the broad isotope distribution of Ru, and additionally, the electrons are captured much more easily by metal ions, which reduces the probability of ECD cleavage on the peptide backbone. By presenting the spectrum in absorption-mode, the S/N and isotope distributions were improved, and four new Ru-modified fragments were observed which were not detected previously in the magnitude-mode (Fig.3B).
Figure 3.
(A): ECD spectrum of Ru binding bombesin, with the cleavage map. Fragments observed in magnitude-mode are in grey, new fragments in absorption-mode are in black, the Ru binding sites are labelled by diamond. (B): zoom in of fragment in magnitude (top), absorption-mode (bottom), and its isotope simulation (middle).
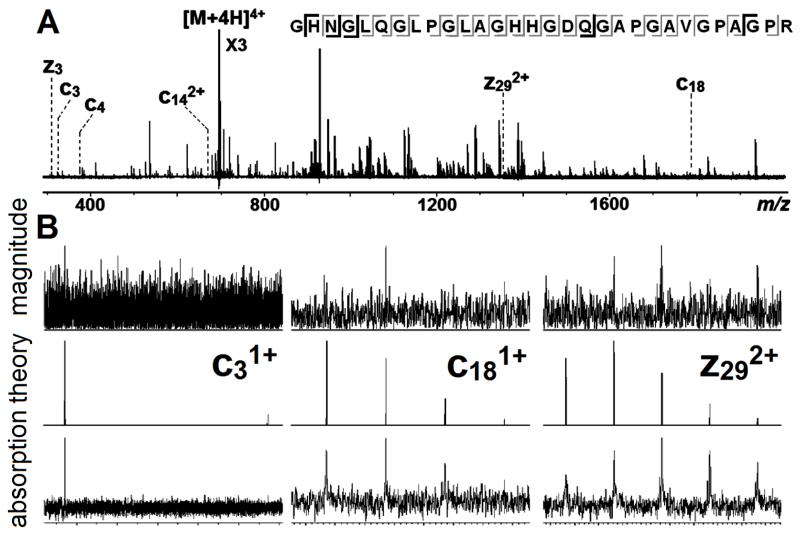
The benefits of this spectral improvement can also be seen in the analysis of digested collagen. In magnitude-mode, 57 c/z fragments could be assigned,15 accounting for 24 inter-residue bond cleavages (4 prolines in the sequence cannot be cleaved via ECD). As is shown in Fig.4A&B, the same fragments were also observed in the absorption-mode, but with a much smoother isotope distribution. Furthermore, 7 new fragments were detected, which were previously hidden in the noise in magnitude-mode (note that the misalignment of peaks with the simulation is caused by hydrogen transfer between the c’ and z· ions).28-29
Figure 4.
(A): ECD spectrum of collagen with the cleavage map (fragments observed in magnitude-mode are in grey; new fragments in absorption-mode are in black, labelled in the spectrum). (B): zoom in of fragment in magnitude (top), absorption-mode (bottom), and its isotope simulation (middle).
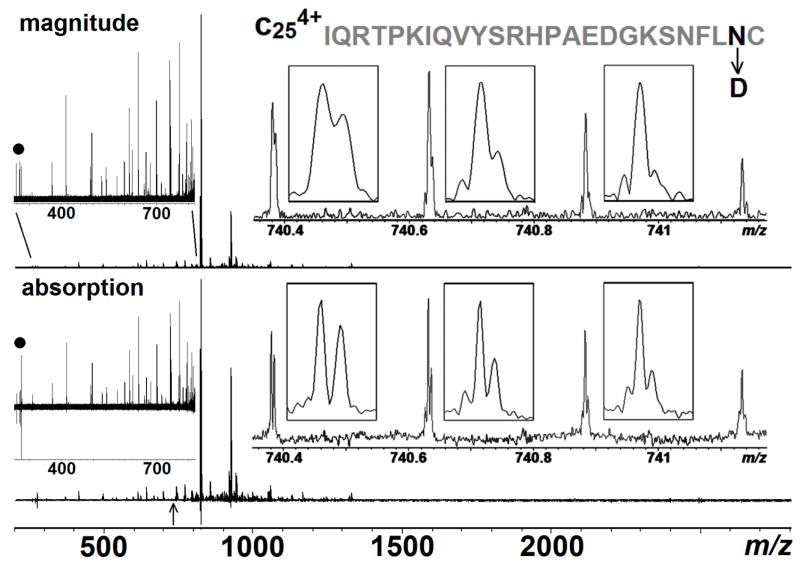
Investigating PTMs of large biological macromolecules is one of the most significant challenges facing MS analysis. Deamidation is, perhaps, the most common PTMs in proteins, which produces a mixture of asparagine (Asn), aspartic acid (Asp) and isoaspartic acid. Asn deamidation results in a 0.984 Da mass shift which is very close to the 13C isotope of the unmodified form, which means there is only a 0.019 Da difference between the Asn and Asp isotopes.30 Therefore, determining the extent of deamidation in a protein requires sufficient mass resolving power to separate the individual isotopic peaks. For example, Fig.5 shows an ECD spectrum (MS3) on the b9+63 fragment formed by CAD of β2 microglobulin; this spectrum was acquired by Yu et al. from Boston University on their 12 T FT-ICR mass spectrometer.19 The inset on the right is the expansion of the c4+25 fragment to show the detailed peak splitting. For a4+ charge segment, the Δm/z of Asn and Asp isotopes is ~0.0048, which is barely discernible in the magnitude-mode; by comparison, these peaks are clearly resolved in the absorption-mode due to the extra resolving power provided by phasing. The result not only shows a better peak splitting, but also illustrates that the phase correction method can be applied to the spectra acquired from different instruments without knowing precise details on experimental parameters.
Figure 5.
ECD spectrum (MS3) of the b 9+63 fragment from β2 microglobulin in both magnitude- and absorption-mode. The inserts on the right are zoom in of the c4+25 fragment (labelled with an arrow in the bottom) with its sequence and the deamidation site highlighted in black. The inserts on the left are zooms of m/z 250-820 to show the entire spectrum is properly phased, and the peaks labelled with a dot are 3rd harmonic peaks of the peaks in m/z ~823.
Conclusion
The absorption-mode spectra presented here represents a significant step towards improving the data quality of top-down spectra from modified protein at no extra cost. Phasing can be applied to petroleum, peptide, or protein transient without prior knowledge of instrumental conditions, and results in significant improvement in spectral qualities in terms of resolution, S/N, and mass accuracy. Phasing also allows immediate assignment of harmonics and noise peaks as they show an anomalous phase signature.
Supplementary Material
Acknowledgement
This work was supported by the University of Warwick, Department of Chemistry, and the Warwick Centre for Analytical Science (EPSRC funded EP/F034210/1). The authors would like to thank Dr. Weidong Cui (Department of Chemistry, Washington University) for helpful discussion.
References
- Macdonald D, editor. The New Encyclopedia of Mammals. Oxford University Press; Oxford, UK: 2001. American Opossums; pp. 808–814. [Google Scholar]
- Ahnelt PK, Hokoc JN, Rohlich P. Photoreceptors in a primitive mammal, the South American opossum, Didelphis marsupialis aurita: characterization with anti-opsin immunolabeling. Visual neuroscience. 1995;12(5):793–804. doi: 10.1017/s0952523800009366. [DOI] [PubMed] [Google Scholar]
- Allada R, Chung BY. Circadian organization of behavior and physiology in Drosophila. Annual review of physiology. 2010;72:605–624. doi: 10.1146/annurev-physiol-021909-135815. [DOI] [PMC free article] [PubMed] [Google Scholar]
- Birch D, Jacobs GH. Spatial contrast sensitivity in albino and pigmented rats. Vision research. 1979;19(8):933–937. doi: 10.1016/0042-6989(79)90029-4. [DOI] [PubMed] [Google Scholar]
- Cabana T. The development of mammalian motor systems: the opossum Monodelphis domestica as a model. Brain Res Bull. 2000;53(5):615–626. doi: 10.1016/s0361-9230(00)00395-6. [DOI] [PubMed] [Google Scholar]
- Campbell SS, Tobler I. Animal sleep: A review of sleep duration across phylogeny. Neuroscience & Biobehavioral Reviews. 1984;8:269–300. doi: 10.1016/0149-7634(84)90054-x. [DOI] [PubMed] [Google Scholar]
- Daly M, Behrends PR, Wilson MI, Jacobs LF. Behavioral Modulation of Predation Risk: Moonlight Avoidance and Crepuscular Compensation in a Nocturnal Desert Rodent, Dipodomys merriami. Animal behaviour. 1992;44(1):1–9. [Google Scholar]
- Dooley JC, Nguyen HM, Seelke AM, Krubitzer L. Visual acuity in the short-tailed opossum (Monodelphis domestica) Neuroscience. 2012;223:124–130. doi: 10.1016/j.neuroscience.2012.07.065. [DOI] [PMC free article] [PubMed] [Google Scholar]
- Goodstadt L, Heger A, Webber C, Ponting CP. An analysis of the gene complement of a marsupial, Monodelphis domestica: evolution of lineage-specific genes and giant chromosomes. Genome research. 2007;17(7):969–981. doi: 10.1101/gr.6093907. [DOI] [PMC free article] [PubMed] [Google Scholar]
- Hunt DM, Chan J, Carvalho LS, Hokoc JN, Ferguson MC, Arrese CA, Beazley LD. Cone visual pigments in two species of South American marsupials. Gene. 2009;433(1-2):50–55. doi: 10.1016/j.gene.2008.12.006. [DOI] [PubMed] [Google Scholar]
- Ilia M, Jeffery G. Retinal cell addition and rod production depend on early stages of ocular melanin synthesis. Journal of Comparative Neurology. 2000;420(4):437–444. [PubMed] [Google Scholar]
- Ivanco TL, Pellis SM, Whishaw IQ. Skilled forelimb movements in prey catching and in reaching by rats (Rattus norvegicus) and opossums (Monodelphis domestica): relations to anatomical differences in motor systems. Behavioural brain research. 1996;79(1-2):163–181. doi: 10.1016/0166-4328(96)00011-3. [DOI] [PubMed] [Google Scholar]
- Jacobs GH, Fenwick JA, Williams GA. Cone-based vision of rats for ultraviolet and visible lights. Journal of Experimental Biology. 2001;204(Pt 14):2439–2446. doi: 10.1242/jeb.204.14.2439. [DOI] [PubMed] [Google Scholar]
- Johnson RN. Illumination Preference of Albino Rats in a Closed Hexagonal Maze. Perceptual and motor skills. 1964a;19:827–830. doi: 10.2466/pms.1964.19.3.827. [DOI] [PubMed] [Google Scholar]
- Johnson RN. Illumination Preference of Albino Rats in a Closed Hexagonal Maze. Perceptual and motor skills. 1964b;19(3):827–830. doi: 10.2466/pms.1964.19.3.827. [DOI] [PubMed] [Google Scholar]
- Johnson RN. Illumination Preference of Albino Rats in a Tilt Box as a Function of Age and Illumination Intensity. Perceptual and motor skills. 1965;21(2):535–543. doi: 10.2466/pms.1965.21.2.535. [DOI] [PubMed] [Google Scholar]
- Kahn DM, Krubitzer L. Massive cross-modal cortical plasticity and the emergence of a new cortical area in developmentally blind mammals. Proc Natl Acad Sci U S A. 2002;99(17):11429–11434. doi: 10.1073/pnas.162342799. [DOI] [PMC free article] [PubMed] [Google Scholar]
- Karlen SJ, Kahn DM, Krubitzer L. Early blindness results in abnormal corticocortical and thalamocortical connections. Neuroscience. 2006;142(3):843–858. doi: 10.1016/j.neuroscience.2006.06.055. [DOI] [PubMed] [Google Scholar]
- Karlen SJ, Krubitzer L. Effects of bilateral enucleation on the size of visual and nonvisual areas of the brain. Cerebral Cortex. 2009;19(6):1360–1371. doi: 10.1093/cercor/bhn176. [DOI] [PMC free article] [PubMed] [Google Scholar]
- Kelly JB, Masterton B. Auditory sensitivity of the albino rat. Journal of comparative and physiological psychology. 1977;91(4):930–936. doi: 10.1037/h0077356. [DOI] [PubMed] [Google Scholar]
- Kimble D, Whishaw IQ. Spatial behavior in the Brazilian short-tailed opossum (Monodelphis domestica): comparison with the Norway rat (Rattus norvegicus) in the Morris water maze and radial arm maze. Journal of Comparative Psychology. 1994;108(2):148–155. doi: 10.1037/0735-7036.108.2.148. [DOI] [PubMed] [Google Scholar]
- Kimble DP. Didelphid behavior. Neuroscience and biobehavioral reviews. 1997;21(3):361–369. doi: 10.1016/s0149-7634(96)00016-4. [DOI] [PubMed] [Google Scholar]
- Kolb H, Wang HH. The distribution of photoreceptors, dopaminergic amacrine cells and ganglion cells in the retina of the North American opossum (Didelphis virginiana) Vision research. 1985;25(9):1207–1221. doi: 10.1016/0042-6989(85)90035-5. [DOI] [PubMed] [Google Scholar]
- Lavallee A, Pflieger J-F. Developmental expression of spontaneous activity in the spinal cord of postnatal opossums, Monodelphis domestica: An anatomical study. Brain Research. 20091282:1–9. doi: 10.1016/j.brainres.2009.05.068. [DOI] [PubMed] [Google Scholar]
- Lockard RB, Owings DH. Moon-Related Surface Activity of Bannertail (Dipodomys spectabilis) and Fresno (D. nitratoides) Kangaroo Rats. Animal behaviour. 1974;22(Feb):262–273. [Google Scholar]
- Longland WS. Effects of Artificial Bush Canopies and Illumination on Seed Patch Selection by Heteromyid Rodents. Am Midl Nat. 1994;132(1):82–90. [Google Scholar]
- Lund RD, Lund JS, Wise RP. The organization of the retinal projection to the dorsal lateral geniculate nucleus in pigmented and albino rats. Journal of Comparative Neurology. 1974;158(4):383–403. doi: 10.1002/cne.901580403. [DOI] [PubMed] [Google Scholar]
- Matsuo M, Tsuji K. Strain differences of the light-dark preference in inbred rats. Behavior genetics. 1989;19(3):457–466. doi: 10.1007/BF01066171. [DOI] [PubMed] [Google Scholar]
- Mendoza J, Graff C, Dardente H, Pevet P, Challet E. Feeding cues alter clock gene oscillations and photic responses in the suprachiasmatic nuclei of mice exposed to a light/dark cycle. J Neurosci. 2005;25(6):1514–1522. doi: 10.1523/JNEUROSCI.4397-04.2005. [DOI] [PMC free article] [PubMed] [Google Scholar]
- Mikkelsen TS, Wakefield MJ, Aken B, Amemiya CT, Chang JL, Duke S, Garber M, Gentles AJ, Goodstadt L, Heger A, Jurka J, Kamal M, Mauceli E, Searle SM, Sharpe T, Baker ML, Batzer MA, Benos PV, Belov K, Clamp M, Cook A, Cuff J, Das R, Davidow L, Deakin JE, Fazzari MJ, Glass JL, Grabherr M, Greally JM, Gu W, Hore TA, Huttley GA, Kleber M, Jirtle RL, Koina E, Lee JT, Mahony S, Marra MA, Miller RD, Nicholls RD, Oda M, Papenfuss AT, Parra ZE, Pollock DD, Ray DA, Schein JE, Speed TP, Thompson K, VandeBerg JL, Wade CM, Walker JA, Waters PD, Webber C, Weidman JR, Xie X, Zody MC, Graves JA, Ponting CP, Breen M, Samollow PB, Lander ES, Lindblad-Toh K. Genome of the marsupial Monodelphis domestica reveals innovation in non-coding sequences. Nature. 2007;447(7141):167–177. doi: 10.1038/nature05805. [DOI] [PubMed] [Google Scholar]
- Ortin-Martinez A, Jimenez-Lopez M, Nadal-Nicolas FM, Salinas-Navarro M, Alarcon-Martinez L, Sauve Y, Villegas-Perez MP, Vidal-Sanz M, Agudo-Barriuso M. Automated quantification and topographical distribution of the whole population of S- and L-cones in adult albino and pigmented rats. Investigative ophthalmology & visual science. 2010;51(6):3171–3183. doi: 10.1167/iovs.09-4861. [DOI] [PubMed] [Google Scholar]
- Pisula W, Turlejski K, Stryjek R, Nalecz-Tolak A, Grabiec M, Djavadian RL. Response to novelty in the laboratory Wistar rat, wild-captive WWCPS rat, and the gray short-tailed opossum (Monodelphis domestica) Behavioural processes. 2012;91(2):145–151. doi: 10.1016/j.beproc.2012.06.010. [DOI] [PubMed] [Google Scholar]
- Price MV, Waser NM, Bass TA. Effects of Moonlight on Microhabitat Use by Desert Rodents. J Mammal. 1984;65(2):353–356. [Google Scholar]
- Prusky GT, Harker KT, Douglas RM, Whishaw IQ. Variation in visual acuity within pigmented, and between pigmented and albino rat strains. Behavioural brain research. 2002;136(2):339–348. doi: 10.1016/s0166-4328(02)00126-2. [DOI] [PubMed] [Google Scholar]
- Randolph M. Role of Light and Circadian Rhythms in Nocturnal Behavior of Galago-Crassicaudatus. Journal of comparative and physiological psychology. 1971;74(1):115–&. doi: 10.1037/h0030309. [DOI] [PubMed] [Google Scholar]
- Robert S, Dallaire A. Polygraphic analysis of the sleep-wake states and the REM sleep periodicity in domesticated pigs (Sus scrofa) Physiology & behavior. 1986;37(2):289–293. doi: 10.1016/0031-9384(86)90235-0. [DOI] [PubMed] [Google Scholar]
- Robert S, Dancosse J, Dallaire A. Some observations on the role of environment and genetics in behaviour of wild and domestic forms of Sus scrofa (European wild boars and domestic pigs) Applied Animal Behavious Science. 1987;17(3-4):253–262. [Google Scholar]
- Ruckebusch Y. The relevance of drowsiness in the circadian cycle of farm animals. Animal behaviour. 1972;20:637–643. doi: 10.1016/s0003-3472(72)80136-2. [DOI] [PubMed] [Google Scholar]
- Samollow PB. The opossum genome: insights and opportunities from an alternative mammal. Genome research. 2008;18(8):1199–1215. doi: 10.1101/gr.065326.107. [DOI] [PMC free article] [PubMed] [Google Scholar]
- Saunders NR, Adam E, Reader M, Mollgard K. Monodelphis domestica (grey short-tailed opossum): An accessible model for studies of early neocortical development. Anatomy and Embryology. 1989;180:227–236. doi: 10.1007/BF00315881. [DOI] [PubMed] [Google Scholar]
- Saunders NR, Kitchener P, Knott GW, Nicholls JG, Potter A, Smith TJ. Development of walking, swimming and neuronal connections after complete spinal cord transection in the neonatal opossum, Monodelphis domestica. The Journal of Neuroscience. 1998;18(1):339–355. doi: 10.1523/JNEUROSCI.18-01-00339.1998. [DOI] [PMC free article] [PubMed] [Google Scholar]
- Seelke AMH, Dooley JC, Krubitzer L. Differential changes in the cellular composition of the developing marsupial brain. Journal of Comparative Neurology. 2013;52(11):2602–2620. doi: 10.1002/cne.23301. [DOI] [PMC free article] [PubMed] [Google Scholar]
- Streilein KE. Behavior, ecology, and distribution of South American marsupials. In: Mares MA, Genoways HH, editors. Mammalian Biology in South America. The University of Pittsburgh; Linesville, PA: 1982. pp. 231–250. [Google Scholar]
- Szel A, Rohlich P. Two cone types of rat retina detected by anti-visual pigment antibodies. Experimental eye research. 1992;55(1):47–52. doi: 10.1016/0014-4835(92)90090-f. [DOI] [PubMed] [Google Scholar]
- Tapia-Osorio A, Salgado-Delgado R, Angeles-Castellanos M, Escobar C. Disruption of circadian rhythms due to chronic constant light leads to depressive and anxiety-like behaviors in the rat. Behavioural brain research. 2013;252:1–9. doi: 10.1016/j.bbr.2013.05.028. [DOI] [PubMed] [Google Scholar]
- Thomas BB, Aramant RB, Sadda SR, Seiler MJ. Light response differences in the superior colliculus of albino and pigmented rats. Neuroscience Letters. 2005;385(2):143–147. doi: 10.1016/j.neulet.2005.05.034. [DOI] [PubMed] [Google Scholar]
- Trent BK, Tucker ME, Lockard JS. Activity Changes with Illumination in Slow Loris (Nycticebus coucang) Appl Anim Ethol. 1977;3(3):281–286. [Google Scholar]
- Walls GL. The visual cells of the white rat. Comparative Psychology. 1934;18(3):363–366. [Google Scholar]
- Wesierska M, Turlejski K. Spontaneous behavior of the gray short-tailed opossum (Monodelphis domestica) in the elevated plus-maze: comparison with Long-Evans rats. Acta Neurobiol Exp (Wars) 2000;60(4):479–487. doi: 10.55782/ane-2000-1367. [DOI] [PubMed] [Google Scholar]
- Wesierska M, Walasek G, Kilijanek J, Djavadian RL, Turlejski K. Behavior of the gray short-tailed opossum (Monodelphis domestica) in the open field and in response to a new object, in comparison with the rat. Behavioural brain research. 2003;143(1):31–40. doi: 10.1016/s0166-4328(03)00007-x. [DOI] [PubMed] [Google Scholar]
- Wilson D, Reeder D. Mammalian species of the world: A taxonomic and geographic reference. Smithsonian Institution Press; Washington D.C.: 1993. [Google Scholar]
- Wolfe JL, Summerlin CT. The influence of lunar light on nocturnal activity of the old-field mouse. Animal behaviour. 1989;37:410–414. [Google Scholar]
- Woodhouse R, Greenfeld N. Responses of albino and hooded rats to various illumination choices in a six-chambered alleyway. Perceptual and motor skills. 1985;61(2):343–354. doi: 10.2466/pms.1985.61.2.343. [DOI] [PubMed] [Google Scholar]
Associated Data
This section collects any data citations, data availability statements, or supplementary materials included in this article.


