

Abstract
Objectives
As evidence suggests visit-to-visit variability (VVV) of blood pressure (BP) is associated with cardiovascular events and mortality, there is increasing interest in identifying interventions that reduce VVV of BP. We investigated the effects of weight loss and sodium reduction, alone or in combination, on VVV of BP in participants enrolled in phase II of the Trials of Hypertension Prevention.
Methods
BP readings were taken at 6-month intervals for 36 months in 1,820 participants with high-normal diastolic BP (DBP) who were randomized to weight loss, sodium reduction, combination (weight loss and sodium reduction), or usual care groups. VVV of BP was defined as the standard deviation of BP across 6 follow-up visits.
Results
VVV of systolic BP (SBP) was not significantly different between participants randomized to the weight loss (7.2 ± 3.1 mmHg), sodium reduction (7.1 ± 3.0 mmHg), or combined (6.9 ± 2.9 mmHg) intervention groups vs. the usual care group (6.9 ± 2.9 mmHg). In a fully adjusted model, no difference (0.0 ± 0.2 mmHg) in VVV of SBP was present between individuals who successfully maintained their weight loss versus individuals who did not lose weight during follow-up (p=0.93). Also, those who maintained a reduced sodium intake throughout follow-up did not have lower VVV of SBP compared to those who did not reduce their sodium intake (0.1 ± 0.3 mmHg; p=0.77). Results were similar for VVV of DBP.
Conclusions
These findings suggest that weight loss and sodium reduction may not be effective interventions for lowering VVV of BP in individuals with high-normal DBP.
Keywords: blood pressure variability, hypertension, lifestyle, weight loss, sodium reduction
INTRODUCTION
Evidence has accumulated to show that visit-to-visit variability (VVV) of blood pressure (BP) is associated with cardiovascular events including stroke, coronary heart disease, and mortality1–5. The association between VVV of BP and these outcomes is independent of several potential confounders including mean BP. A reduction in mean BP has been the principal target of antihypertensive therapy for decades. However, recent evidence suggests that specific classes of antihypertensive medications lower VVV of BP and this reduction in VVV of BP has been linked to a lower stroke risk, independent of treatment effects on mean BP6.
Recommendations for the control of high BP emphasize lifestyle modification, including weight loss and reduction of sodium intake7. These recommendations stem from a substantial and largely consistent body of evidence from randomized controlled trials that have documented that lifestyle interventions reduce mean BP, with the most recent meta-analyses reporting that weight loss and sodium intake reduction lower mean systolic BP (SBP) by 4.9 and 5.0 mmHg, respectively, and mean diastolic BP (DBP) by 2.7 and 4.9 mmHg, respectively8,9. Although the beneficial effects of lifestyle interventions on mean BP are well established, scant attention has been paid to the efficacy of non-pharmacologic treatment modalities on VVV of BP. The purpose of this study, therefore, was to investigate the effects of weight loss and sodium intake reduction on VVV of BP using data collected from phase II of the Trials of Hypertension Prevention (TOHP II), a randomized controlled trial that examined the BP lowering effects of weight loss and sodium reduction, alone and in combination, in overweight adults with high-normal DBP10.
METHODS
Study Design
Details of TOHP II study design, recruitment, and methodology have been previously described10–13. Briefly, TOPH II was a multicenter, randomized controlled trial of 2,382 participants randomly assigned to one of four treatment groups: weight loss alone, sodium reduction alone, combined weight loss and sodium reduction, or usual care for 36–48 months. The TOHP II clinical centers included locations across the U.S.: Baltimore, MD; Birmingham, AL; Davis, CA; Jackson, MS; Memphis, TN; Newark, NJ; Portland, OR; Pittsburgh, PA; and St. Louis, MO. All participants provided written informed consent. This secondary analysis used public access data from TOHP II and was approved by the institutional review board at Columbia University Medical Center.
For inclusion, participants were required to be 30–54 years of age, have a DBP of 83–89 mmHg and a SBP <140 mmHg, and have a body mass index (BMI) of 26.1–37.4 kg/m2 for men and 24.4–37.4 kg/m2 for women. Exclusion criteria included: active treatment with antihypertensive medication or use of medication that affects BP, cardiovascular disease, diabetes, renal insufficiency, alcohol intake >21 drinks/week, chronic and/or life-threatening illness requiring regular medical treatment, and current/planned pregnancy.
Intervention
The structure and content of the weight loss and sodium reduction interventions have been previously described12. Briefly, the first 10–14 weeks of the intervention consisted of an intensive intervention stage with weekly group counseling. This stage was followed by a transitional phase designed to prevent relapse and ease the transition from weekly to less frequent contact with intervention staff and consisted of 4–6 biweekly sessions. After the transitional phase, participants entered a final extended stage which lasted through 36 months post-randomization for the purposes of maintaining participants’ behavior changes. Average weight loss at 6 months was −4.5 ± 0.3 kg and −4.3 ± 0.3 kg in the weight loss and combined intervention groups, respectively, compared to the usual care group. Also at 6 months, average reductions in urinary sodium excretion in the sodium reduction and combined intervention groups was −50.4 ± 13.8 mmol/d and −36.7 ± 13.3 mmol/day, respectively, compared to the usual care group13.
Overview of Study Measures
Three screening visits were conducted prior to randomization. During these visits, sociodemographic characteristics (age, sex, race/ethnicity, education, employment status) and health habits (cigarette smoking, alcohol consumption, physical activity) were obtained by questionnaire. BP, heart rate (HR), and anthropometric measurements were obtained at clinic visits during screening. Participants also provided a 24-hour urine sample which was analyzed for sodium and potassium excretion.
Follow-up visits were conducted at 6-month intervals following randomization for 36 months. Weight, BP, HR, and medication use information were recorded at every follow-up visit. Twenty-four hour urine samples were collected during the 18- and 36-month visits. All measures were obtained by trained staff, blinded to group assignment.
BP Measurement and Definitions of VVV
Figure 1 shows when BP measurements were obtained in TOPH II (upper panel). BP was measured at the three screening visits (baseline) which were each separated by a period of 7–45 days (median intervals: 14 days between visits 1 and 2; 15 days between visits 2 and 3). During follow-up, BP measurements were obtained at three separate visits at 7–10-day intervals at the 18- and 36-month follow-up periods. BP was obtained during a single visit at all other follow-up periods (6-, 12-, 24-, and 30-month visits). For each visit, three BP readings were obtained in the seated position after 5 minutes of rest by trained staff blinded to the randomization assignment using a random-zero sphygmomanometer and an appropriately sized arm cuff. The average of the three measurements was used as the BP for each visit. Study visits were scheduled on non-exercise days and every effort was taken to measure BP during follow-up visits at the same time of day as when the baseline visit occurred. To minimize measurement variability across BP observers, uniform training (minimum of 4–5 half-day training sessions) and certification of BP observer were required and recertification was performed at 6-month intervals. To ensure high quality data, a data collection and quality assurance subcommittee reviewed the performance of each clinical center at regular intervals. BP data were monitored for digit preference, error on data collection forms, and protocol compliance. At least one site visit to assess protocol compliance was made to each clinical center, with additional visits conducted on an as-needed basis.
Figure 1.
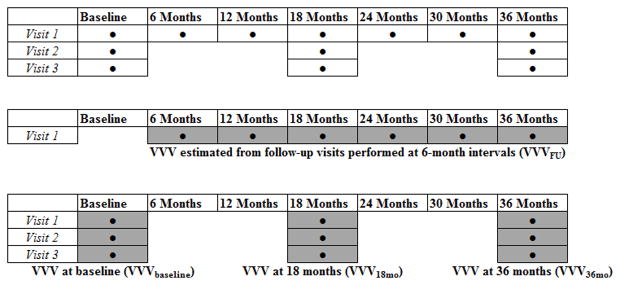
Baseline and follow-up visits at which blood pressure (BP) measurements were obtained in TOHP II, and the estimation of visit-to-visit variability (VVV) in the current study. Upper panel shows when BP measurements (●) were obtained in TOHP II. The grey boxes in the middle panel show the visits used to calculate VVV of BP using follow-up visits performed every 6 months (VVVFU). The grey boxes in the lower panel show the visits used to calculate VVV of BP using visits performed at shorter intervals at baseline (VVVbaseline), 18-months (VVV18mo) and 36-months (VVV36mo).
For primary analyses (middle panel, Figure 1), VVV of BP was expressed as the standard deviation (SD) of BP across the six visits from the 6-month though the 36-month follow-up visit (VVVFU). The pre-randomization BP measurements were not included in this calculation of VVV in order to avoid the variability caused by the initial reduction in BP attributable to the intervention. Also, as duration of time between visits affects VVV of BP and to keep between-visit intervals relatively fixed, we only used BP measurements from the first of the three 18-month and 36-month visits for calculation of VVVFU14. In secondary analyses (lower panel, Figure 1), VVV of BP was expressed as the SD of BP using visits performed at shorter intervals: across the three screening visits (VVVbaseline), the three visits at 18 months (VVV18mo), and the three visits at 36 months (VVV36mo). Other metrics of VVV of BP, such as coefficient of variation and variation independent of the mean, were not included in the analyses as these metrics are highly correlated with SD (r > 0.97) and therefore represent the same domain of VVV of BP15.
Statistical Analysis
Analyses were restricted to participants who had three BP readings at every visit through 36 months (n=1820). Participants excluded from analyses (n=562) were younger, less likely to be married, less likely to be a college graduate, more often current smokers, more likely to consume alcohol, had a higher weight and BMI, and had lower potassium excretion compared to participants included in the current analyses (Supplemental Table 1).
Differences in clinical characteristics were estimated between randomization groups using χ2-tests for categorical variables and analysis of variance (ANOVA) for continuous variables. In order to replicate the original TOHP findings for mean BP13 in this restricted sample, the effect of the interventions on mean BP at each follow-up visit was calculated and differences in the changes were assessed using one-way ANOVA followed by post hoc testing with the Fisher’s least significance test for differences between each intervention group and the usual care group. ANOVA and analysis of covariance (ANCOVA) was used to assess unadjusted and adjusted differences, respectively, in VVVFU of BP between each active intervention group with the usual care group serving as the referent. Initial models included adjustment for age, sex, and race/ethnicity (model 1). Subsequent models included additional adjustment for newly started antihypertensive medication usage during follow-up (model 2) and mean BP at the 18-month visit (model 3), the first visit that BP was measured after the intensive intervention stage for intervention participants. Mean BP at 18 months was chosen as a covariate because of the reduced efficacy of the interventions on mean BP during the transitional phase and the extended stage that was observed in TOPH II13. Our aim in model 3 was to examine the effects of the interventions versus usual care on VVV of BP, independent of significant intervention-related reductions in mean BP, which occurred at 18 months. Next, two-way repeated measures ANOVA and ANCOVA were used to examine the effect of randomization on the change in VVV of BP based on the three baseline, 18-month and 36-month visits (VVVbaseline, VVV18mo, and VVV36mo). Models with progressive adjustment as described above were conducted. All analyses were performed for SBP and DBP, separately. In a sensitivity analysis, to further account for the effect of newly started antihypertensive medication, we repeated primary analyses excluding individuals who started on antihypertensive medication during follow-up (n=256; 14.1% of study sample). In a separate sensitivity analysis, primary analyses were repeated adjusting for mean BP over the follow-up period in model 3 instead of mean BP at 18 months. Finally, in a third sensitivity analysis, VVVFU of BP was calculated over the three visits during the first half of the trial (6 months, 12 months, and 18 months) when the greatest effects on mean BP were observed.
For secondary analyses, the effects of achieved weight loss and sodium reduction over time on VVV of BP were examined, separately, at the within-subject level, using criteria defined previously16,17. Participants were stratified into three groups according to patterns of achieved weight loss: (1) participants with successful maintenance of weight loss were defined as those who lost 4.5 kg or more at 6 months and maintained at least 4.5 kg of weight loss at 36 months; (2) participants who relapsed were those who lost at least 4.5 kg at 6 months but whose weight loss at 36 months was less than 2.5 kg; and (3) participants with no weight loss were defined as those who had weight loss of 2.5 kg or less at 6 and 36 months (referent group). Next, participants were stratified into 4 groups according to their achieved 24-hour sodium excretion levels: (1) maintainers were defined as those who decreased their sodium excretion levels from baseline by at least 50 mmol/24-hour at 18 and 36 months and who had a sodium excretion level of 104 mmol/24-hour or lower at 18 and 36 months; (2) participants who relapsed were defined as those who achieved these criteria at 18 but not 36 months; (3) improvers were considered those who achieved these criteria at 36 months but not at 18 months; and (4) no success was defined as those who did not achieve these criteria at either follow-up period (referent group). For these secondary analyses, an initial model included adjustment for age, sex, race/ethnicity, and randomization to a sodium reduction intervention group (for analysis of weight loss success categories) or randomization to a weight loss intervention group (for analysis of sodium reduction success categories; model 1). Subsequent models included additional adjustment for newly started antihypertensive medication usage, current smoking, and alcohol use (model 2); and mean BP and HR at 18 months (model 3).
P-values <0.05 were considered statistically significant. Analyses were performed using SPSS version 18.0 (SPSS, Chicago, IL).
RESULTS
Participant Characteristics
The study population consisted of 1820 participants with complete BP data, including 1209 males (66%) and 611 females (33%). Mean age was 43.9 ± 6.1 years and mean BMI was 30.8 ± 3.1 kg/m2. Among the study population, 16.9% (n=307) were black, 52.7% (n=960) were college graduates, 8.2% (n=149) were current smokers, and 88.5% (n=1610) were employed full-time. Mean SBP and DBP were 127.5 ± 6.3 mmHg and 86.0 ± 2.0 mmHg, respectively. Of the study population, 87.4% (n=1591) had SBP levels in the prehypertensive range (≥ 120 mmHg). Table 1 shows the characteristics of participants according to randomization assignment. There were no statistically significant differences between the groups.
Table 1.
Participant characteristics by intervention group.
| Variable | Weight Loss (n=456) | Sodium Reduction (n=452) | Combined (n=449) | Usual Care (n=463) | P-Value |
|---|---|---|---|---|---|
| Age (years) | 43.8 ± 6.1 | 44.4 ± 6.0 | 44.0 ± 6.1 | 43.4 ± 6.1 | 0.08 |
| Male (%) | 63.4 | 65.3 | 67.0 | 70.0 | 0.18 |
| Race | 0.51 | ||||
| White (%) | 79.4 | 82.1 | 77.3 | 80.1 | - |
| Black (%) | 16.4 | 15.3 | 19.6 | 16.2 | - |
| Other (%) | 4.2 | 2.7 | 3.1 | 3.7 | - |
| Married (%) | 74.1 | 75.2 | 81.1 | 77.5 | 0.07 |
| Employed full-time (%) | 89.0 | 88.1 | 86.6 | 90.1 | 0.42 |
| College Graduate | 52.6 | 58.2 | 50.3 | 49.9 | 0.05 |
| Current Smoker (%) | 9.0 | 6.6 | 8.7 | 8.4 | 0.57 |
| Alcohol use ≥1 drink/week (%) | 30.0 | 36.9 | 35.2 | 35.2 | 0.15 |
| Antihypertensive Medication (%) | 0.05 | ||||
| Never on Medications | 86.6 | 86.7 | 88.4 | 82.3 | - |
| Newly Started During Follow-Up | 13.4 | 13.3 | 11.6 | 17.7 | - |
| Weight (kg) | 93.8 ± 14.5 | 93.3 ± 14.3 | 93.0 ± 13.8 | 93.4 ± 13.3 | 0.84 |
| BMI (kg/m2) | 31.0 ± 3.2 | 30.7 ± 3.1 | 30.7 ± 3.1 | 30.7 ± 3.0 | 0.44 |
| Waist/Hip Ratio | 0.93 ± 0.09 | 0.92 ± 0.09 | 0.92 ± 0.09 | 0.93 ± 0.09 | 0.72 |
| Systolic BP (mmHg) | 127.5 ± 6.1 | 127.7 ± 6.6 | 127.5 ± 6.5 | 127.4 ± 6.2 | 0.90 |
| Diastolic BP (mmHg) | 86.0 ± 1.9 | 86.0 ± 2.0 | 86.0 ± 1.9 | 85.9 ± 2.0 | 0.56 |
| Pulse Pressure (mmHg) | 41.6 ± 5.9 | 41.6 ± 6.5 | 41.6 ± 6.3 | 41.5 ± 6.1 | 0.99 |
| Heart Rate (beats/min) | 76.9 ± 8.4 | 77.0 ± 9.8 | 76.7 ± 9.5 | 76.7 ± 9.4 | 0.94 |
| Sodium Excretion (mmol/24-h) | 184.3 ± 72.3 | 185.6 ± 77.3 | 178.8 ± 75.1 | 191.0 ± 82.7 | 0.12 |
| Potassium Excretion (mmol/24-h) | 65.7 ± 24.9 | 66.8 ± 27.0 | 63.9 ± 27.3 | 66.3 ± 27.3 | 0.25 |
| Sodium/Potassium Ratio | 3.06 ± 1.41 | 3.04 ± 1.47 | 3.09 ± 1.48 | 3.11 ± 1.27 | 0.36 |
| Vigorous Exercise (Times/week) | 1.8 ± 1.7 | 1.8 ± 1.9 | 1.9 ± 1.9 | 1.8 ± 1.9 | 0.60 |
Data presented as percentages or means ± s.d.
Effect of Interventions on Mean BP
Compared with participants in the usual care group, mean SBP and DBP significantly decreased more in participants assigned to each active intervention group during the follow-up period up to and including the 18-month visit. After this time, almost no significant differences were observed (Supplemental Table 2).
Effect of Interventions on VVV of BP
There were no significant differences in VVVFU of SBP or DBP for participants in any of the active intervention groups compared to participants in the usual care group in unadjusted or adjusted models (Table 2). When VVV of BP was quantified using visits performed at shorter intervals at baseline (VVVbaseline), 18 months (VVV18mo), and 36 months (VVV36mo), VVV of SBP and DBP were not significantly different between any of the groups in unadjusted and fully adjusted models (Table 3).
Table 2.
Effect of interventions on visit-to-visit variability* of systolic and diastolic blood pressure calculated across follow-up period (VVVFU).
| Variable | Weight Loss (n=456) | Sodium Reduction (n=452) | Combined (n=449) | Usual Care (n=463) | P-Value
|
||
|---|---|---|---|---|---|---|---|
| P1 | P2 | P3 | |||||
| VVV of SBP (mmHg) | 7.2 ± 3.1 | 7.1 ± 3.0 | 6.9 ± 2.9 | 6.9 ± 2.9 | - | - | - |
| Unadjusted | 0.3 ± 0.2 | 0.2 ± 0.2 | 0.0 ± 0.2 | 0 (ref) | 0.12 | 0.29 | 0.87 |
| Model 1† | 0.2 ± 0.2 | 0.1 ± 0.2 | 0.0 ± 0.2 | 0 (ref) | 0.29 | 0.62 | 0.81 |
| Model 2‡ | 0.3 ± 0.2 | 0.2 ± 0.2 | 0.1 ± 0.2 | 0 (ref) | 0.10 | 0.29 | 0.62 |
| Model 3₴ | 0.4 ± 0.2 | 0.3 ± 0.2 | 0.2 ± 0.2 | 0 (ref) | 0.05 | 0.13 | 0.38 |
| VVV of DBP (mmHg) | 5.4 ± 2.2 | 5.5 ± 2.3 | 5.3 ± 2.1 | 5.5 ± 2.2 | - | - | - |
| Unadjusted | −0.1 ± 0.1 | −0.1 ± 0.1 | −0.2 ± 0.1 | 0 (ref) | 0.41 | 0.62 | 0.13 |
| Model 1† | −0.1 ± 0.1 | −0.1 ± 0.1 | −0.2 ± 0.1 | 0 (ref) | 0.36 | 0.64 | 0.09 |
| Model 2‡ | −0.1 ± 0.1 | 0.0 ± 0.1 | −0.1 ± 0.1 | 0 (ref) | 0.72 | 0.92 | 0.34 |
| Model 3₴ | 0.0 ± 0.1 | 0.0 ± 0.1 | −0.1 ± 0.1 | 0 (ref) | 0.75 | 0.89 | 0.36 |
Data presented as mean ± s.d. or unadjusted/adjusted mean difference compared to usual care group ± s.e.
P1=Weight Loss vs. Usual Care; P2=Sodium Reduction vs. Usual Care; P3=Combined vs. Usual Care.
Defined as standard deviation of blood pressure derived from readings at the 6-month visit, 12-month visit, 1st visit during the 18-month period, 24-month visit, 30-month visit, and 1st visit during the 36-month period.
Model 1 adjusts for age, sex, and race/ethnicity
Model 2 adjusts for covariates in Model 1 + antihypertensive medication usage
Model 3 adjusts for covariates in Model 2 + mean blood pressure at 18 months
Table 3.
Visit-to-visit variability* of systolic and diastolic blood pressure at baseline (VVVbaseline), 18 months (VVV18mo), and 36 months (VVV36mo) by intervention group.
| Variable | Weight Loss (n=456) | Sodium Reduction (n=452) | Combined (n=449) | Usual Care (n=463) | P-Value (Repeated Measures) Time (baseline, 18 mo, 36 mo) × Group |
|---|---|---|---|---|---|
| Systolic BP (mmHg) | |||||
| VVVbaseline | 5.6 ± 3.2 | 5.7 ± 3.3 | 5.5 ± 3.1 | 5.6 ± 3.0 | |
| VVV18mo | 5.5 ± 3.2 | 5.4 ± 3.1 | 5.2 ± 2.9 | 5.4 ± 3.2 | |
| Δ Unadjusted | 0.1 ± 0.3 | −0.1 ± 0.3 | −0.1 ± 0.3 | 0 (ref) | |
| Δ Model 1† | 0.1 ± 0.3 | −0.1 ± 0.3 | −0.1 ± 0.3 | 0 (ref) | |
| Δ Model 2‡ | 0.1 ± 0.3 | −0.1 ± 0.3 | −0.1 ± 0.3 | 0 (ref) | |
| Δ Model 3₴ | 0.1 ± 0.3 | −0.1 ± 0.3 | −0.1 ± 0.3 | 0 (ref) | |
| VVV36mo | 5.5 ± 3.7 | 5.5 ± 3.2 | 5.3 ± 3.3 | 5.1 ± 2.9 | |
| Δ Unadjusted | 0.4 ± 0.3 | 0.3 ± 0.3 | 0.3 ± 0.3 | 0 (ref) | 0.64 |
| Δ Model 1† | 0.4 ± 0.3 | 0.3 ± 0.3 | 0.3 ± 0.3 | 0 (ref) | 0.70 |
| Δ Model 2‡ | 0.4 ± 0.3 | 0.3 ± 0.3 | 0.3 ± 0.3 | 0 (ref) | 0.66 |
| Δ Model 3₴ | 0.4 ± 0.3 | 0.3 ± 0.3 | 0.3 ± 0.3 | 0 (ref) | 0.67 |
| Diastolic BP (mmHg) | |||||
| VVVbaseline | 3.7 ± 2.2 | 3.8 ± 2.2 | 3.7 ± 2.1 | 3.9 ± 2.3 | |
| VVV18mo | 4.3 ± 2.6 | 4.3 ± 2.3 | 4.2 ± 2.5 | 4.2 ± 2.4 | |
| Δ Unadjusted | 0.2 ± 0.2 | 0.1 ± 0.2 | 0.1 ± 0.2 | 0 (ref) | |
| Δ Model 1† | 0.2 ± 0.2 | 0.1 ± 0.2 | 0.1 ± 0.2 | 0 (ref) | |
| Δ Model 2‡ | 0.2 ± 0.2 | 0.1 ± 0.2 | 0.1 ± 0.2 | 0 (ref) | |
| Δ Model 3₴ | 0.2 ± 0.2 | 0.1 ± 0.2 | 0.1 ± 0.2 | 0 (ref) | |
| VVV36mo | 4.3 ± 2.5 | 4.0 ± 2.4 | 4.3 ± 2.5 | 4.2 ± 2.5 | |
| Δ Unadjusted | 0.3 ± 0.2 | −0.1 ± 0.2 | 0.2 ± 0.2 | 0 (ref) | 0.39 |
| Δ Model 1† | 0.3 ± 0.2 | −0.1 ± 0.2 | 0.2 ± 0.2 | 0 (ref) | 0.44 |
| Δ Model 2‡ | 0.3 ± 0.2 | −0.1 ± 0.2 | 0.2 ± 0.2 | 0 (ref) | 0.42 |
| Δ Model 3₴ | 0.3 ± 0.2 | −0.1 ± 0.2 | 0.2 ± 0.2 | 0 (ref) | 0.45 |
Data presented as mean ± s.d. or unadjusted/adjusted difference in the within-subject change in each intervention group vs. change in the usual care group ± s.e.
Defined as standard deviation of blood pressure, which was derived using blood pressure readings over three visits at shorter intervals at three separate time periods (VVVbaseline, VVV18mo, and VVV36mo).
Model 1 adjusts for age, sex, and race/ethnicity
Model 2 adjusts for covariates in Model 1 + antihypertensive medication usage
Model 3 adjusts for covariates in Model 2 + mean blood pressure at 18 months
In sensitivity analyses, all results for either metric of VVV of BP were similar after excluding participants who newly started antihypertensive medication during follow-up, and separately after adjusting for mean BP over follow-up in model 3 instead of 18-month BP (results not shown). Results were also similar when VVVFU of BP was quantified over the three visits from 6 months to 18 months (results not shown).
Effects of Achieved Weight Loss on VVV
The online Supplement describes the changes in weight in achieved weight loss groups (Supplemental Figure 1). For the successful weight loss maintenance group, VVVFU of SBP and DBP were both significantly lower when compared to the no weight loss group in unadjusted models (Table 4). However, these differences were no longer significant in adjusted models. In contrast, in unadjusted and adjusted models, the relapse group had significantly higher VVVFU of SBP and DBP when compared to the no weight loss group. In an exploratory analysis, the association between VVVFU in body weight (defined as the SD in body weight across follow-up visits) and VVVFU of BP was then examined among the entire study sample. After adjustment for age, sex, race/ethnicity, randomization assignment, newly started antihypertensive medication usage, current smoking, alcohol use, mean BP at 18 months, mean HR at 18 months, and mean body weight over follow-up, each 1 kg higher VVVFU in body weight was associated with a 0.13 ± 0.02 mm Hg higher VVVFU of SBP (p < 0.001) and 0.07 ± 0.01 mm Hg higher VVVFU of DBP (p<0.001).
Table 4.
Visit-to-visit variability* of systolic and diastolic blood pressure calculated across the follow-up period (VVVFU) by achieved weight loss success category.
| Variable | Successful Maintenance (n = 153) | Relapse (n = 263) | No Loss (n = 919) | P-Value
|
|
|---|---|---|---|---|---|
| P1 | P2 | ||||
| VVVFU of SBP (mmHg) | 6.4 ± 2.3 | 7.5 ± 3.0 | 6.9 ± 3.0 | - | - |
| Unadjusted | −0.6 ± 0.3 | 0.5 ± 0.2 | 0 (ref) | 0.02 | 0.008 |
| Model 1† | −0.4 ± 0.3 | 0.6 ± 0.2 | 0 (ref) | 0.11 | 0.002 |
| Model 2‡ | −0.1 ± 0.2 | 0.8 ± 0.2 | 0 (ref) | 0.57 | < 0.001 |
| Model 3₴ | 0.0 ± 0.2 | 0.8 ± 0.2 | 0 (ref) | 0.93 | < 0.001 |
| VVVFU of DBP (mmHg) | 4.9 ± 1.9 | 5.7 ± 2.1 | 5.4 ± 2.2 | - | - |
| Unadjusted | −0.5 ± 0.2 | 0.3 ± 0.2 | 0 (ref) | 0.005 | 0.04 |
| Model 1† | −0.4 ± 0.2 | 0.4 ± 0.2 | 0 (ref) | 0.03 | 0.007 |
| Model 2‡ | −0.2 ± 0.2 | 0.5 ± 0.1 | 0 (ref) | 0.20 | < 0.001 |
| Model 3₴ | −0.2 ± 0.2 | 0.6 ± 0.2 | 0 (ref) | 0.26 | < 0.001 |
Data are presented as mean ± s.d. or unadjusted/adjusted mean difference compared to the no loss group ± s.e
Participants with successful maintenance of weight loss were defined as those who lost 4.5 kg or more at 6 months and maintained at least 4.5 kg of weight loss at 36 months. Participants with relapse were those who lost at least 4.5 kg at 6 months but whose weight loss at 36 months was less than 2.5 kg. Participants with no weight loss had weight loss of 2.5 kg or less at 6 and 36 months (referent group). Participants with incomplete body weight data over follow-up (n = 11) or who did not meet the criteria for any of the achieved weight loss success categories (n = 474) were excluded from analysis.
P1 = Successful Maintenance vs. No Loss; P2 = Relapse vs. No Loss.
Defined as standard deviation of blood pressure, which was derived from blood pressure readings from the 6-month visit, 12-month visit, 1st visit during the 18-month period, 24-month visit, 30-month visit, and 1st visit during the 36-month period.
Model 1 adjusts for age, sex, race/ethnicity, and randomization to a sodium reduction group
Model 2 adjusts for covariates in Model 1 + antihypertensive medication usage, current smoking, alcohol use
Model 3 adjusts for covariates in Model 2 + mean blood pressure and heart rate at 18 months
When VVV of BP was quantified at baseline (VVVbaseline), 18 months (VVV18mo), and 36 months (VVV36mo), VVV of SBP did not significantly differ over time between any of the groups (time × group interaction) in unadjusted and fully adjusted models (Supplemental Table 4). In an unadjusted model, VVV of DBP did significantly differ over time between the groups (time × group interaction). VVV of DBP progressively increased in both the relapse and no weight loss groups from baseline to the 18- and 36-month follow-up periods, while it initially increased from baseline at the 18-month follow-up period and subsequently decreased at the 36-month follow-up period in the successful maintenance group.
Effects of Achieved Sodium Reduction on VVV
The online Supplement describes the changes in 24-hour sodium excretion in achieved sodium reduction groups (Supplemental Figure 2). In unadjusted or adjusted models, there were no significant differences in VVVFU of SBP for the maintainers, improvers, and relapsers compared to the no success group (Supplemental Table 4). VVVFU of DBP was significantly higher in the improvers compared to the no success group. However, this difference was no longer significant in a fully adjusted model. There were no differences in VVVFU of DBP in unadjusted and fully adjusted models for the maintainers or relapsers compared to the no success group. In an exploratory analysis, there were no significant associations of VVVFU of sodium excretion (defined as SD across follow-up visits) with either VVVFU of SBP or VVVFU of DBP (results not shown).
When VVV of BP was quantified at baseline (VVVbaseline), 18 months (VVV18mo), and 36 months (VVV36mo), VVV of SBP and DBP did not significantly differ over time between any of the groups (time × group interaction) in unadjusted and fully adjusted models (Supplemental Table 5).
DISCUSSION
In this analysis of overweight adults with high-normal DBP enrolled in TOHP II, we report on the effects of lifestyle interventions on VVV of BP and show that there were no differences in VVV of BP over a 36-month follow-up period between individuals randomized to a weight loss, sodium reduction, or combined intervention group compared to a usual care group despite intervention-related reductions in mean BP. These findings were observed even after excluding participants who newly started antihypertensive medication during follow-up. Furthermore, in secondary analyses, VVV of BP in individuals who successfully maintained their weight loss or sodium reduction for the duration of the intervention period was similar to that of individuals who did not lose weight or reduce their sodium intake. Overall, these findings provide evidence that weight loss and sodium reduction, alone or in combination, may not be effective interventions for reducing VVV of BP in overweight adults with high-normal DBP.
Recently, analyses of several clinical trials have highlighted the potential importance of lowering VVV of BP4,6,18. In the ASCOT-BPLA trial, it was found that the lower stroke and coronary event rates in an amlodipine-based treatment group compared with an atenolol-based treatment group could be explained by reductions in VVV of BP4,6. Furthermore, in the Medical Research Council (MRC) trial, it was found that risk of stroke in the atenolol treatment group followed the same time course as changes in VVV of BP6. In a meta-analysis of 389 clinical trials whereby inter-individual variance of BP was used as a surrogate for VVV of BP, it was found that the effects of treatment on inter-individual variance in BP accounted for more of the effects of treatment on stroke risk than did mean BP18. Taken together, these studies suggest that some of the benefits of pharmacologic BP-lowering may be mediated, in part, by their effects on VVV of BP, leading some to suggest that VVV of BP should be targeted in intervention studies19. Current guidelines recommend that lifestyle modifications should be adopted for the treatment of prehypertension and in conjunction with drug therapy for stage 1 and 2 hypertension. Therefore, an understanding of the effects that lifestyle modifications have on VVV of BP in addition to their effects on mean BP is warranted.
Lifestyle modifications have been demonstrated to reduce mean BP, prevent or delay the incidence of hypertension, enhance antihypertensive drug efficacy, and decrease cardiovascular risk20. Although the present study findings do not support a role of lifestyle modification in reducing VVV of BP, these findings do not detract from the importance of healthy lifestyle promotion for BP management. Similar to the effects of each active intervention on mean BP reported in the full TOHP II study sample13, we report that the interventions were successful in the short-term at reducing mean BP with within-arm reductions in SBP and DBP of 5.6–6.9 mmHg and 4.5–6.0 mmHg at 6-months follow-up, respectively. The effect sizes were similar to that of within-arm reductions reported after 6-months in non-hypertensives enrolled in other lifestyle modification trials including the PREMIER trial (SBP/DBP reductions: 5–9/3–5 mmHg), the Hypertension Prevention Trial (SBP/DBP reductions: 3–6/3-–5 mmHg), and phase I of TOHP (SBP/DBP reductions: 5–6/5–6 mmHg)21–24.
In previous studies, the effectiveness of lifestyle interventions for BP reduction declined over time21–23. These findings highlight a limitation of lifestyle interventions in that the efficacy of weight loss and sodium reduction is attenuated with time25, 26. In the TOPH II study, the difference in BP between groups was greatest at the end of the active intervention phase, and the between group difference narrowed after continued follow-up. It is thus plausible that the lack of effect of weight loss and sodium reduction on VVV of BP could be attributed to the reduced efficacy of lifestyle interventions over time. However, there were several findings from our study that do not support this hypothesis. First, no differences were found between the intervention groups and the usual care group when VVVFU was estimated using visits from the first half of the trial (6 months, 12 months and 18 months) when the largest effects of the interventions on mean BP were observed. Similarly, there were no differences between the groups at 18 months when VVV of BP was expressed as the SD of BP during each follow-up period (VVVbaseline, VVV18mo, and VVV36mo). Finally, no differences were found between individuals who successfully met intervention goals for weight loss and sodium reduction compared to individuals who did not, suggesting that lifestyle interventions did not affect VVV of BP even in the individuals who achieved the greatest lifestyle changes.
An interesting finding from our within-subject analyses was that participants who lost weight initially and then subsequently regained weight (i.e. relapsers) had significantly higher VVV of BP over the follow-up period (VVVFU) compared to those who did not lose weight. This phenomenon of weight loss followed by weight gain, commonly referred to as weight cycling, has been implicated with many deleterious outcomes including cardiovascular mortality27–29. It has been proposed that the enhanced cardiovascular risk with weight cycling is, in part, the result of fluctuations in certain risk parameters, including BP30. Here we showed that VVV of BP was higher in individuals who went through a period of weight loss and weight regain that is akin to a single weight cycle. We also found that the VVVFU in body weight was significantly associated with VVVFU of SBP and DBP among the entire study sample. Taken together, these findings suggest that body weight fluctuations may, in part, contribute to VVV of BP. However, these results should be interpreted with caution. First, these results were exploratory analyses and were not based on intention-to-treat. Second, the magnitude of the difference in VVVFU of BP between the relapse and no loss groups was modest (SBP: 0.8 ± 0.2 mmHg; DBP: 0.6 ± 0.2 mmHg). Finally, VVV of BP did not significantly differ over time between any of the achieved weight loss groups in a fully adjusted model when VVV of BP was quantified using visits at shorter intervals at baseline, 18 months, and 36 months.
Several limitations must be noted when interpreting our findings. First, as the study population consisted of relatively young, non-hypertensive participants without substantial medical co-morbidities, our findings may not be generalizable to older populations with cardiovascular risk factors or prevalent cardiovascular disease. However, some evidence suggests that the association between VVV of BP and risk of cardiovascular events is stronger in younger individuals with BP levels in the normal range4,5, although not all studies have shown this association31. Thus, the results of the present study may be generalizable to individuals in whom the strongest associations between VVV of BP and cardiovascular risk have been observed. Second, as the study population was restricted to individuals with high-normal DBP, our findings may not be generalizable to individuals with high-normal SBP levels. However, a large proportion of the study population had baseline SBP levels in the prehypertensive range. Third, our study was a secondary analysis of TOHP II, restricted to participants with complete BP data. Therefore, there may have been selection bias in our analyses, which led to lack of an effect of the behavioral interventions on VVV of BP. However, a balance in sociodemographic and clinical characteristics remained present across randomization groups and the effects of the interventions on mean BP in our study are similar to those reported in the main study. Finally, BP measurements were obtained using a random zero sphygmomanometer, a device that some studies have suggested may underestimate BP levels32. However, the randomized controlled design of our study ensured that any measurement error in BP was not isolated to a single study group. Moreover, the effects of the interventions on mean BP in our study are highly consistent with prior studies, demonstrating the internal validity of our findings.
To our knowledge, this is one of the first studies to examine the effects of weight loss and sodium reduction on VVV of BP. Other major strengths of the study are the randomized controlled design of TOHP II, a large sample size for a lifestyle modification trial (one of the largest ever conducted), long-term follow-up, measurement of 24-hour urinary sodium excretion levels, and the availability of evenly spaced visits for the estimation of VVV of BP over the 36-month follow-up period and during three distinct time periods (baseline, 18-months, 36-months) for repeated measures of VVV of BP. Finally, although TOHP II was conducted nearly 20 years ago prior to widespread antihypertensive medication use, analysis of TOHP II data allowed us to uniquely evaluate the effects of weight loss and sodium reduction on VVV of BP, independent of medication use, in the context of a large randomized controlled trial of lifestyle interventions which remain clinically relevant today for individuals with borderline-elevated BP.
In conclusion, our results show that weight loss and sodium reduction, alone or in combination, did not reduce VVV of BP in overweight adults with high-normal DBP. These findings suggest that the cardiovascular benefits conferred by weight loss and sodium reduction may be tied to reductions in mean BP or other non-BP effects, and not to VVV of BP. Future studies should confirm our findings in higher risk populations including older adults, patients with hypertension, and those with multiple comorbidities. Studies should also determine whether interventions that reduce VVV of BP lead to a reduction in subsequent cardiovascular events. Finally, investigations may also be needed to elucidate the mechanisms underlying VVV of BP in order to provide direction for the development of targeted therapies for reducing VVV of BP. Although exploratory in nature, the results of our study suggest that fluctuations in body weight may be a physiologic mechanism contributing to VVV of BP. Further research is warranted to confirm these findings.
Supplementary Material
Acknowledgments
Funding: None
This manuscript was prepared using TOHP research materials obtained from the National Heart, Lung, and Blood Institute (NHLBI) Biologic Specimen and Data Repository Information Coordinating Center and does not necessarily reflect the opinions or views of the TOHP or the NHLBI.
Footnotes
Disclosures: None
References
- 1.Grove JS, Reed DM, Yano K, Hwang LJ. Variability in systolic blood pressure-a risk factor for coronary heart disease? Am J Epidemiol. 1997;145:771–6. doi: 10.1093/oxfordjournals.aje.a009169. [DOI] [PubMed] [Google Scholar]
- 2.Hsieh YT, Tu ST, Cho TJ, Chang SJ, Chen JF, Hsieh MC. Visit-to-visit variability in blood pressure strongly predicts all-cause mortality in patients with type 2 diabetes: a 5.5-year prospective analysis. Eur J Clin Invest. 2012;42:245–53. doi: 10.1111/j.1365-2362.2011.02574.x. [DOI] [PubMed] [Google Scholar]
- 3.Muntner P, Shimbo D, Tonelli M, Reynolds K, Arnett DK, Oparil S. The relationship between visit-to-visit variability in systolic blood pressure and all-cause mortality in the general population: findings from NHANES III, 1988 to 1994. Hypertension. 2011;57:160–6. doi: 10.1161/HYPERTENSIONAHA.110.162255. [DOI] [PubMed] [Google Scholar]
- 4.Rothwell PM, Howard SC, Dolan E, O’Brien E, Dobson JE, Dahlof B, Sever PS, Poulter NR. Prognostic significance of visit-to-visit variability, maximum systolic blood pressure, and episodic hypertension. Lancet. 2010;375:895–905. doi: 10.1016/S0140-6736(10)60308-X. [DOI] [PubMed] [Google Scholar]
- 5.Shimbo D, Newman JD, Aragaki AK, LaMonte MJ, Bavry AA, Allison M, Manson JE, Wassertheil-Smoller S. Association between annual visit-to-visit blood pressure variability and stroke in postmenopausal women: data from the Women’s Health Initiative. Hypertension. 2012;60:625–30. doi: 10.1161/HYPERTENSIONAHA.112.193094. [DOI] [PMC free article] [PubMed] [Google Scholar]
- 6.Rothwell PM, Howard SC, Dolan E, O’Brien E, Dobson JE, Dahlof B, Poulter NR, Sever PS. Effects of beta blockers and calcium-channel blockers on within-individual variability in blood pressure and risk of stroke. Lancet Neurol. 2010;9:469–80. doi: 10.1016/S1474-4422(10)70066-1. [DOI] [PubMed] [Google Scholar]
- 7.Chobanian AV, Bakris GL, Black HR, Cushman WC, Green LA, Izzo JL, Jr, Jones DW, Materson BJ, Oparil S, Wright JT, Jr, Roccella EJ. Seventh report of the Joint National Committee on Prevention, Detection, Evaluation, and Treatment of High Blood Pressure. Hypertension. 2003;42:1206–52. doi: 10.1161/01.HYP.0000107251.49515.c2. [DOI] [PubMed] [Google Scholar]
- 8.He FJ, MacGregor GA. Effect of modest salt reduction on blood pressure: a meta-analysis of randomized trials. Implications for public health. J Hum Hypertens. 2002;16:761–70. doi: 10.1038/sj.jhh.1001459. [DOI] [PubMed] [Google Scholar]
- 9.Neter JE, Stam BE, Kok FJ, Grobbee DE, Geleijnse JM. Influence of weight reduction on blood pressure: a meta-analysis of randomized controlled trials. Hypertension. 2003;42:878–84. doi: 10.1161/01.HYP.0000094221.86888.AE. [DOI] [PubMed] [Google Scholar]
- 10.Hebert PR, Bolt RJ, Borhani NO, Cook NR, Cohen JD, Cutler JA, Hollis JF, Kuller LH, Lasser NL, Oberman A, Miller ST, Morris C, Whelton PK, Hennekens CH. Design of a multicenter trial to evaluate long-term life-style intervention in adults with high-normal blood pressure levels. Trials of Hypertension Prevention (phase II) Ann Epidemiol. 1995;5:130–9. doi: 10.1016/1047-2797(94)00057-z. [DOI] [PubMed] [Google Scholar]
- 11.Hollis JF, Satterfield S, Smith F, Fouad M, Allender PS, Borhani N, Charleston J, Hirlinger M, King N, Schultz R, Goodwin-Sousoulas B. Recruitment for phase II of the Trials of Hypertension Prevention. Effective strategies and predictors of randomization. Ann Epidemiol. 1995;5:140–8. doi: 10.1016/1047-2797(94)00058-2. [DOI] [PubMed] [Google Scholar]
- 12.Lasser VI, Raczynski JM, Stevens VJ, Mattfeldt-Beman MK, Kumanyika S, Evans M, Danielson E, Dalcin A, Batey DM, Belden LK, Brewer AA. Trials of Hypertension Prevention, phase II. Structure and content of the weight loss and dietary sodium reduction interventions. Ann Epidemiol. 1995;5:156–64. doi: 10.1016/1047-2797(94)00060-7. [DOI] [PubMed] [Google Scholar]
- 13.The Trials of Hypertension Prevention Collaborative Research Group. Effects of weight loss and sodium reduction intervention on blood pressure and hypertension incidence in overweight people with high-normal blood pressure. The Trials of Hypertension Prevention, phase II. Arch Intern Med. 1997;157:657–67. [PubMed] [Google Scholar]
- 14.Levitan EB, Kaciroti N, Oparil S, Julius S, Muntner P. Blood Pressure Measurement Device, Number and Timing of Visits, and Intra-Individual Visit-to-Visit Variability of Blood Pressure. J Clin Hypertens. 2012;14:744–50. doi: 10.1111/jch.12005. [DOI] [PMC free article] [PubMed] [Google Scholar]
- 15.Levitan EB, Kaciroti N, Oparil S, Julius S, Muntner P. Relationships between metrics of visit-to-visit variability of blood pressure. J Hum Hypertens. 2013 doi: 10.1038/jhh.2013.19. [DOI] [PubMed] [Google Scholar]
- 16.Cook NR, Kumanyika SK, Cutler JA, Whelton PK Trials of Hypertension Prevention Collaborative Research Group. Dose-response of sodium excretion and blood pressure change among overweight, nonhypertensive adults in a 3-year dietary intervention study. J Hum Hypertens. 2005;19:47–54. doi: 10.1038/sj.jhh.1001775. [DOI] [PubMed] [Google Scholar]
- 17.Stevens VJ, Obarzanek E, Cook NR, Lee IM, Appel LJ, Smith West D, Milas NC, Mattfeldt-Beman M, Belden L, Bragg C, Millstone M, Raczynski J, Brewer A, Singh B, Cohen J Trials of Hypertension Prevention Collaborative Research Group. Long-term weight loss and changes in blood pressure: results of the Trials of Hypertension Prevention, phase II. Ann Intern Med. 2001;134:1–11. doi: 10.7326/0003-4819-134-1-200101020-00007. [DOI] [PubMed] [Google Scholar]
- 18.Webb AJ, Fischer U, Mehta Z, Rothwell PM. Effects of antihypertensive-drug class on interindividual variation in blood pressure and risk of stroke: a systematic review and meta-analysis. Lancet. 2010;375:906–15. doi: 10.1016/S0140-6736(10)60235-8. [DOI] [PubMed] [Google Scholar]
- 19.Dolan E, O’Brien E. Blood pressure variability: clarity for clinical practice. Hypertension. 2010;56:179–81. doi: 10.1161/HYPERTENSIONAHA.110.154708. [DOI] [PubMed] [Google Scholar]
- 20.Brill JB. Lifestyle intervention strategies for the prevention and treatment of hypertension: a review. Am J Lifestyle Med. 2011;5:346–60. [Google Scholar]
- 21.The Hypertension Prevention Trial: three-year effects of dietary changes on blood pressure. Hypertension Prevention Trial Research Group. Arch Intern Med. 1990;150:153–62. [PubMed] [Google Scholar]
- 22.Appel LJ, Champagne CM, Harsha DW, Cooper LS, Obarzanek E, Elmer PJ, Stevens VJ, Vollmer WM, Lin PH, Svetkey LP, Stedman SW, Young DR. Effects of comprehensive lifestyle modification on blood pressure control: main results of the PREMIER clinical trial. JAMA. 2003;289:2083–93. doi: 10.1001/jama.289.16.2083. [DOI] [PubMed] [Google Scholar]
- 23.Whelton PK, Kumanyika SK, Cook NR, Cutler JA, Borhani NO, Hennekens CH, Kuller LH, Langford H, Jones DW, Satterfield S, Lasser NL, Cohen JD. Efficacy of nonpharmacologic interventions in adults with high-normal blood pressure: results from phase 1 of the Trials of Hypertension Prevention. Am J Clin Nutr. 1997;65:652S–60S. doi: 10.1093/ajcn/65.2.652S. [DOI] [PubMed] [Google Scholar]
- 24.Stevens VJ, Corrigan SA, Obarzanek E, Bernauer E, Cook NR, Hebert P, Mattfeldt-Beman M, Oberman A, Sugars C, Dalcin AT, Whelton PK. Weight Loss Intervention in Phase 1 of the Trials of Hypertension Prevention. Arch Intern Med. 1993;153:849–858. [PubMed] [Google Scholar]
- 25.Kumanyika SK, Bowen D, Rolls BJ, Van Horn L, Perri MG, Czajkowski SM, Schron E. Maintenance of dietary behavior change. Health Psych. 2000;19:42–56. doi: 10.1037/0278-6133.19.suppl1.42. [DOI] [PubMed] [Google Scholar]
- 26.Wu T, Gao X, Chen M, Van Dam RM. Long-term effectiveness of diet-plus-exercise interventions vs. diet-only interventions for weight loss: a meta-analysis. Obes Rev. 2009;10:313–323. doi: 10.1111/j.1467-789X.2008.00547.x. [DOI] [PubMed] [Google Scholar]
- 27.Diaz VA, Mainous AG, 3rd, Everett CJ. The association between weight fluctuation and mortality: results from a population-based cohort study. J Community Health. 2005;30:153–65. doi: 10.1007/s10900-004-1955-1. [DOI] [PubMed] [Google Scholar]
- 28.Hamm P, Shekelle RB, Stamler J. Large fluctuations in body weight during young adulthood and twenty-five-year risk of coronary death in men. Am J Epidemiol. 1989;129:312–8. doi: 10.1093/oxfordjournals.aje.a115135. [DOI] [PubMed] [Google Scholar]
- 29.Peters ET, Seidell JC, Menotti A, Arayanis C, Dontas A, Fidanza F, Karvonen M, Nedeljkovic S, Nissinen A, Buzina R. Changes in body weight in relation to mortality in 6441 European middle-aged men: the Seven Countries Study. Int J Obes. 1995;19:862–8. [PubMed] [Google Scholar]
- 30.Montani JP, Viecelli AK, Prevot A, Dulloo AG. Weight cycling during growth and beyond as a risk factor for later cardiovascular diseases: the ‘repeated overshoot’ theory. Int J Obes. 2006;30:S58–66. doi: 10.1038/sj.ijo.0803520. [DOI] [PubMed] [Google Scholar]
- 31.Mancia G, Facchetti R, Parati G, Zanchetti A. Visit-to-Visit Blood Pressure Variability, Carotid Atherosclerosis, and Cardiovascular Events in the European Lacidipine Study on Atherosclerosis. Circulation. 2012;126:569–78. doi: 10.1161/CIRCULATIONAHA.112.107565. [DOI] [PubMed] [Google Scholar]
- 32.O’Brien E, Mee F, Atkins N, O’Malley K. Inaccuracy of the Hawksley random zero sphygmomanometer. Lancet. 1990;336:1465–8. doi: 10.1016/0140-6736(90)93177-q. [DOI] [PubMed] [Google Scholar]
Associated Data
This section collects any data citations, data availability statements, or supplementary materials included in this article.