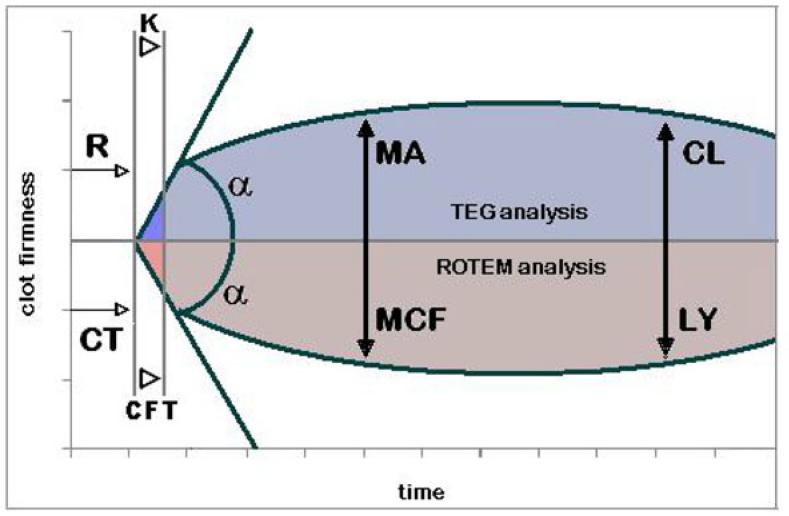
Figure 2. Typical tracings of viscoelastic coagulation devices.
A, upper side: Thrombelastograph (TEG®) tracing: r = reaction time; K = kinetics; α = slope between r and k; MA = maximum amplitude; CL = clot lysis. B, lower side: Rotation Thrombelastography (RoTEM®) tracing: CT = clotting time; CFT = clot formation time; α = slope of tangent at 2 mm amplitude; MCF = maximal clot firmness; LY = Lysis. Figure modified from [105].

