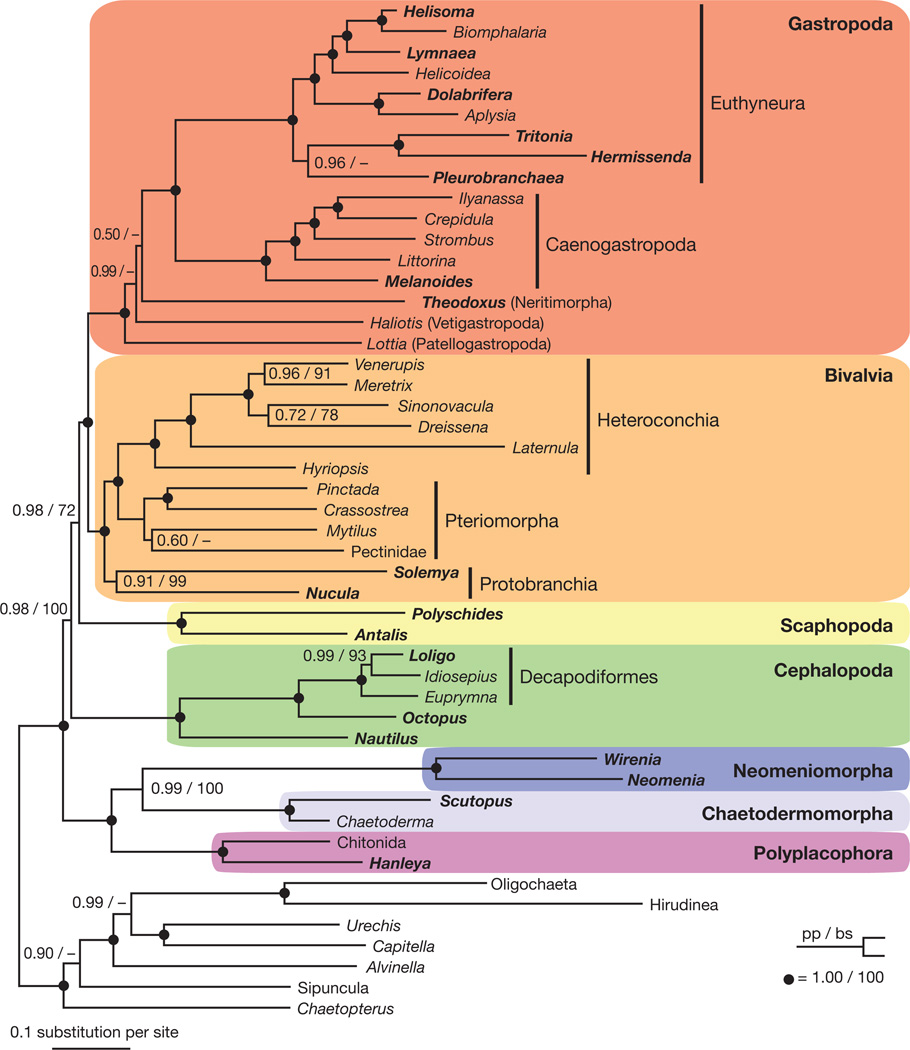
Figure 2. Relationships among major lineages of Mollusca based on 308 genes.
Bayesian inference topology shown with ML bootstrap support values (bs) >50 and posterior probabilities (pp) >0.50 are listed at each node. Filled circles represent nodes with bs = 100 and pp = 1.00. Taxa from which new data were collected are shown in bold.

