

Determining the secondary structure of RNA is a challenging and incompletely solved problem. Using a three-reagent SHAPE experiment to detect local nucleotide flexibility and noncanonical interactions, it is possible to model structurally complex RNAs, including those previously shown to be especially difficult to model, with accuracies consistently exceeding recovery of 90% of canonical base pairs.
Keywords: accuracy, pseudoknot, sensitivity, thermodynamics
Abstract
RNA secondary structure modeling is a challenging problem, and recent successes have raised the standards for accuracy, consistency, and tractability. Large increases in accuracy have been achieved by including data on reactivity toward chemical probes: Incorporation of 1M7 SHAPE reactivity data into an mfold-class algorithm results in median accuracies for base pair prediction that exceed 90%. However, a few RNA structures are modeled with significantly lower accuracy. Here, we show that incorporating differential reactivities from the NMIA and 1M6 reagents—which detect noncanonical and tertiary interactions—into prediction algorithms results in highly accurate secondary structure models for RNAs that were previously shown to be difficult to model. For these RNAs, 93% of accepted canonical base pairs were recovered in SHAPE-directed models. Discrepancies between accepted and modeled structures were small and appear to reflect genuine structural differences. Three-reagent SHAPE-directed modeling scales concisely to structurally complex RNAs to resolve the in-solution secondary structure analysis problem for many classes of RNA.
INTRODUCTION
RNA is a central information carrier in biology (Sharp 2009). Information is encoded in RNA at two distinct levels: in its primary sequence and in its ability to fold into higher order structures (Leontis et al. 2006; Dethoff et al. 2012). The most fundamental level of higher order structure is the pattern of base-pairing or secondary structure. Defining the secondary structure of an RNA is also a critical first step in tertiary structure modeling (Hajdin et al. 2010; Weeks 2010; Bailor et al. 2011). The structures of RNA molecules modulate the numerous functions of RNA and the interactions of RNAs with proteins, small molecules, and other RNAs in splicing, translation, and other regulatory machineries (Mauger et al. 2013).
Accurate, de novo modeling of RNA secondary structure is challenging: In the absence of experimental restraints, current algorithms predict base-pairing patterns that contain, on average, 50%–70% of the canonical (G-C, A-U, and G-U) pairs in secondary structures established through phylogenetic analysis or high-resolution experimental methods (Mathews et al. 2004; Hajdin et al. 2013). The modeling challenge results from the fact that there are only four RNA nucleotides; and these nucleotides have the potential to arrange into many, often energetically similar, RNA secondary structures, although many RNAs adopt a few or only single structures (Tinoco and Bustamante 1999). Features that are difficult to extract solely from the sequence—such as kinetic pathways, protein facilitators, and ligand binding—also influence RNA folding. Identification of the correct RNA secondary structure also becomes much more difficult as the length of the RNA increases.
Selective 2′-hydroxyl acylation analyzed by primer extension (SHAPE) reagents can be used to interrogate the flexibility of nearly every nucleotide in an RNA (Merino et al. 2005; McGinnis et al. 2012). Reactivity at the 2′-hydroxyl toward the reagent 1-methyl-7-nitroisatoic anhydride (1M7) measures local nucleotide flexibility. Because base-paired nucleotides are also structurally constrained, SHAPE reactivity is roughly inversely proportional to the probability that a nucleotide is paired. Incorporation of SHAPE reactivity information into RNA folding algorithms results in accuracies >90% for most RNAs including those with single pseudoknots (Deigan et al. 2009; Hajdin et al. 2013). SHAPE has been used to create nucleotide-resolution models for the viral genomes of HIV-1 (Watts et al. 2009) and STMV (Archer et al. 2013) and to analyze conformational changes in HIV-1 (Wilkinson et al. 2008) and the Moloney murine leukemia virus (Grohman et al. 2013). Although SHAPE-directed folding yields near-perfect models for many RNAs, there remain a few RNAs whose structures are difficult to recover using a single structure probing experiment (Cordero et al. 2012; Leonard et al. 2013). These “hard” RNAs are modeled with sensitivities in the 75%–85% range.
The usefulness of secondary structure models at different accuracies can be summarized on a multipoint scale (Fig. 1), analogous to those used in other fields (Munroe 2012). Models with prediction sensitivities <60% contain large errors in gross structure and are not generally useful for generating biological hypotheses. Computational-only algorithms achieve median prediction accuracies of ∼70%. An individual model that recovers 70% of the accepted base pairs will have some correct helices and also critical errors (Fig. 1, second structure from bottom). Although approaches that recover 70% of the accepted base pairs include both correct and incorrect pairs, it is generally difficult to determine which helices are correct and which are not. Using SHAPE-directed modeling, the predicted structures for the most challenging RNAs contain 80%–85% of accepted base pairs. In some cases, the incorrectly predicted base pairs are scattered throughout the RNA such that the overall model is quite good. In other cases, errors are located in structural elements that are known to be functionally important (Fig. 1, middle structure).
FIGURE 1.
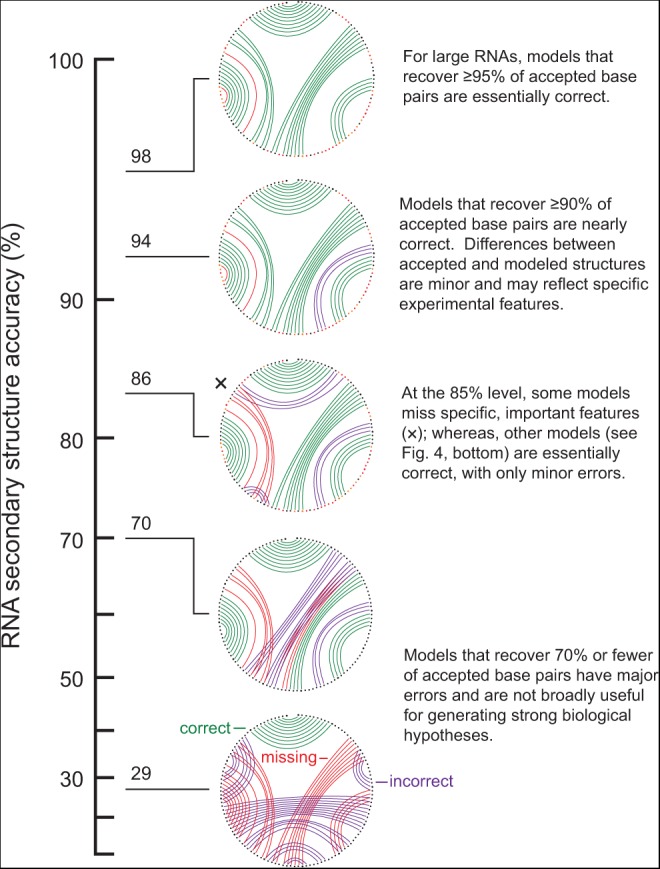
Accuracy of an RNA structure model and its usefulness for understanding structure–function inter-relationships. Representative structures for the E. coli 5S rRNA are shown. Accuracy is represented as the sensitivity and plotted on a reverse-logarithmic scale to emphasize the increasing level of difficulty as the standard for recovery of accepted base pairs increases. For all secondary structure (circle plot) diagrams, correct base pairs are shown in green, missing base pairs are shown in red, and extra base pairs relative to the accepted structure are shown in purple.
On average, SHAPE-directed modeling currently recovers ∼93% of accepted base pairs in challenging sets of RNA molecules. This level of sensitivity is sufficient for generation of robust biological hypotheses and for three-dimensional structure modeling. Many of the models generated at this level of accuracy differ from the accepted models by a few base pairs and should be considered nearly perfect (Fig. 1, upper structures). Improving accuracies to the >90% level for all RNAs is the current challenge in experimentally directed secondary structure modeling. Inclusion of additional comprehensive and information-rich biochemical information could further inform and potentially solve the RNA secondary structure modeling problem.
We recently described an approach that we call “differential” SHAPE that reveals local noncanonical and tertiary structure interactions based on simple biochemical probing experiments (Steen et al. 2012). In this strategy, the position-specific reactivities of two reagents, N-methylisatoic anhydride (NMIA) and 1-methyl-6-nitroisatoic anhydride (1M6), are compared. The first reagent, NMIA, has a relatively long half-life in solution and reacts preferentially with nucleotides that experience slow dynamics. Often these nucleotides are in the rare C2′-endo ribose conformation and have been implicated as molecular timers capable of governing folding in large RNAs (Gherghe et al. 2008; Mortimer and Weeks 2009). For the second reagent, the nitro group of 1M6 makes the two-ring system electron poor, and this reagent is able to stack with RNA nucleobases that are not protected by interactions with other nucleotides in an RNA structure (Steen et al. 2012). This conformation is unusual since most nucleobases stack with other bases on both faces (Leontis et al. 2006). By taking the difference in reactivity profiles for these two 2′-hydroxyl selective reagents, nucleotides involved in structurally distinctive interactions within an RNA structure can be identified (Fig. 2). Because the differential SHAPE analysis is specifically sensitive to noncanonical and tertiary interactions in RNA (Steen et al. 2012), this approach can help to identify nucleotides that are constrained (and thus unreactive to 1M7-SHAPE) but do not participate in canonical base-pairing. Here, we develop a pseudo-free energy term that includes information from the slow and stacking differential SHAPE reactivities to yield nearly perfect secondary structure models in a concise experiment that scales to RNAs of any size.
FIGURE 2.

Differential SHAPE analysis of the E. coli 5S rRNA. Normalized SHAPE reactivities from reactions with NMIA (top) and 1M6 (middle) are colored by nucleotide reactivity. Differential SHAPE reactivities (Steen et al. 2012) (bottom) were calculated by first scaling 1M6 to NMIA reactivities over a moving window and then subtracting 1M6 from NMIA reactivities. Strong differential reactivity enhancements (>|0.3| SHAPE units) are colored green for NMIA and blue for 1M6. These sites correspond to nucleotides with slow dynamics and those with a face available for stacking, respectively. Nucleotide positions showing strong positive-amplitude (favoring NMIA) differential reactivities are labeled.
RESULTS
Selection of a challenging test set
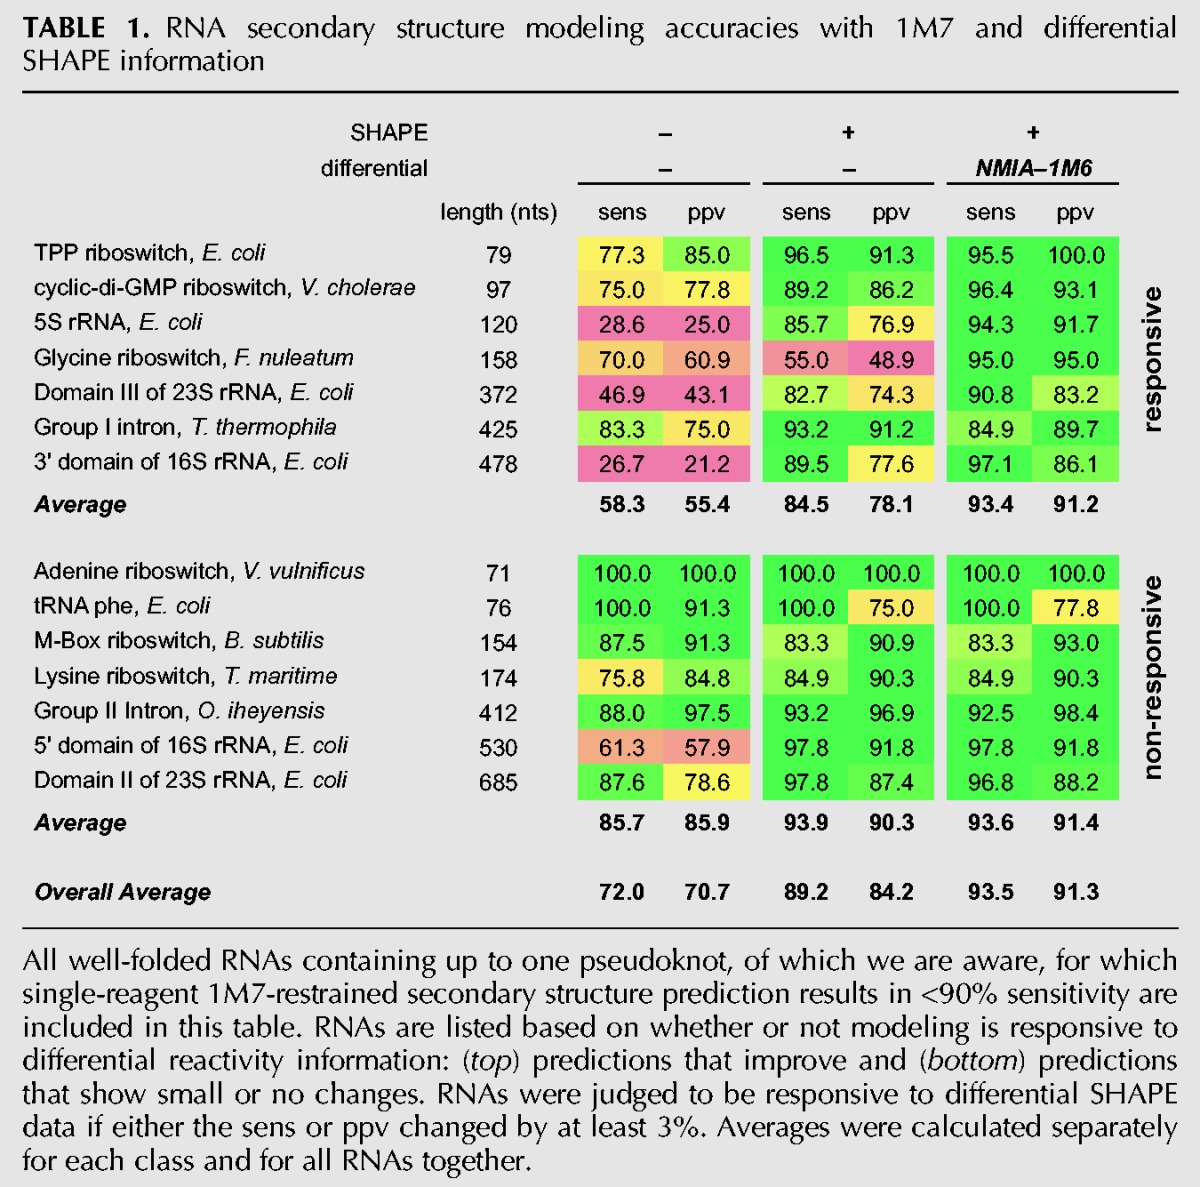
To evaluate the utility of incorporating differential SHAPE data into a modeling algorithm, we chose a set of diverse RNAs with well-established secondary structures for which single-reagent SHAPE-directed secondary structure prediction remains challenging (Table 1). These included six riboswitch aptamer domains that require ligand binding to fold into their accepted structures (the TPP, adenine, glycine, cyclic-di-GMP, M-Box, and lysine riboswitches); four RNAs longer than 300 nucleotides (nt), including several domains of the Escherichia coli 16S and 23S ribosomal RNAs; four pseudoknot-containing RNAs; and every other RNA of which we are aware that contains up to one pseudoknot for which the single-reagent 1M7 modeling accuracy is <90% (Cordero et al. 2012; Hajdin et al. 2013; Leonard et al. 2013; Table 1).
TABLE 1.
RNA secondary structure modeling accuracies with 1M7 and differential SHAPE information
Incorporation of differential SHAPE into secondary structure modeling
SHAPE experiments were performed with 1M7, NMIA, and 1M6 on RNAs preincubated in the presence of cognate ligand if appropriate but without protein. Based on pilot work on three short RNAs, SHAPE reactivity signals from NMIA and 1M6 correlate strongly at most positions (Steen et al. 2012). We therefore used a windowed scaling algorithm to locally normalize NMIA and 1M6 SHAPE profiles to each other (see Materials and Methods) and then subtracted the normalized profiles to generate differential SHAPE reactivity traces (Fig. 2).
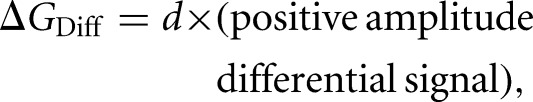
We used a statistical potential approach (Rohl et al. 2004; Cordero et al. 2012) to evaluate the differential SHAPE signals. This approach infers a free energy from the difference in the distributions of paired and nonpaired nucleotides. The energy function was linear and proved robust when subjected to a leave-one-out jackknife analysis (Supplemental Fig. S1). During fitting, we evaluated both positive and negative differential signals from NMIA and 1M6 (Fig. 2, bottom panel, green and blue bars, respectively). The negative-amplitude signal from 1M6 was not as highly correlated with single-stranded character at the sites of differential reactivity as was the positive-amplitude signal. The differential reactivity pseudo-free energy change term for each nucleotide was taken as
 |
1 |
where d is 2.11 kcal/mol. This energy penalty was added to the standard 1M7-based pseudo-free energy as implemented in ShapeKnots (Low and Weeks 2010; Hajdin et al. 2013); inclusion of this penalty improved predictions for many RNAs. For each RNA model, we report the accuracy of a secondary structure prediction in terms of its sensitivity (sens; fraction of base pairs in the accepted structure predicted correctly) and positive predictive value (ppv; the fraction of predicted pairs that occur in the accepted structure).
Impact of ΔGDiff on structure modeling
In the absence of experimental restraints, the mfold algorithm predicts only 10 of the 35 base pairs (29%) in the accepted structure of the E. coli 5S rRNA (Fig. 3, left). Addition of 1M7-SHAPE constraints yielded a substantial improvement: 86% of the accepted base pairs were present in the SHAPE-directed model. As is common for predictions at this level of accuracy, most of the structure is modeled correctly. The exceptions are base pairs in one element, a helix at a three-way junction (Fig. 3, middle structure, positions 102–107). When differential SHAPE data were added as constraints, a substantially improved structural model was obtained (Fig. 3, right). The errors in the differential SHAPE-based model are minor and involve the addition of a few base pairs in the second helix of the structure near nucleotide 30. These base pairs may in fact form under our probing conditions, given that this RNA was probed in the absence of ribosomal subunits and proteins.
FIGURE 3.

Representative secondary structure modeling for the 5S rRNA without and with SHAPE data. Base pair predictions are illustrated with colored lines (green, purple, and red denoting correct, incorrect, and missing base pairs, respectively) on conventional secondary structure representations (top) and circle plots (bottom). Nucleotides are colored according to their SHAPE reactivity on a black, yellow, red scale for low, medium, and strong reactivity. Nucleotides showing strong preferential reactivity with NMIA (>0.3 units) are indicated with a Δ symbol.
Addition of differential SHAPE information also improved the accuracy of prediction of the glycine riboswitch structure (Fig. 4, top). With data from 1M7 only, the predicted model for the glycine riboswitch had 55% sens and 49% ppv. The major error in the model is the prediction of a false pseudoknot that then propagates other errors (Fig. 4, top, left-hand structure). Inclusion of the differential SHAPE penalty resulted in sens and ppv of 95%. In this case, use of the differential reactivity penalty corrected major errors (for example, the differential reactivities at positions 12–13 and 112) and eliminated the false positive pseudoknot. In addition, lower magnitude differential reactivities shifted the folding landscape of nucleotides 39–49 to result in agreement of the predicted and accepted structures.
FIGURE 4.

Circle plots illustrating SHAPE-directed structure modeling for the glycine (top) and M-Box (bottom) riboswitches with 1M7 SHAPE data (left) and with 1M7 and differential reactivity data (right). Scheme for illustrating base-pair accuracy (relative to crystallographic structures) and nucleotide SHAPE reactivities are as outlined in Figure 3; positions with positive-amplitude (favoring NMIA) differential reactivities are indicated with a Δ symbol.
The predicted structure of the M-Box riboswitch, at 83% sensitivity (Table 1), was formally the lowest quality model in the test set. Differential reactivity constraints improved the prediction by a single base pair relative to the structure predicted using 1M7 data only (Fig. 4, bottom). The overall topology of the M-Box RNA is largely correct regardless of the inclusion of differential SHAPE information: The three-helix junction and all major helices are predicted correctly. The largest difference between the modeled and accepted structures occurs at the P1 helix connecting the 5′ and 3′ ends of the RNA (Fig. 4, bottom left). Nucleotides in this helix are moderately reactive toward SHAPE reagents, suggesting that the P1 helix is not especially stable under the conditions used for structure probing. In the crystal structure that is the basis for the accepted model, the P1 helix is stabilized by three G-C base pairs (Dann et al. 2007) that were not present in the transcript analyzed by SHAPE. SHAPE data suggest that the native sequence P1 helix is conformationally dynamic. For the sequence of RNA probed in this work, we infer that the SHAPE-constrained structure is essentially correct.
Responsive and nonresponsive RNAs
For the RNAs in our test set, predictions either significantly improved with the addition of differential SHAPE data or were only modestly affected. We define structural improvement as significant if the sensitivity or ppv or both increased by at least 3%. Seven RNAs in our data set showed significant improvement by this criterion (Table 1, top, responsive RNAs). The predicted structures for these RNAs increased in sensitivity from an average 84.5% to an average of 93.4%. Improvement in positive predictive value (ppv) was even more substantial: from 78.1% to 91.2%. Of the RNAs in the less responsive category, four of the eight showed small improvements in sensitivity or ppv (Table 1, middle), and the changes in the lowest free-energy structure involved relatively minor adjustments in base-pairing relative to structures predicted using 1M7 data only. Notably, although predictions for multiple RNAs were improved by the addition of differential SHAPE restraints, none of the predictions became substantially worse with the exception of the Tetrahymena group I intron (Table 1).
The modeled structure for the Tetrahymena group I intron became less like the accepted structure upon inclusion of differential reactivity information: The sensitivity decreased from 93% to 85% (Supplemental Fig. S2; Table 1). The P7 helix comprises a pseudoknot in the accepted RNA structure. One strand of the P7 helix is reactive by SHAPE and is not present in the SHAPE-directed model (Supplemental Fig. S2). Our data suggest that the P7 helix is conformationally dynamic under the solution probing conditions used in this work.
DISCUSSION
Developing accurate secondary structure models for long RNAs is an absolute prerequisite for understanding the role of RNA structure and RNA-ligand interactions in most phases of gene regulation (Mauger et al. 2013). Moreover, an accurate secondary structure model is critical for and can dramatically facilitate tertiary structure modeling (Hajdin et al. 2010; Bailor et al. 2011). The ideal approach for RNA structure modeling should balance high accuracy with concise and scalable experimentation. The nearest-neighbor thermodynamic model developed by Turner and colleagues (Mathews and Turner 2006) provides a critical foundation for secondary structure modeling. However, there are features of RNA folding that are difficult to extract from sequence, including ligand and protein binding effects, noncanonical and long-range tertiary structure interactions, and the kinetic history of the RNA folding reaction. Inclusion of single-reagent experimental structure probing data provides a substantial improvement in modeling accuracy for many RNAs (Deigan et al. 2009; Hajdin et al. 2013), but this improvement was not enough to yield accurate secondary structure models for all RNAs in our test set (Fig. 3). Here, we demonstrated that inclusion of information from a differential SHAPE experiment substantially increases the sensitivity and positive predictive value of secondary structure models for an RNA test set designed to be as challenging as possible (Table 1). The consistent, monotonic, trend in accuracy improvement observed suggests that each set of restraints—nearest neighbor parameters, 1M7-SHAPE, and differential SHAPE—provides information that is orthogonal to the others, roughly corresponding to local secondary structure, non-nearest neighbor interactions, and noncanonical and tertiary interactions, respectively.
The information content of three-reagent SHAPE-directed RNA structure modeling appears to exceed that of previously described chemical probing approaches. Addition of dimethyl sulfate (DMS) and CMCT reactivity information in the context of a data set of six small RNAs yielded improvement of roughly three base pairs in one RNA (Supplemental Table S1; Kladwang et al. 2011b; Cordero et al. 2012). In contrast, the differential SHAPE experiment yielded large, structurally significant improvements in seven RNAs (Table 1, top) and less dramatic improvements in four other RNAs (Table 1, middle) over and above single-reagent 1M7-directed modeling. Large improvement was observed for the 5S rRNA, which was not improved with addition of DMS and CMCT data (Cordero et al. 2012). In addition, models developed using three-reagent SHAPE probing have prediction accuracies that equal or exceed that of approaches that involve probing comprehensive sets of mutants (Kladwang et al. 2011a). The differential SHAPE data thus have high information content that is obtained in a concise experiment that scales readily to large RNAs.
Using differential SHAPE for RNA secondary structure prediction represents a significant advance in RNA structure modeling. With differential SHAPE information, the structures of some of the RNA molecules that were previously viewed as the most challenging, including the 5S rRNA, the glycine riboswitch, and some ribosomal domains, were modeled in nearly perfect agreement with the accepted structures (Table 1). An intriguing trend was that the RNAs that were most responsive to the differential reactivity penalty were those with structures predicted most poorly in the absence of differential SHAPE information. RNAs in this class likely have noncanonical interactions that are incompletely described by the nearest-neighbor algorithm or single-reagent data. In several cases in which SHAPE-directed models disagree with the accepted structures—those of the M-Box and lysine riboswitches and the Tetrahymena group I intron—“errors” appear to reflect differences between in-crystal and in-solution conformations for these RNAs.
Limitations and perspective
There are limitations to the experimentally restrained RNA structure modeling approach outlined here. By far, the most important of these is the restriction of having only a small database of RNAs with well-defined accepted structures (Rivas et al. 2012; Leonard et al. 2013). There are currently very few large RNAs with complex structures whose structures are well verified. This is an especially critical problem now that three-reagent SHAPE-directed structure modeling has reached such a high level of accuracy for RNAs of known structure. Second, approaches for modeling pseudoknots have advanced significantly (Hajdin et al. 2013) but accurate modeling of more than a single pseudoknot in a complex RNA remains a challenge, both due to limitations in current energy models and due to the computational requirements for many algorithms. Third, this work has focused on canonical base pairs and does not explicitly model noncanonical pairs, although in many cases these can be inferred from their lack of reactivity toward 1M7. Fourth, SHAPE-directed folding algorithms currently restrict base-pairing partners to within 600 nt. In general, this is a good assumption and, for example, allows full-length ribosomal RNAs to be modeled at high accuracy (Deigan et al. 2009). However, there are important RNA-RNA interactions that occur over distances of 1000 nt or more (Alvarez et al. 2005; Jin et al. 2011) that will not be detected with the current approach. Finally, SHAPE reactivities always reflect the structural ensemble present in solution at the time of probing. If an RNA is partially misfolded or samples multiple conformations, the resulting SHAPE profile will reflect these contributions.
The highly accurate RNA secondary structure modeling reported here involves straightforward experiments with three reagents 1M7 (Mortimer and Weeks 2007), 1M6, and NMIA (Steen et al. 2012). In this work, we examined complex RNA structures, including >3800 nt, and specifically focused on those RNAs thought to comprise the most difficult known modeling challenges. The limitations outlined above notwithstanding, we believe that three-reagent SHAPE is approaching the upper limit that solution-phase RNA structure probing can accomplish. Three-reagent SHAPE structure probing is experimentally concise, yields consistently accurate RNA structural models, and can be applied to RNAs of any complexity and size, including complete viral genomes and the constituents of entire transcriptomes.
MATERIALS AND METHODS
Chemical probing by differential SHAPE
Differential SHAPE data for the aptamer domains of the E. coli thiamine pyrophosphate (TPP) riboswitch, Vibrio vulnificus adenine riboswitch, and Thermotoga maritime lysine riboswitch were reported previously (Steen et al. 2012). DNA templates (IDT) for E. coli 5S rRNA and the tRNAPhe, Fusobacterium nucleatum glycine riboswitch, Bacillus subtilis M-Box riboswitch, Tetrahymena thermophila group I intron, and the Oceanobacillus iheyensis group II intron RNAs were encoded in the context of flanking 5′ and 3′ structure cassettes (Wilkinson et al. 2006), amplified by PCR, and transcribed into RNA using T7 RNA polymerase. RNAs were purified using denaturing polyacrylamide gel electrophoresis, excised from the gel, and passively eluted overnight at 4°C. 16S and 23S ribosomal RNAs were isolated from DH5α cells during mid-log phase using nondenaturing conditions (Deigan et al. 2009). RNAs were refolded in 100 mM HEPES, pH 8.0, 100 mM NaCl, and 10 mM MgCl2 (Steen et al. 2012). The glycine aptamer RNA was incubated with 5 μM final glycine during folding. After folding, all RNAs were modified in the presence of 8 mM SHAPE reagent and incubated for 3 min (1M6 and 1M7) or 22 min (NMIA) at 37°C. No-reagent controls, containing neat DMSO rather than SHAPE reagent, were performed in parallel.
Following modification and precipitation with ethanol, reagent and control RNAs were subjected to reverse transcription with Superscript III (Invitrogen) using fluorescently labeled primers (VIC dye, Invitrogen) that targeted the 3′ structure cassette (Wilkinson et al. 2006). A second, internal primer was used for the group II intron to read through the end of the RNA. A reverse transcription sequencing reaction using ddC and a NED-labeled primer was also performed to allow sequence alignment. Reagent or no-reagent control reactions were combined with sequencing reactions and analyzed using an ABI 3500 capillary electrophoresis instrument. Resulting data were processed using QuShape (Karabiber et al. 2013).
The ribosomal RNAs were analyzed by a new approach, SHAPE-MaP, which will be described in an independent communication (NA Siegfried, SG Busan, GM Rice, JAE Nelson, KM Weeks, in prep.). For all RNAs, 1M7 SHAPE reactivities were normalized using the boxplot approach (Hajdin et al. 2013). In this approach, reactivities were first sorted, and reactivities above either 1.5 × interquartile range or the 90th percentile, whichever value was greater, were excluded as outliers. Next, a normalization factor was calculated by averaging the next 10% of SHAPE reactivities. The original data set was then divided by the newly calculated normalization factor to yield the final processed data.
Differential SHAPE data analysis
NMIA and 1M6 SHAPE reactivities were normalized by excluding the top 2% of reactivities and dividing by the average of the next 8% of reactivities. 1M6 reactivities were then scaled more precisely to NMIA reactivities by minimizing the reactivity difference over a 51-nt sliding window. The scaled 1M6 reactivities were subtracted from NMIA reactivities to yield a differential SHAPE profile (Fig. 2). This algorithm, implemented in a python program, is included in the Supplemental Material.
Differential SHAPE pseudo-free energy change penalty
RNAs with secondary structures derived from high-resolution methods (crystallography or NMR) were used to classify the conformation of nucleotides as either paired (G-C, A-U, or G-U) or nonpaired. Next, a histogram of differential reactivities (NMIA reactivity minus 1M6 reactivity) for each category was created using a bin-width of 0.2 SHAPE units. Positive and negative differential SHAPE reactivities were treated separately. A ΔGDiff statistical energy potential was then fit using an approach analogous to those used extensively for protein modeling (Rohl et al. 2004) and recently for RNA modeling (Cordero et al. 2012). Histograms of paired and nonpaired differential nucleotides from all RNAs were pooled and fit to a γ distribution (Supplemental Fig. S1A). A free energy at a temperature (T) of 310 K was calculated using the Gibbs relationship
 |
P(x)paired and P(x)nonpaired are the probabilities that a nucleotide is paired or nonpaired at SHAPE reactivity x, respectively; kb is the Boltzmann constant; and ΔGDiff is the resulting free change energy penalty that should be applied to a particular differential SHAPE reactivity, x. The resulting function was linear with an intercept near zero. To simplify the calculation and to make the energy function continuous for all differential reactivities, ΔGDiff was fit to a linear equation with an intercept of zero. A standard error measurement of the fit was estimated by a leave-one-out jackknife approach; the resulting fit was a line with a slope of 2.11 kcal/mol and an intercept of zero (Supplemental Fig. S1B).
Exploration of simpler differential SHAPE energy potentials
We explored the possibility of omitting the 1M6 experiment and calculating differential SHAPE reactivities based only on 1M7 and NMIA experiments. Reactivity differences between NMIA and 1M7 were calculated for each nucleotide using the difference subtraction algorithm outlined above. The relationship was linear with a slope of 2.91 kcal/mol. Standard errors resulting from a leave-one-out jackknife analysis were of similar magnitude to those of the relationship between NMIA and 1M6 reactivities. This two-reagent version of the differential SHAPE experiment yielded significant improvements to RNA secondary structure modeling (Supplemental Table S2); however, the three-reagent analysis ultimately yielded more accurate structure models (cf. Table 1 and Supplemental Table S2). Due to the higher information content of the NMIA–1M6 differential analysis, we recommend using three reagents (1M7, 1M6, and NMIA) to achieve highest accuracies in secondary structure modeling.
During the course of fitting our new differential SHAPE data, we also refit the 1M7 free energy potential using a statistical potential and our previously published RNA data set (Hajdin et al. 2013). Paired and nonpaired nucleotide distributions were fit to a mixture of two γ distributions, and a free energy change term was calculated using the Gibbs relationship. The resulting free energy change function was comparable in magnitude and x-intercept to the prior grid-search optimized log function (Supplemental Fig. S3). Thus, we have chosen to use the original log-function for incorporating 1M7 data into SHAPE-directed structure modeling.
Implementation in RNAstructure Fold and ShapeKnots
A modified SHAPE energy file was created for use in RNAstructure Fold (Reuter and Mathews 2010) and ShapeKnots (Hajdin et al. 2013) to incorporate the differential SHAPE information. Differential pseudo-free energy change values (ΔGDiff) for each nucleotide were calculated from the positive-amplitude differential reactivities (d)
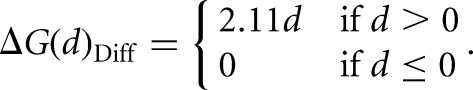 |
SHAPE pseudo-free energy changes were calculated from 1M7 reactivities using the log-form SHAPE equation (Hajdin et al. 2013)
These two free energies were summed, and a modified SHAPE reactivity file was calculated for use in Fold or ShapeKnots such that, when used with slope of 1.0 and an intercept of −1.0, the folding algorithm applies the appropriate pseudo-free energy change term
Future versions of ShapeKnots and Fold will simplify this procedure and allow the 1M7 and differential-SHAPE magnitudes to be entered directly from a data file. For ShapeKnots, the optimized pseudoknot parameters (P1 = 3.5, P2 = 6.5) (Hajdin et al. 2013) were used. The maxtracebacks option was set to 100 and the window option was set to 0 to maximize the number of potential identified structures.
The calculation for folding RNAs using 1M7 rather than 1M6 as the differential reagent was performed in the same way, except that the differential slope was 2.91. The resulting folds are summarized in Supplemental Table S2. In general, we recommend using ShapeKnots for RNA secondary structure modeling because of its ability to predict pseudoknots (Hajdin et al. 2013); at a practical level, this program is limited to RNAs under ∼700 nt in length.
Plots and figures
Secondary structure plots were constructed using VARNA (Darty et al. 2009), and circle plots were made using CircleCompare, a part of RNAstructure (Reuter and Mathews 2010). Model sens was calculated as the number of correct base pairs divided by the total number of base pairs in the accepted structure; ppv was calculated as the number of correct base pairs divided by the total number of predicted base pairs. sens and ppv values for ribosomal domains were calculated after omitting regions (Deigan et al. 2009) in which SHAPE reactivities were clearly not consistent with the pattern of base-pairing in the accepted secondary structure model.
DATA DEPOSITION
Structure probing data have been deposited in the single-nucleotide resolution nucleic acid structure mapping (SNRNASM) community structure probing database and are also freely available from the corresponding author's website (http://www.chem.unc.edu/rna).
SUPPLEMENTAL MATERIAL
Supplemental material is available for this article.
ACKNOWLEDGMENTS
We thank Kady-Ann Steen, Christine Hajdin, Fethullah Karabiber, and Elizabeth Dethoff for insightful discussions and for sharing of SHAPE data and David Mathews and Stanislav Bellaousov for incorporating the differential reactivity penalty into an upcoming version of RNAstructure. This work was supported by grants from the NSF (MCB-1121024) and NIH (AI068462) to K.M.W. G.M.R. was supported in part by an NIH training grant in molecular and cellular biophysics (T32GM08570).
REFERENCES
- Alvarez DE, Lodeiro MF, Ludueña SJ, Pietrasanta LI, Gamarnik AV 2005. Long-range RNA-RNA interactions circularize the dengue virus genome. J Virol 79: 6631–6643 [DOI] [PMC free article] [PubMed] [Google Scholar]
- Archer EJ, Simpson MA, Watts NJ, O'Kane R, Wang B, Erie DA, McPherson A, Weeks KM 2013. Long-range architecture in a viral RNA genome. Biochemistry 52: 3182–3190 [DOI] [PMC free article] [PubMed] [Google Scholar]
- Bailor MH, Mustoe AM, Brooks CL, Al-Hashimi HM 2011. Topological constraints: using RNA secondary structure to model 3D conformation, folding pathways, and dynamic adaptation. Curr Opin Struct Biol 21: 296–305 [DOI] [PMC free article] [PubMed] [Google Scholar]
- Cordero P, Kladwang W, VanLang CC, Das R 2012. Quantitative dimethyl sulfate mapping for automated RNA secondary structure inference. Biochemistry 51: 7037–7039 [DOI] [PMC free article] [PubMed] [Google Scholar]
- Dann CE, Wakeman CA, Sieling CL, Baker SC, Irnov I, Winkler WC 2007. Structure and mechanism of a metal-sensing regulatory RNA. Cell 130: 878–892 [DOI] [PubMed] [Google Scholar]
- Darty K, Denise A, Ponty Y 2009. VARNA: interactive drawing and editing of the RNA secondary structure. Bioinformatics 25: 1974–1975 [DOI] [PMC free article] [PubMed] [Google Scholar]
- Deigan KE, Li TW, Mathews DH, Weeks KM 2009. Accurate SHAPE-directed RNA structure determination. Proc Natl Acad Sci 106: 97–102 [DOI] [PMC free article] [PubMed] [Google Scholar]
- Dethoff EA, Chugh J, Mustoe AM, Al-Hashimi HM 2012. Functional complexity and regulation through RNA dynamics. Nature 482: 322–330 [DOI] [PMC free article] [PubMed] [Google Scholar]
- Gherghe CM, Mortimer SA, Krahn JM, Thompson NL, Weeks KM 2008. Slow conformational dynamics at C2′-endo nucleotides in RNA. J Am Chem Soc 130: 8884–8885 [DOI] [PMC free article] [PubMed] [Google Scholar]
- Grohman JK, Gorelick RJ, Lickwar CR, Lieb JD, Bower BD, Znosko BM, Weeks KM 2013. A guanosine-centric mechanism for RNA chaperone function. Science 340: 190–195 [DOI] [PMC free article] [PubMed] [Google Scholar]
- Hajdin CE, Ding F, Dokholyan NV, Weeks KM 2010. On the significance of an RNA tertiary structure prediction. RNA 16: 1340–1349 [DOI] [PMC free article] [PubMed] [Google Scholar]
- Hajdin CE, Bellaousov S, Huggins W, Leonard CW, Mathews DH, Weeks KM 2013. Accurate SHAPE-directed RNA secondary structure modeling, including pseudoknots. Proc Natl Acad Sci 110: 5498–5503 [DOI] [PMC free article] [PubMed] [Google Scholar]
- Jin Y, Yang Y, Zhang P 2011. New insights into RNA secondary structure in the alternative splicing of pre-mRNAs. RNA Biol 8: 450–457 [DOI] [PubMed] [Google Scholar]
- Karabiber F, McGinnis JL, Favorov OV, Weeks KM 2013. QuShape: rapid, accurate, and best-practices quantification of nucleic acid probing information, resolved by capillary electrophoresis. RNA 19: 63–73 [DOI] [PMC free article] [PubMed] [Google Scholar]
- Kladwang W, VanLang CC, Cordero P, Das R 2011a. A two-dimensional mutate-and-map strategy for non-coding RNA structure. Nat Chem 3: 954–962 [DOI] [PMC free article] [PubMed] [Google Scholar]
- Kladwang W, VanLang CC, Cordero P, Das R 2011b. Understanding the errors of SHAPE-directed RNA structure modeling. Biochemistry 50: 8049–8056 [DOI] [PMC free article] [PubMed] [Google Scholar]
- Leonard CW, Hajdin CE, Karabiber F, Mathews DH, Favorov OV, Dokholyan NV, Weeks KM 2013. Principles for understanding the accuracy of SHAPE-directed RNA structure modeling. Biochemistry 52: 588–595 [DOI] [PMC free article] [PubMed] [Google Scholar]
- Leontis NB, Lescoute A, Westhof E 2006. The building blocks and motifs of RNA architecture. Curr Opin Struct Biol 16: 279–287 [DOI] [PMC free article] [PubMed] [Google Scholar]
- Low JT, Weeks KM 2010. SHAPE-directed RNA secondary structure prediction. Methods 52: 150–158 [DOI] [PMC free article] [PubMed] [Google Scholar]
- Mathews DH, Turner DH 2006. Prediction of RNA secondary structure by free energy minimization. Curr Opin Struct Biol 16: 270–278 [DOI] [PubMed] [Google Scholar]
- Mathews DH, Disney MD, Childs JL, Schroeder SJ, Zuker M, Turner DH 2004. Incorporating chemical modification constraints into a dynamic programming algorithm for prediction of RNA secondary structure. Proc Natl Acad Sci 101: 7287–7292 [DOI] [PMC free article] [PubMed] [Google Scholar]
- Mauger DM, Siegfried NA, Weeks KM 2013. The genetic code as expressed through relationships between mRNA structure and protein function. FEBS Lett 587: 1180–1188 [DOI] [PMC free article] [PubMed] [Google Scholar]
- McGinnis JL, Dunkle JA, Cate JHD, Weeks KM 2012. The mechanisms of RNA SHAPE chemistry. J Am Chem Soc 134: 6617–6624 [DOI] [PMC free article] [PubMed] [Google Scholar]
- Merino EJ, Wilkinson KA, Coughlan JL, Weeks KM 2005. RNA structure analysis at single nucleotide resolution by selective 2′-hydroxyl acylation and primer extension (SHAPE). J Am Chem Soc 127: 4223–4231 [DOI] [PubMed] [Google Scholar]
- Mortimer SA, Weeks KM 2007. A fast-acting reagent for accurate analysis of RNA secondary and tertiary structure by SHAPE chemistry. J Am Chem Soc 129: 4144–4145 [DOI] [PubMed] [Google Scholar]
- Mortimer SA, Weeks KM 2009. C2′-endo nucleotides as molecular timers suggested by the folding of an RNA domain. Proc Natl Acad Sci 106: 15622–15627 [DOI] [PMC free article] [PubMed] [Google Scholar]
- Munroe R 2012. Star Ratings. http://xkcd.com/1098/ [Google Scholar]
- Reuter JS, Mathews DH 2010. RNAstructure: software for RNA secondary structure prediction and analysis. BMC Bioinformatics 11: 129. [DOI] [PMC free article] [PubMed] [Google Scholar]
- Rivas E, Lang R, Eddy SR 2012. A range of complex probabilistic models for RNA secondary structure prediction that includes the nearest-neighbor model and more. RNA 18: 193–212 [DOI] [PMC free article] [PubMed] [Google Scholar]
- Rohl CA, Strauss CEM, Misura KMS, Baker D 2004. Protein structure prediction using Rosetta. Methods Enzymol 383: 66–93 [DOI] [PubMed] [Google Scholar]
- Sharp PA 2009. The centrality of RNA. Cell 136: 577–580 [DOI] [PubMed] [Google Scholar]
- Steen K-A, Rice GM, Weeks KM 2012. Fingerprinting noncanonical and tertiary RNA structures by differential SHAPE reactivity. J Am Chem Soc 134: 13160–13163 [DOI] [PMC free article] [PubMed] [Google Scholar]
- Tinoco I, Bustamante C 1999. How RNA folds. J Mol Biol 293: 271–281 [DOI] [PubMed] [Google Scholar]
- Watts JM, Dang KK, Gorelick RJ, Leonard CW, Bess JW, Swanstrom R, Burch CL, Weeks KM 2009. Architecture and secondary structure of an entire HIV-1 RNA genome. Nature 460: 711–716 [DOI] [PMC free article] [PubMed] [Google Scholar]
- Weeks KM 2010. Advances in RNA structure analysis by chemical probing. Curr Opin Struct Biol 20: 295–304 [DOI] [PMC free article] [PubMed] [Google Scholar]
- Wilkinson KA, Merino EJ, Weeks KM 2006. Selective 2′-hydroxyl acylation analyzed by primer extension (SHAPE): quantitative RNA structure analysis at single nucleotide resolution. Nat Protoc 1: 1610–1616 [DOI] [PubMed] [Google Scholar]
- Wilkinson KA, Gorelick RJ, Vasa SM, Guex N, Rein A, Mathews DH, Giddings MC, Weeks KM 2008. High-throughput SHAPE analysis reveals structures in HIV-1 genomic RNA strongly conserved across distinct biological states. PLoS Biol 6: e96. [DOI] [PMC free article] [PubMed] [Google Scholar]