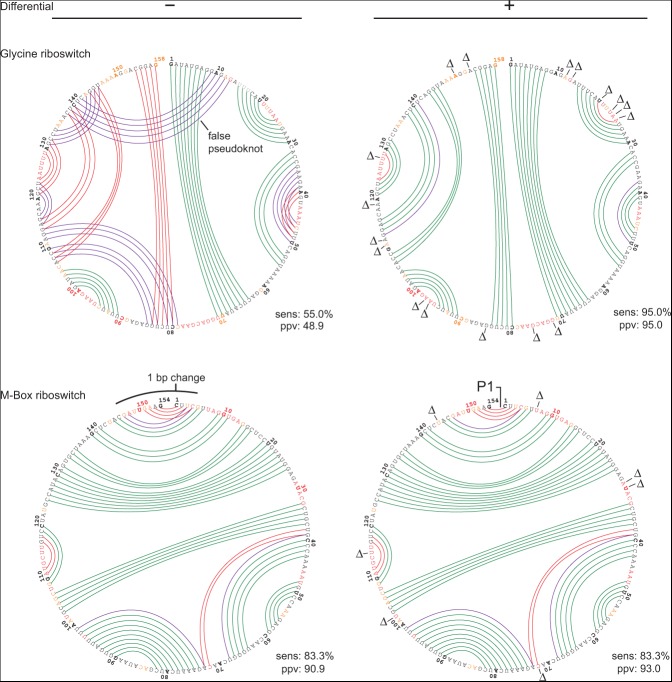
FIGURE 4.
Circle plots illustrating SHAPE-directed structure modeling for the glycine (top) and M-Box (bottom) riboswitches with 1M7 SHAPE data (left) and with 1M7 and differential reactivity data (right). Scheme for illustrating base-pair accuracy (relative to crystallographic structures) and nucleotide SHAPE reactivities are as outlined in Figure 3; positions with positive-amplitude (favoring NMIA) differential reactivities are indicated with a Δ symbol.

