

These studies focused on how macrophage activation induced through Toll-like receptor 4 (TLR4) modulates the expression of pro- and anti-inflammatory cytokines. Using RIP-Chip analysis, the authors identified mRNAs that are differentially associated with heterogeneous nuclear ribonucleoprotein K (hnRNP K), a known mRNA-specific translational regulator in differentiating hematopoetic cells. One of these targets, transforming growth factor-β-activated kinase 1 (TAK1), is indeed bound by hnRNP K via a sequence in the 3′ UTR in uninduced cells. However, macrophage activation apparently triggers the release of hnRNP K, thus relieving translational repression. The result is that newly synthesized TAK1 can promote an appropriate inflammatory response.
Keywords: hnRNP K, LPS, post-transcriptional regulation, TAK1 mRNA, TLR4-signaling
Abstract
Macrophage activation by bacterial lipopolysaccharides (LPS) is induced through Toll-like receptor 4 (TLR4). The synthesis and activity of TLR4 downstream signaling molecules modulates the expression of pro- and anti-inflammatory cytokines. To address the impact of post-transcriptional regulation on that process, we performed RIP-Chip analysis. Differential association of mRNAs with heterogeneous nuclear ribonucleoprotein K (hnRNP K), an mRNA-specific translational regulator in differentiating hematopoietic cells, was studied in noninduced and LPS-activated macrophages. Analysis of interactions affected by LPS revealed several mRNAs encoding TLR4 downstream kinases and their modulators. We focused on transforming growth factor-β-activated kinase 1 (TAK1) a central player in TLR4 signaling. HnRNP K interacts specifically with a sequence in the TAK1 mRNA 3′ UTR in vitro. Silencing of hnRNP K does not affect TAK1 mRNA synthesis or stability but enhances TAK1 mRNA translation, resulting in elevated TNF-α, IL-1β, and IL-10 mRNA expression. Our data suggest that the hnRNP K-3′ UTR complex inhibits TAK1 mRNA translation in noninduced macrophages. LPS-dependent TLR4 activation abrogates translational repression and newly synthesized TAK1 boosts macrophage inflammatory response.
INTRODUCTION
Innate immunity is the first line of defense against pathogens triggered by diverse microbial products. Lipopolysaccharides (LPS) that act on Toll-like receptor 4 (TLR4) induce mitogen activated kinase (MAPK) and NFκB activity through different branches of the TLR4 pathway and subsequently enforce pro- and anti-inflammatory cytokine expression.
LPS binding protein (LBP) and CD14 transfer LPS to the macrophage TLR4-MD2 complex (Shimazu et al. 1999; Miyake 2006). Thereby the formation of a receptor multimer composed of two copies of the TLR4-MD2-LPS complex (Park et al. 2009) is induced. The TLR4-dimer recruits two adapter proteins, MyD88 and TRIF (Janssens and Beyaert 2002; O'Neill 2006). The latter mediates activation of interferon regulatory factor (IRF) 3 and IRF7, and enhanced interferon expression affects signal transducer and activator of transcription (STAT) activation (Honda and Taniguchi 2006) and induces a late NFκB response (Yamamoto et al. 2003).
The MyD88-dependent branch of the TLR4 pathway activates the IκB kinase (IKK)-NFκB pathway early response and three MAPKs: extracellular signal-regulated kinase (ERK) 1/2, c-Jun N-terminal kinase (JNK), and p38 (Guha and Mackman 2001). MyD88 recruits interleukin-1 receptor-associated kinase (IRAK) 1 and IRAK4 (Gan and Li 2006). Phosphorylation of IRAK1 by IRAK4 is required for tumor necrosis factor receptor-associated factor 6 (TRAF6) recruitment to the TLR4-MD2 receptor (Inoue et al. 2007; Kim et al. 2007). IRAK1-TRAF6 dissociates from the complex and activates TAK1, a MAP3K member (Wang et al. 2001). TAK1, in turn, phosphorylates MKK4, MKK3/6, and IKK, which activates JNK and p38 pathways and induces IкB degradation, leading to NFкB activation (Wang et al. 2001). Transcription factor activation by these pathways coordinates the induction of pro- and anti-inflammatory cytokines genes, such as TNF-α, IL-1, IL-6, IL-8, and IL-10 (Ulloa and Tracey 2005).
The analysis of LPS-induced changes in macrophage gene expression profiles revealed genome-wide alterations in alveolar and RAW 264.7 macrophages (Rutledge et al. 2011; Reynier et al. 2012), but information about the contribution of post-transcriptional processes that affect expression downstream from differential gene regulation is still fragmentary.
Many cytokine mRNAs, which have very short half-lives, bear AU-rich sequence elements (ARE) within their 3′ UTRs (Wilusz et al. 2001) that represent specific protein interaction sites (Anderson 2008; Clark et al. 2009). It has been shown that the LPS-dependent MKK3/6-p38-MK2 pathway increases the TNF-α mRNA half-life through phosphorylation and stabilization of the ARE-binding protein tristetraprolin (TTP) (Hitti et al. 2006; Tiedje et al. 2010, 2012); similarly KH-type splicing regulatory protein (KSRP) stabilizes IL-8 mRNA (Winzen et al. 2007).
Importantly, the synthesis of TLR4 downstream kinases and their modulators, which is essential for the tight control of inflammatory cytokine expression, is also regulated post-transcriptionally. A role of RNA binding proteins and miRNAs in innate immune response has begun to emerge, but information about molecular mechanisms of their action is scarce. Recently, an hnRNP D (AUF1)-TAK1 mRNA interaction was shown to promote TAK1 mRNA translation (Sarkar et al. 2011). Furthermore, miR-146a/b was implicated in IRAK1 and TRAF6 mRNA translation control (Taganov et al. 2006) and miR-155 in modulation of IL-1 signaling in LPS-activated monocyte-derived dendritic cells (Ceppi et al. 2009).
To analyze the impact of post-transcriptional regulation on LPS-induced TLR4 signaling and cytokine expression in RAW 264.7 macrophages, RNA immunoprecipitation and microarray analysis (RIP-Chip) was performed with hnRNP K as bait. HnRNP K had been characterized as a specific regulator of mRNA translation in hematopoietic cells. It controls translation of reticulocyte 15-lipoxygenase (r15-LOX) mRNA in erythroid cells (Ostareck et al. 2001) and stability of cyclooxygenase (COX) 2 mRNA in monocytes (Shanmugam et al. 2008).
To identify mRNAs that encode TLR4 downstream kinases and their modulators, which are bound by hnRNP K in a LPS-dependent manner, cytoplasmic extracts were prepared from untreated macrophages, and after 6 h LPS stimulation, and specifically coprecipitated mRNAs were applied to microarray analysis. One thousand nine hundred and one mRNAs were differentially enriched on hnRNP K in untreated compared to LPS-induced macrophages. Interestingly, 163 mRNAs encode immune response proteins, from which 21 candidates related to TLR4 signaling were selected for quantitative real-time PCR (qPCR) expression analysis. Equal amplification from the RNA pool isolated from untreated and LPS-induced macrophages qualified 14 mRNAs as potential targets of translational regulation. An increased specific accumulation on hnRNP K was determined for seven mRNAs in untreated compared to LPS-induced macrophages, from which we chose TAK1 mRNA that encodes a central kinase in TLR4 signaling for further analysis. Importantly, in primary bone marrow-derived macrophages (BMDMs) from C57BL/6 mice, the differential enrichment could be confirmed. Employing in vitro RNA-binding assays, we demonstrated that hnRNP K homology domain (KH) 3 of hnRNP K specifically interacts with a TAK1 mRNA 3′ UTR motif. Silencing of hnRNP K by RNAi does not affect TAK1 mRNA synthesis but increases its translation in untreated macrophages. The reduced level of hnRNP K changes the LPS response to an earlier and extended p38 phosphorylation, which leads to elevated cytokine mRNA synthesis. This suggests that through translational regulation of the central kinase TAK1, hnRNP K modulates LPS-induced TLR4 signaling and boosts cytokine mRNA expression as a critical inflammatory response of macrophages.
RESULTS
Identification of hnRNP K-associated mRNAs affected in macrophage LPS response
To identify new regulatory mRNA protein complexes (mRNP) that modulate the macrophage inflammatory response to LPS, we generated extracts from murine RAW 264.7 macrophages and validated the impact of post-transcriptional regulation on newly identified mRNAs in primary BMDMs from C57BL/6 mice.
The inflammatory response of RAW 264.7 macrophages and BMDMs was induced with 10 ng/mL and 80 ng/mL LPS, respectively, which were determined as the minimal effective concentration (data not shown). When RAW 264.7 cells and BMDMs were LPS-treated for 6 h (Fig. 1A), a strong and sustained activation of p38 could be detected after 10 min in BMDMs (Fig. 1A, lanes 10–14), whereas RAW 264.7 cells responded with a short activation after 20 min (Fig. 1A, lane 3). LPS-induced cytokine mRNA synthesis was monitored for 24 h by RT-PCR (Fig. 1B). Pro-inflammatory (TNF-α, IL-1β, and IL-6) cytokine mRNAs were expressed in a comparable single-phase pattern (Fig. 1B, lanes 1–12), whereas for mRNAs encoding the anti-inflammatory cytokine IL-10 and COX-2, the pattern differed between RAW 264.7 cells and BMDMs (Fig. 1B, cf. lanes 1–12 and lanes 13–24). The expression of two control mRNAs did not change (Fig. 1B, lanes 1–24). In both cell types, the proteins hnRNP K and GAPDH were not affected by LPS-induction (Fig. 1C, lanes 1–24). The macrophage activation state was characterized by FACS analysis at 0, 2, 6, and 10 h. Living RAW 264.7 cells (Fig. 1D, left panel) and BMDMs (Fig. 1D, right panel) were identified by CD11b and F4/80 expression (data not shown). Macrophage activation markers (CD14, CD40, CD80, and CD86) (Tacke and Randolph 2006; D'Anto et al. 2009) were increased in LPS-treated CD11b and F4/80 positive cells (Fig. 1D). The lack of CD11c expression confirmed the absence of dendritic cells (data not shown).
FIGURE 1.

LPS-induced activation of RAW 264.7 cells and BMDMs. (A) RAW 264.7 cells (left panel) and BMDMs from healthy C57BL/6 mice (right panel) were treated for 6 h with 10 ng/mL or 80 ng/mL LPS, respectively, and analyzed at the indicated time points with antibodies against p38, phospho-p38 (p-p38), and GAPDH in Western blot assays. (B) RAW 264.7 cells (left panel) and BMDMs from healthy C57BL/6 mice (right panel) were treated for 24 h with 10 ng/mL or 80 ng/mL LPS, respectively, and induction of mRNAs that encode pro-inflammatory (TNF-α, IL-1β, IL-6) and anti-inflammatory (IL-10) cytokines and COX-2 was monitored by RT-PCR; NDUFV1 mRNA (RAW 264.7 cells) and mRNA encoding ribosomal protein S7 (rpS7) (BMDMs) served as controls. (C) Expression of hnRNP K and GAPDH was monitored in Western blot assays. (D) CD14, CD40, CD80, and CD86 were used as markers for macrophage activation of RAW 264.7 cells (left panel) after LPS stimulation for 2, 6, and 10 h and BMDMs (right panel) after LPS stimulation for 2, 4, 6, and 10 h.
To identify new mRNAs that are controlled post-transcriptionally in macrophage activation by RIP-Chip analysis, we focused on hnRNP K, which regulates mRNA translation in hematopoietic cells (Ostareck-Lederer and Ostareck 2012). HnRNP K was specifically immunoprecipitated with an anti-hnRNP K antibody from cytoplasmic extracts of untreated RAW 264.7 cells or after 6 h LPS treatment (Fig. 2A, lanes 3,4,7,8). COX-2 mRNA specifically coprecipitated with hnRNP K as previously shown for THP-1 cells (Shanmugam et al. 2008), but Myosin (MYO) 10 mRNA did not (Fig. 2B, lanes 5,6).
FIGURE 2.

Identification and validation of hnRNP K-interacting mRNAs in RAW 264.7 cells and BMDMs. (A) Immunoprecipitated hnRNP K from cytoplasmic extracts of noninduced RAW 264.7 cells and after 6 h LPS stimulation was detected by Western blotting. For the control immunoprecipitation a nonrelated antibody (ctrl.) was used. (B) Coprecipitated mRNAs were detected by RT-PCR as indicated. (C) MRNAs identified by microarrays were classified according to their Gene Ontology–annotated biological processes with PANTHER. (D) RAW 264.7 cells (left panel) or BMDMs from healthy C57BL/6 mice (right panel) were treated for 6 h with 10 ng/mL or 80 ng/mL LPS, respectively. Equal amounts of cytoplasmic extracts were used for immunoprecipitation with an anti-hnRNP K or a control antibody. Copurified mRNAs were analyzed by qPCR. MRNAs specifically enriched on hnRNP K were normalized to five controls (RAW 264.7) or two controls (BMDMs) that did not interact with hnRNP K.
The RNA pool that coprecipitated with hnRNP K from extracts of untreated and LPS-induced RAW 264.7 cells was purified, and mRNAs were converted to cDNAs and analyzed on Affymetrix GeneChipMouse Genome 430 2.0 arrays. The analysis included mRNAs purified from the input as well as the hnRNP K and control precipitations from untreated and LPS-induced RAW 264.7 cells, each in duplicates. We identified 1901 mRNAs that differentially interact with hnRNP K in response to 6 h LPS-induction. For those mRNAs, GO-term annotation employing PANTHER (Thomas et al. 2003) revealed 3404 hits. Encoded proteins could be allocated to biological processes like “metabolic process” (966), “cellular process” (570), “cell communication” (336), “transport” (257), “cell cycle” (227), “developmental process” (222), “immune response” (163), and others (Fig. 2C). We focused on the 163 immune response-related mRNAs for further analysis.
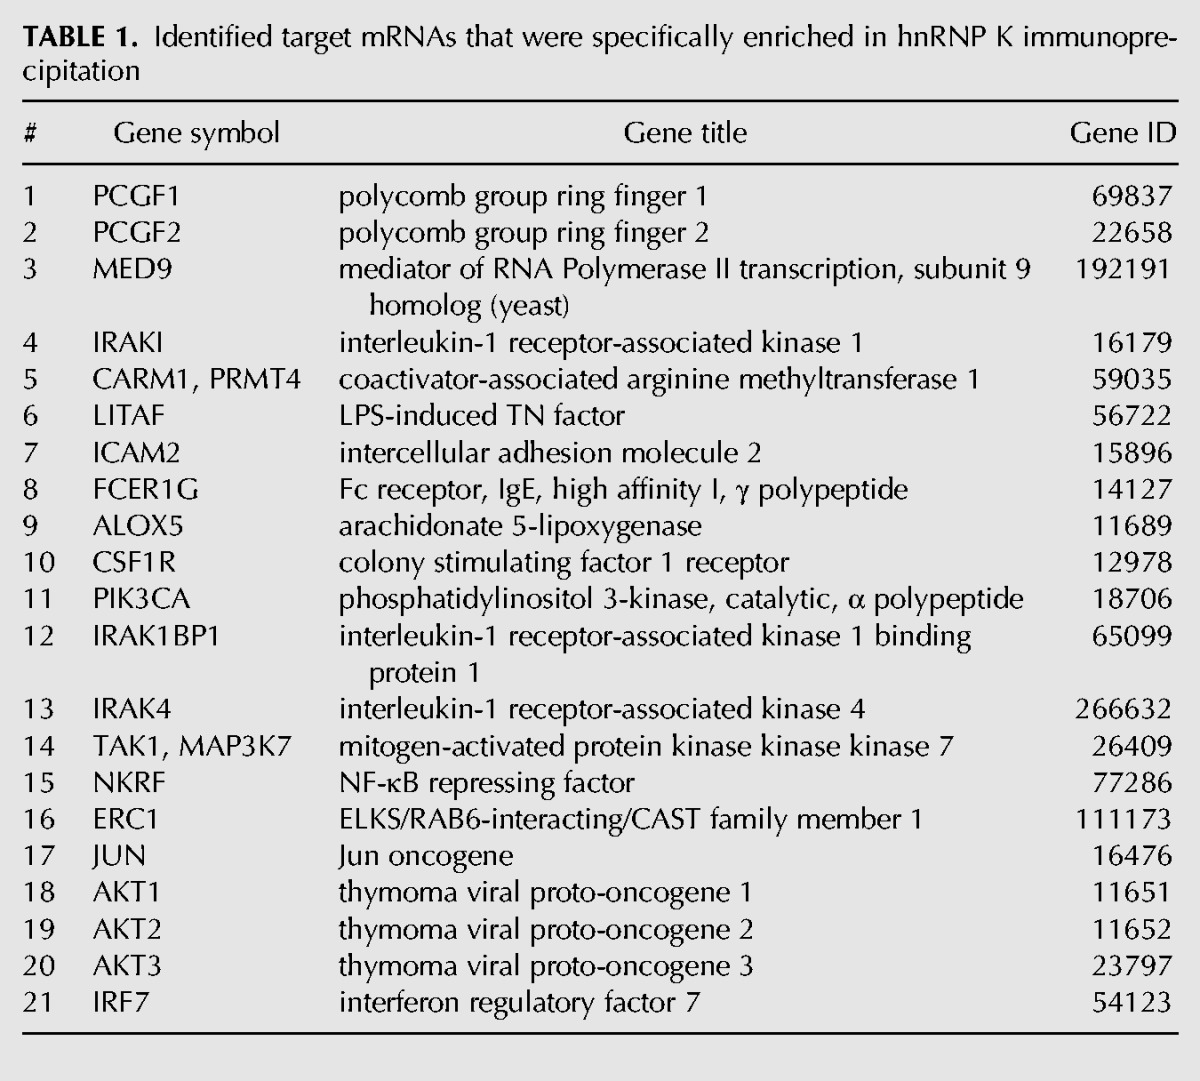
To validate newly identified mRNAs, which are differentially associated with hnRNP K, we selected 21 candidates (Table 1) that encode proteins acting in TLR4 signaling and associated pathways. First, we tested by qPCR whether the 21 mRNAs are equally expressed in untreated RAW 264.7 cells and after LPS-induction to dissect transcriptional from translational control. In the RNA pool isolated from untreated and LPS-induced RAW 264.7 cells, equal amplification could be detected for 14 mRNAs, whereas seven were excluded by that criterion (data not shown). Analysis of the hnRNP K immunoprecipitation revealed that seven of the 14 mRNAs were enriched on hnRNP K in untreated RAW 264.7 cells (Fig. 2D, left panel). For these mRNAs that encode IRAK4, TAK1, IRAK1BP1, ERC1, CARM1/PRMT4, PIK3CA, and AKT3, the results were confirmed by hnRNP K immunoprecipitation from cytoplasmic extracts of untreated and LPS-induced BMDMs from C57BL/6 mice (Fig. 2D, right panel).
TABLE 1.
Identified target mRNAs that were specifically enriched in hnRNP K immunoprecipitation
HnRNP K binds the 3′ UTR of TAK1 mRNA that encodes a central TLR4 signaling kinase
In order to examine whether hnRNP K is involved in LPS-dependent regulation of TLR4 downstream protein synthesis and thereby contributes to modulation of pro- and anti-inflammatory cytokine expression, we focused on TAK1, a central TLR4 downstream kinase. TAK1 mRNA association with hnRNP K was found to decline upon macrophage activation by LPS. To identify potential hnRNP K binding sites, the untranslated regions of TAK1 mRNA were screened for the presence of hnRNP K binding motifs. Repeated 5′UC3-43′ motifs represent optimal interaction sites for the hnRNP K homology domain 3 of hnRNP K (Thisted et al. 2001; Messias et al. 2006). The TAK1 mRNA 3′ UTR (3782 nt) bears two sequence elements with such motifs (3′1, nucleotides 2381–2596 and 3′2, nucleotides 2837–3288) spaced by a sequence with two class I AU-rich elements (Gruber et al. 2010) (3′ARE, nucleotides 2587–2837) (Fig. 3A, upper panel).
FIGURE 3.

KH domain 3 of hnRNP K directly binds to the TAK1 mRNA 3′ UTR. (A) Upper panel: Schematic representation of a part of the TAK1 mRNA 3′ UTR; the repeated 5′UC3-43′ motifs and AREs are indicated by arrows. Lower panel: 14.5 fmol [32P]-labeled TAK1 mRNA 3′ UTR fragments 3′1 (lane 1), 3′2 (lane 2), the r15-LOX mRNA 3′ UTR DICE (lane 3), and 3′ARE (lane 4) were incubated with 7.2 pmol recombinant His-hnRNP K as indicated and subjected to UV-crosslinking. (B) 40 fmol [32P]-labeled TAK1 mRNA 3′ UTR fragments 3′1 (lane 1) and 3′2 (lane 2), or the r15-LOX mRNA 3′ UTR DICE (lane 3) were incubated with 7.2 pmol recombinant His-hnRNP K(Δ KH3) (lanes 1–3), as indicated. (C) 40 fmol [32P]-labeled TAK1 mRNA 3′ UTR fragments 3′1 (lane 1), 3′2 (lane 2), or the r15-LOX mRNA 3′ UTR DICE (lane 3) were incubated with 530 pmol recombinant His-KH3. (D) 40 fmol [32P]-labeled TAK1 mRNA 3′ UTR fragments 3′1 (lanes 1–5) and 3′2 (lanes 6–10) were incubated with 7.2 pmol His-hnRNP K (lanes 1–10) in the presence of a 50- or 200-fold molar excess of unlabeled competitor RNA DICE (lanes 2,3,7,8) or 3′ARE (lanes 4,5,9,10).
To characterize the direct hnRNP K-TAK1 mRNA 3′ UTR interaction sites, the sequence elements 3′1, 3′2, and 3′ARE were employed in in vitro UV-crosslinking assays. The reticulocyte 15-lipoxygenase (r15-LOX) mRNA 3′ UTR differentiation control element (DICE, 190 nt) that bears 5′UC3-43′ repeats and confers hnRNP K KH3 domain binding served as a specificity control (Ostareck et al. 1997; Messias et al. 2006; Naarmann-de Vries et al. 2013). Interaction of [32P]-labeled 3′1, 3′2, DICE, and 3′ARE with recombinant His-hnRNP K, His-hnRNP K lacking KH3 (His-hnRNP K[ΔKH3]), or His-KH3 was analyzed at equimolar amounts (Fig. 3A–C). His-hnRNP K (Fig. 3A, lanes 1–3) and His-KH3 (Fig. 3C, lanes 1–3), but not His-hnRNP K(ΔKH3) (Fig. 3B, lanes 1–3), were bound to [32P]-labeled 3′1, 3′2, and DICE. The lack of 3′ARE transcript interaction (Fig. 3A, lane 4) suggests that the TAK1 mRNA 3′ UTR 5′UC3-43′ motifs mediate the hnRNP K KH3 interaction.
To ascertain the impact of 5′UC3-43′ motifs on hnRNP K binding to transcripts 3′1 and 3′2, we tested whether the DICE outcompetes the interaction; the 3′ARE transcript served as nonspecific control (Fig. 3D). UV-crosslinking of His-hnRNP K to 3′1 and 3′2 was outcompeted by the DICE (Fig. 3D, lanes 1–3 and 6–8) but not by the 3′ARE (Fig. 3D, lanes 1,4,5, and 6,9,10). These results further support a direct hnRNP K - TAK1 mRNA 3′ UTR interaction.
TAK1 expression increases when hnRNP K is reduced in RAW 264.7 cells and BMDMs
Having shown that recombinant hnRNP K directly interacts with the TAK1 mRNA 3′ UTR, we next investigated whether endogenous hnRNP K functions as a cellular regulator of TAK1 mRNA translation in macrophages. For this purpose, we reduced hnRNP K expression by RNAi with two individual siRNAs (#1, #2). A nonrelated siRNA was used as a control (ctrl.) (Fig. 4). HnRNP K siRNA transfection of RAW 264.7 cells and BMDMs from untreated mice enhanced TAK1 protein expression as shown by immunofluorescence microscopy with a specific antibody (Fig. 4A). A strong increase of TAK1 protein could also be detected in cytoplasmic extracts of RAW 264.7 cells (Fig. 4B, left panel, lanes 3,4) and primary BMDMs (Fig. 4B, right panel, lanes 6,7) when hnRNP K was depleted by RNAi. To address the underlying mechanism, we first examined the TAK1 mRNA level in hnRNP K-depleted cells. The amount of TAK1 mRNA remained unchanged (Fig. 4C), indicating that induction of transcription or changes in mRNA stability did not account for the elevated TAK1 protein. Taken together, these results indicate that the increase in endogenous TAK1 protein at reduced hnRNP K level results from TAK1 mRNA translation activation.
FIGURE 4.

In noninduced RAW 264.7 cells, hnRNP K reduction results in enhanced TAK1 expression without affecting TAK1 mRNA levels. (A) RAW 264.7 cells (left panel), which were transfected with no siRNA (mock), a control siRNA (ctrl.), or two siRNAs directed against hnRNP K (#1, #2); and BMDMs (right panel), which were transfected with a control siRNA (ctrl.) or hnRNP K siRNA (#1) were analyzed by immunofluorescence microscopy with antibodies against hnRNP K (FITC-green) and TAK1 (Cy3-red). Cytoplasm was visualized by α-Tubulin-Cy5 and nuclei by DAPI staining. (B) Left panel: Western blot analysis of RAW 264.7 cells, which were transfected with no siRNA (mock), a control siRNA (ctrl.), or two siRNAs directed against hnRNP K (#1, #2). Right panel: Western blot analysis of BMDMs, which were transfected with a control siRNA (ctrl.) or two siRNAs directed against hnRNP K (#1, #2). Antibodies detecting hnRNP K, TAK1, and Vinculin were applied. (C) qPCR analysis of the RNA isolated from two independent transfection experiments designed as in B, left panel with specific primers against TAK1 mRNA. TAK1 mRNA was normalized to NDUFV1 mRNA and expressed as fold change compared to mock transfected cells.
Reduction of hnRNP K enhances endogenous TAK1 mRNA translation
To prove that endogenous TAK1 mRNA translation is up-regulated in RAW 264.7 cells when hnRNP K expression is reduced by RNAi, we characterized TAK1 mRNA cosedimentation with polysomes by sucrose gradient fractionation of cytoplasmic extracts prepared from cycloheximide-treated cells (Fig. 5).
FIGURE 5.

HnRNP K depletion enhances TAK1 mRNA translation in noninduced RAW 264.7 cells. (A) Inset: Western blot analysis of cytoplasmic extracts generated from noninduced RAW 264.7 cells which were transfected with control siRNA (ctrl.) or hnRNP K siRNA (#1) with hnRNP K- and Vinculin-specific antibodies. A representative A260nm profile of cytoplasmic extracts fractionated on 15%–45% sucrose density gradients is shown. Polysomes, 80S ribosomes, 60S and 40S ribosomal subunits and mRNPs are indicated. (B) RNA was extracted from gradient fractions. 18S rRNA (top panel) and 28S rRNA (middle panel) distribution in cytoplasmic extracts generated from cells transfected with ctrl. (circles, dashed line) or hnRNP K (#1) siRNA (squares, solid line) was analyzed by qPCR using the ΔCt-method and normalized to exogenously added luciferase (LUC) mRNA extraction control. The percentage of 18S and 28S rRNA in each fraction is shown. The distribution of rpS3 and eIF6 in the sucrose gradient fractions was determined by Western blotting (bottom panel). (C) Endogenous TAK1 mRNA distribution in cytoplasmic extracts generated from cells transfected with ctrl. (triangles, dashed line) or hnRNP K (#1) siRNA (squares, solid line) was determined as in B. The percentage of TAK1 mRNA in each fraction is shown. (D) Endogenous TAK1 mRNA, (E) NDUFV1 mRNA, and (F) COG7 mRNA distribution in pooled gradient fractions as indicated was determined as in B. The percentage of the mRNAs is shown.
Knock-down of hnRNP K was verified by Western blotting (Fig. 5A, inset). The A260 nm profiles of cytoplasmic extracts of control or hnRNP K knockdown cells showed no differences (Fig. 5A). To exclude that ribosome distribution to polysomes was affected at a level below recording resolution, we analyzed 18S and 28S rRNA distribution by qPCR. For both 18S and 28S rRNA, only minor differences were observed (Fig. 5B, top and middle panel). To monitor the position of ribosomal complexes and mRNPs, the distribution of the 40S subunit protein rpS3 and translation initiation factor eIF6 that is bound to the 60S subunit prior to 80S ribosome formation (Ceci et al. 2003) was detected in addition to 18S and 28S rRNA (Fig. 5B, bottom panel). 18S and 28S rRNA accumulated mainly in polysomal and 80S fractions, and 18S rRNA also in 40S subunit-containing fractions. RpS3 was enriched in 40S, 80S, and in polysomal fractions, while eIF6 specifically comigrated with 60S subunits (Fig. 5B). The endogenous TAK1 mRNA distribution analyzed by qPCR illustrates that hnRNP K knock-down resulted in a strong accumulation of TAK1 mRNA in heavy polysomal fractions (Fig. 5C), indicating that TAK1 mRNA translation is enhanced in vivo. Quantification of TAK1 mRNA in pooled fractions of heavy (1–6) and light polysomes (7–11) and monosomes (12–17), as well as mRNPs (18–19) highlights the shift of TAK1 mRNA from monosomes and light polysomes to heavy polysomes in hnRNP K-depleted cells (Fig. 5D). This is consistent with enhanced TAK1 protein upon hnRNP K knock-down (Fig. 4A,B). In contrast, translation of two control mRNAs, NDUFV1 and COG7, was only affected to a minor extent (Fig. 5E,F). These mRNAs did not interact with hnRNP K in the microarray analysis and were equally expressed in untreated and LPS-induced RAW 264.7 cells. These results clearly show that down-regulation of hnRNP K leads to enhanced translation of endogenous TAK1 mRNA, resulting in an elevated TAK1 protein level.
HnRNP K-depleted macrophages respond to LPS with prolonged p38 phosphorylation and enhanced cytokine mRNA synthesis
To address the cellular function of the hnRNP K-TAK1 mRNA complex, we investigated whether TAK1 up-regulation at reduced hnRNP K levels affects the activation and phosphorylation of downstream MAPKs ERK 1/2 and p38 and influences cytokine mRNA synthesis. For this purpose, we performed RNAi with control (Fig. 6A, lanes 1–8) or hnRNP K siRNA (Fig. 6A, lanes 9–16), followed by LPS induction for the times indicated (Fig. 6A, lanes 2–8 and 10–16).
FIGURE 6.

LPS treatment of hnRNP K-depleted RAW 264.7 cells led to elevated TAK1 protein, earlier and prolonged p38 phosphorylation, and enhanced cytokine mRNA synthesis. (A) Western blot analysis (representative example of three independent experiments) of lysates generated from noninduced and LPS-stimulated RAW 264.7 cells, which were transfected with a control siRNA (ctrl.) (lanes 1–8) or hnRNP K siRNA (#1) (lanes 9–16) with antibodies specific for hnRNP K, TAK1, ERK 1/2, phospho-ERK 1/2 (p-ERK 1/2), p38, phospho-p38 (p-p38), and Vinculin. (B) Endogenous TNF-α, IL-1β, and IL-10 mRNAs were determined by qPCR using the ΔΔCt-method and normalized to NDUFV1 mRNA.
A time-dependent induction of ERK and p38 phosphorylation was detected following control siRNA treatment (Fig. 6A, lanes 1–8). Interestingly, siRNA-mediated knock-down of hnRNP K led to an earlier and prolonged p38 phosphorylation but did not affect ERK 1/2 (Fig. 6A, cf. lanes 1–8 and 9–16). Importantly, synthesis of TNF-α, IL-1β, and IL-10 mRNAs increased after reduction of hnRNP K by RNAi (Fig. 6B).
LPS induction of hnRNP K-depleted cells leads to an earlier and extended phosphorylation of the TAK1 downstream kinase p38, compared to cells with a basal hnRNP K and TAK1 level. The resulting increase in cytokine mRNA expression suggests that hnRNP K is an important modulator of TAK1 mRNA translation that affects LPS-induced TLR4 downstream signaling and induction of cytokine mRNA expression.
HnRNP K tyrosine phosphorylation increases in activated macrophages
The level of hnRNP K does not decline in RAW 264.7 cells activated by LPS up to 6 h (Fig. 1C, left panel); therefore, we hypothesized that a change in RNA-binding activity abrogates hnRNP K-mediated repression of TAK1 mRNA translation. To address this question, we analyzed whether a LPS-induced post-translational modification contributes to this process. Previously, we have shown that hnRNP K phosphorylation by c-Src abolishes mRNA binding and its function in translation inhibition (Ostareck-Lederer et al. 2002; Messias et al. 2006). The analysis of c-Src expression in RAW 264.7 cells revealed that the level of c-Src mRNA increased following LPS induction (Fig. 7A). c-Src protein that could be detected after 30 min was strongly elevated after 4-h stimulation (Fig. 7B).
FIGURE 7.

HnRNP K interacts with c-Src and is tyrosine phosphorylated in LPS-induced RAW 264.7 cells. (A) RAW 264.7 cells were treated for 6 h with 10 ng/mL LPS, and synthesis of c-Src mRNA was monitored by RT-PCR. GAPDH mRNA served as a control. (B) Expression of c-Src and Vinculin was analyzed in Western blot assays. (C) Immunoprecipitation of hnRNP K with a specific antibody from cytoplasmic extracts of noninduced RAW 264.7 cells (lanes 1–3), after 4 h (lanes 4–6), or after 6 h (lanes 7–9) LPS treatment followed by Western blot assays. The level of immunoprecipitated protein was detected with an hnRNP K antibody (hnRNP K), the phosphorylated protein with an anti-phosphotyrosine antibody (p-Y-hnRNP K), and co-immunoprecipitated c-Src with the c-Src antibody. GAPDH served as a control.
To examine whether hnRNP K interacts with c-Src and is phosphorylated in LPS-induced cells, hnRNP K was immunoprecipitated from cytoplasmic extracts, and precipitated proteins were analyzed with c-Src- and phosphotyrosine-specific antibodies. Robust c-Src co-immunoprecipitation with hnRNP K could be confirmed after 4 h, and hnRNP K tyrosine phosphorylation was enhanced up to 6 h in LPS-induced cells (Fig. 7C, lanes 3,6,9). This result gives a first hint that c-Src-dependent phosphorylation might be involved in hnRNP K release from TAK1 mRNA.
DISCUSSION
We focused our study on the identification of new regulatory mRNPs that control the inflammation response in macrophages. For this purpose, we employed the murine macrophage cell line RAW 264.7 and primary BMDMs from C57BL/6 mice to induce TLR4 signaling by LPS. Following LPS induction, phosphorylation of MAPK p38 (Fig. 1A), pro- and anti-inflammatory cytokine mRNA synthesis (Fig. 1B), and expression of specific markers that characterize activated macrophages can be monitored (Fig. 1D). Through the use of RIP-Chip analysis, we provide evidence that hnRNP K, a regulator of mRNA translation in hematopoiesis (Ostareck-Lederer et al. 1994; Ostareck et al. 1997, 2001; Naarmann et al. 2008, 2010), differentially interacts with mRNAs encoding TLR4 downstream signaling molecules in cytoplasmic extracts of untreated and LPS-induced RAW 264.7 cells and BMDMs (Fig. 2; Table 1).
Earlier, we have shown that hnRNP K binds to the r15-LOX mRNA 3′ UTR DICE and silences r15-LOX mRNA translation in premature reticulocytes (Ostareck et al. 2001; Naarmann et al. 2008, 2010). Newly synthesized r15-LOX initiates mitochondria degradation in mature reticulocytes (Rapoport and Schewe 1986; van Leyen et al. 1998; Grullich et al. 2001; Naarmann et al. 2008). Abolishment of mRNA silencing requires coordinated post-translational modifications of hnRNP K in erythroid differentiation. HnRNP K activates c-Src (Ostareck-Lederer et al. 2002; Adolph et al. 2007), and c-Src-dependent tyrosine phosphorylation diminishes DICE binding activity of hnRNP K and consequently its function as inhibitor of mRNA translation (Messias et al. 2006). For several mRNAs, which are equally expressed in untreated and activated macrophages, a stronger enrichment on hnRNP K was determined in noninduced RAW 264.7 cells and BMDMs compared to cells induced with LPS for 6 h (Fig. 2D). These mRNAs encode proteins related to TLR4 signaling: IRAK4, TAK1, IRAK1BP1, ERC1, CARM1/PRMT4, PIK3CA, and AKT3. The kinases IRAK4 and TAK1 play an essential role in the MyD88-dependent TLR4 signaling pathway. For IRAK1BP1, an inhibitory function in inflammation was described (Conner et al. 2010). IкB kinase regulatory subunit ERC1 is required for NFкB activation (Ducut Sigala et al. 2004), and CARM1/PRMT4 has been shown to function as a promoter-specific NFкB regulator (Covic et al. 2005). In monocytes and macrophages, LPS is implicated in PIK3 and AKT pathway activation (Guha and Mackman 2002; Lee et al. 2007). In monocytes, a dependence of LPS-induced AKT activation on class IA of the three PIK3 classes (Cantley 2002) has been shown by RNAi-mediated PIK3CA silencing (Lee et al. 2007). In contrast, RIP-Chip experiments with untreated macrophages and after LPS-activation employing an antibody against TTP revealed that TTP modulates the inflammatory response by controlling the stability of mRNAs, which encode pro- and anti-inflammatory cytokines (Stoecklin et al. 2008; Kratochvill et al. 2011).
We focused the further analysis on TAK1 mRNA that encodes a central kinase in the TLR4 signaling pathway. Recently, it has been shown that AUF-1, which represents a family of four polypeptides (p37, p40, p42, and p45) (Wagner et al. 1998) interacts with the TAK1 mRNA. Specifically, p40 promotes TAK1 mRNA translation in monocytes (Sarkar et al. 2011). RNA-binding studies showed that AUF-1 interacts with AREs (DeMaria and Brewer 1996; DeMaria et al. 1997); consistently, hnRNP K did not interact with the 3′ARE element in the TAK1 mRNA 3′ UTR that contains two class I AREs in in vitro RNA binding assays (Fig. 3A). Instead, hnRNP K specifically interacts with extended 5′UC3-43′ motifs in 3′1 and 3′2 (Fig. 3A), in agreement with r15-LOX mRNA interaction studies (Ostareck-Lederer et al. 1994; Ostareck et al. 1997; Messias et al. 2006). hnRNP K interaction with TAK1 mRNA 3′ UTR elements 3′1 and 3′2 could be outcompeted by the r15-LOX mRNA DICE but not by the TAK1 mRNA 3′ARE (Fig. 3D), further indicating specific binding of hnRNP K to these sequence elements. Binding of hnRNP K to TAK1 mRNA 3′ UTR elements 3′1 and 3′2 occurs via KH3 (Fig. 3C), consistent with DICE interaction studies (Naarmann-de Vries et al. 2013), and deletion of KH3 abrogated the interaction (Fig. 3B).
Efficient siRNA-mediated reduction of hnRNP K expression in untreated macrophages did not affect the TAK1 mRNA level but resulted in an increase of TAK1 protein (Fig. 4). This is consistent with the finding that endogenous TAK1 mRNA accumulated in polysomal fractions, when hnRNP K was depleted from untreated macrophages by RNAi (Fig. 5A–D). Importantly, LPS-induction of macrophages with enhanced TAK1 protein expression resulted in an earlier and prolonged phosphorylation of p38 (Fig. 6A) and an increase of cytokine mRNA synthesis (Fig. 6B). An increase in TNF-α protein secretion supports the physiological relevance of this regulation (data not shown). This suggests that hnRNP K inhibits TAK1 mRNA translation in untreated macrophages, which contributes to the tight control of inflammatory cytokine expression.
How is TAK1 mRNA translation activated in LPS-induced macrophages? Since it has been shown for hnRNP K that c-Src-dependent tyrosine phosphorylation abrogates RNA-binding (Messias et al. 2006), we first tested whether c-Src is expressed in macrophages. We found that c-Src mRNA synthesis was detectable already in untreated RAW 264.7 cells (Fig. 7A) and c-Src protein after 30 min LPS induction (Fig. 7B). HnRNP K interacts with c-Src, and tyrosine phosphorylation strongly increases after LPS-induction (Fig. 7C). These data suggest that tyrosine phosphorylation of hnRNP K may lead to hnRNP K release from TAK1 mRNA, thereby allowing enhanced TAK1 mRNA translation in LPS-induced macrophages. Future studies will elucidate the timing and the mechanism by which hnRNP K regulates TAK1 mRNA translation. Our data indicate that translation control of TAK1 mRNA facilitates an enhanced synthesis of TAK1 protein through translational activation of the silenced mRNA, which boosts specific branches of the TLR4 signaling pathway. Targeting TAK1 expression and function has been proposed to bear the potential for new therapeutic options in the treatment of inflammatory diseases (Sakurai 2012). Understanding the mechanism of TAK1 mRNA translational control offers the interesting possibility to establish a strategy for the selective regulation of this central kinase in TLR4 signaling and other pathways that control innate immune response. The validation of other mRNAs which were identified as potential targets of hnRNP K-mediated control of protein synthesis will shed further light on the complex regulation of LPS-induced cellular immune response by this particular RNA-binding protein. To elucidate molecular mechanisms by which other RNA-binding proteins contribute to regulatory loops that control the inflammatory response, a global analysis of macrophage mRNPs by an interactome capture approach will be performed.
MATERIALS AND METHODS
Plasmid construction
Primers used for cloning are summarized in the Supplemental Material. For pBSIIKS-Luc-pA-NB, first the firefly luciferase ORF was PCR-amplified from pT3-Luc (Iizuka et al. 1994) and cloned blunt-end into SmaI-digested pBluescript II KS (+) (Stratagene). The resulting pBSIIKS-Luc was digested with ApaI and ligated with poly(A)98 resulting from BamHI/EcoRI-digested pT3-Luc-pA (Iizuka et al. 1994) after blunt ends were generated to yield pBSIIKS-Luc-pA. Additional restriction sites for linearization were added downstream from the poly(A) into the KpnI site. TAK1 3′ UTR fragments were PCR-amplified from RAW 264.7 total RNA and cloned blunt/XhoI into pBSIIKS-Luc-pA-NB. TAK1 3′ UTR fragments of resulting constructs were then subcloned by XmaI/XhoI digestion into pBluescript II KS (+) (Stratagene).
Cell culture and LPS treatment
RAW 264.7 cells (ATCC, TIB-71) were grown in DMEM supplemented with 10% heat-inactivated FBS, penicillin, and streptomycin. For conditioned medium, L929 cells (S. Burgdorf) were seeded (1.5 × 10⁶) on a 148-cm2 plate in RPMI-1640 supplemented with 10% heat-inactivated FBS, penicillin, and streptomycin. After 4 d incubation, supernatant was collected, filtered through a 0.22-μm filter, and stored at −20°C (Weischenfeldt and Porse 2008). For BMDMs, bones from C57BL/6 mice were extracted, and bone marrow cells were collected by flushing with RPMI 1640 supplemented with 10% heat-inactivated FBS, penicillin, streptomycin, and 30% conditioned L929 medium. For LPS treatment, 10 ng/mL (RAW 264.7) or 80 ng/mL (BMDMs) Escherichia coli LPS (serotype 0111:B4, Sigma-Aldrich) was added to the medium.
Lysate preparation
Total cell lysate preparation was performed according to Ostareck-Lederer et al. (2002).
Cytoplasmic extract preparation
RAW 264.7 cell extract was prepared as in Barton and Flanegan (1993). Cells were harvested by scraping, washed with ice-cold isotonic buffer (35 mM Hepes/KOH pH 7.6, 146 mM NaCl, 11 mM glucose), and collected by centrifugation (4°C, 5 min, 300g). The pellet was resuspended in an equal volume of hypotonic buffer (10 mM Hepes/KOH pH 7.6, 10 mM KCH3CO2, 0.5 mM Mg[CH3CO2]2, 5 mM DTT) with protease inhibitors (Roche), and incubated for 15 min on ice. Cells were broken by using a glass Dounce homogenizer or expelling through a 26-gauge needle, and nuclei were removed by centrifugation (20,000g, 10 min, 4°C).
In vitro transcription
RNA for the competition experiment and for extraction control was transcribed with the T3 and T7 MEGAscript Kit (Applied Biosystems).
Polysome analysis
Sucrose gradient centrifugation was carried out as described in de Vries et al. (2013).
RNA preparation and quantitative real-time PCR
Total RNA was prepared using Trizol. Fifty picograms luciferase RNA per reaction was added prior to extraction. For reverse transcription, random primers and M-MLV RT (Promega) were used (Naarmann et al. 2008). qPCR was performed with SYBRGreen (Sigma-Aldrich) and PCR Master Mix (Promega) on a 7300 Real Time PCR System or Power SYBRGreen PCR Master Mix on a StepOnePlus (all Applied Biosystems). Primers are summarized in the Supplemental Material. For mRNA analysis in sucrose gradients, RNA was prepared from 300 µL of individual fractions, and equal volumes were used in qPCR. For analysis of endogenous 18S and 28S rRNAs and mRNA, equal RNA amounts were analyzed by qPCR. Amounts of rRNA and mRNA were determined by the ΔΔCt method (Livak and Schmittgen 2001), normalized for luciferase RNA (Fig. 5B–F), or endogenous NDUFV1 mRNA (Figs. 4C, 6B), NDUFV1, DOCK10, COG7, TRP53BP2, and MYO10 mRNAs (Fig. 2D, left panel), or TRP53BP2 and MYO10 mRNAs (Fig. 2D, right panel). For detection of mRNAs in Figures 1B, 2B, and 7A, total RNA was first treated with RQ1 DNase (Promega) according to the manufacturer's protocol. For reverse transcription, random primers and M-MLV RT (Promega) were used (Naarmann et al. 2008). RT-PCR was then performed with GoTaq Flexi DNA Polymerase (Promega) according to the manufacturer's protocol, and PCR products were analyzed on GelRed-stained (Biotium) 2% agarose gels.
Antibodies
Antibodies were purchased from Abcam (c-Src, GAPDH), AbD Serotec (F4/80), BD Biosciences (eIF6, CD14, CD40, CD80, CD86), Cell Signaling (ERK 1/2, p-ERK 1/2, p-p38), eBioscience (CD11b), Imgenex (TAK1), Santa Cruz (hnRNP K, p38, rpS3, firefly luciferase, phosphotyrosine), Sigma-Aldrich (α-tubulin, Vinculin), and GE Healthcare Life Sciences (HRP-conjugated antibodies). Monoclonal hnRNP K antibody (Figs. 4A, 7C) is described in Naarmann et al. (2008).
Immunocytochemistry
Immunofluorescence staining was essentially performed as described by Naarmann et al. (2008). Microscopy was performed with an Apotome 2; images were acquired with AxioVision (both Zeiss).
FACS
Cells were harvested by scraping and resuspended in FACS staining buffer (0.9% normal mouse serum, 0.9% normal rabbit serum, 0.9% normal human serum [all Sigma-Aldrich], 3% BSA, 2 mM EDTA in PBS). After antibody staining and washing, cells were resuspended in PBS with Hoechst (BD Biosciences). Counting was performed using a FACSCanto-II (BD Biosciences), and data were analyzed with FlowJo software (TreeStar) by gating on F4/80 and CD11b positive cells.
Immunoblot analysis
Western blot assays were performed as described previously (Naarmann et al. 2010) and analyzed on a LAS-4000 system (GE Healthcare Life Sciences).
Immunoprecipitation
Immunoprecipitation was performed as described (Naarmann et al. 2010), except that for control precipitation, an anti-firefly luciferase antibody was used.
Microarrays
After immunoprecipitation, coprecipitating RNA was isolated with Trizol and processed for analysis on GeneChipMouse Genome 430 2.0 arrays (Affymetrix) according to the manufacturer's protocol. Data were analyzed using ArrayStar (DNAStar). All array data are MIAME compliant.
RNAi
For RNAi, RAW 264.7 cells (1 × 10⁶ cells in DMEM without FBS and antibiotics) were transfected by electroporation at 0.36 kV and 500 µF (GenePulser II, BioRad) with 500 pmol siRNA (MWG) against hnRNP K or a nonspecific control (Naarmann et al. 2008), and cells were harvested 24 h post-transfection. BMDMs (in RPMI-1640 without FBS and antibiotics) were transfected at 0.36 kV and 100 µF and harvested 48 h post-transfection.
Expression of recombinant hnRNP K
His-hnRNP K, His-hnRNP K(Δ KH3), and His-KH3 were expressed and purified as described in Naarmann-de Vries et al. (2013).
UV-crosslinking
UV-crosslinking assays were performed as described previously (Ostareck-Lederer et al. 1994).
DATA DEPOSITION
The microarray raw data have been deposited in Gene Expression Omnibus (GEO) under accession no. GSE48463.
SUPPLEMENTAL MATERIAL
Supplemental Material is available for this article and provides tables listing oligonucleotide sequences and the corresponding references.
ACKNOWLEDGMENTS
We thank Nadine Simons for technical assistance, Isabel Naarmann-de Vries for initial cloning and acquisition of microscopy images, and Sven Burgdorf (LIMES Institute, Bonn) for L929 cells. The work was supported by a UK Aachen START Programme grant to J.C.M. and A.O.-L. A.O.-L. acknowledges a Heisenberg Fellowship of the Deutsche Forschungsgemeinschaft (DFG) (OS290/1-2). A.O.-L. and D.H.O. acknowledge DFG grant (OS 290/3-2).
Author contributions: A.L. and J.C.M. made substantial equal contributions to acquisition, analysis, and interpretation of data, as described in detail: A.L. performed experiments in RAW 264.7 cells shown in Figures 1A–C (left panels), 2A–D (left panel), 3A–D, 4A (left panel), 4B (left panel), 4C, 5A–F, 6A,B, and 7A–C. J.C.M. did the studies in BMDM shown in Figures 1A–C (right panels), 2D (right panel), 4A (right panel), and 4B (right panel). B.D. executed and analyzed the microarray experiments. F.H. and F.T. performed the FACS analyses. R.D.S. contributed to the qPCR measurements depicted in Figure 5, B and F, and the Western blot shown in Figure 7B. G.M. made substantial contributions to the conceptual design of the project. D.H.O. and A.O.-L. designed the experiments, analyzed the data, and wrote the manuscript. All authors critically read the manuscript and gave their final approval of the version to be submitted.
Footnotes
Article published online ahead of print. Article and publication date are at http://www.rnajournal.org/cgi/doi/10.1261/rna.042788.113.
REFERENCES
- Adolph D, Flach N, Mueller K, Ostareck DH, Ostareck-Lederer A 2007. Deciphering the cross talk between hnRNP K and c-Src: The c-Src activation domain in hnRNP K is distinct from a second interaction site. Mol Cell Biol 27: 1758–1770 [DOI] [PMC free article] [PubMed] [Google Scholar]
- Anderson P 2008. Post-transcriptional control of cytokine production. Nat Immunol 9: 353–359 [DOI] [PubMed] [Google Scholar]
- Barton DJ, Flanegan JB 1993. Coupled translation and replication of poliovirus RNA in vitro: synthesis of functional 3D polymerase and infectious virus. J Virol 67: 822–831 [DOI] [PMC free article] [PubMed] [Google Scholar]
- Cantley LC 2002. The phosphoinositide 3-kinase pathway. Science 296: 1655–1657 [DOI] [PubMed] [Google Scholar]
- Ceci M, Gaviraghi C, Gorrini C, Sala LA, Offenhauser N, Marchisio PC, Biffo S 2003. Release of eIF6 (p27BBP) from the 60S subunit allows 80S ribosome assembly. Nature 426: 579–584 [DOI] [PubMed] [Google Scholar]
- Ceppi M, Pereira PM, Dunand-Sauthier I, Barras E, Reith W, Santos MA, Pierre P 2009. MicroRNA-155 modulates the interleukin-1 signaling pathway in activated human monocyte-derived dendritic cells. Proc Natl Acad Sci 106: 2735–2740 [DOI] [PMC free article] [PubMed] [Google Scholar]
- Clark A, Dean J, Tudor C, Saklatvala J 2009. Post-transcriptional gene regulation by MAP kinases via AU-rich elements. Front Biosci 14: 847–871 [DOI] [PubMed] [Google Scholar]
- Conner JR, Smirnova II, Moseman AP, Poltorak A 2010. IRAK1BP1 inhibits inflammation by promoting nuclear translocation of NF-κB p50. Proc Natl Acad Sci 107: 11477–11482 [DOI] [PMC free article] [PubMed] [Google Scholar]
- Covic M, Hassa PO, Saccani S, Buerki C, Meier NI, Lombardi C, Imhof R, Bedford MT, Natoli G, Hottiger MO 2005. Arginine methyltransferase CARM1 is a promoter-specific regulator of NF-κB-dependent gene expression. EMBO J 24: 85–96 [DOI] [PMC free article] [PubMed] [Google Scholar]
- D'Anto V, Eckhardt A, Hiller KA, Spagnuolo G, Valletta R, Ambrosio L, Schmalz G, Schweikl H 2009. The influence of Ni(II) on surface antigen expression in murine macrophages. Biomaterials 30: 1492–1501 [DOI] [PubMed] [Google Scholar]
- de Vries S, Naarmann-de Vries IS, Urlaub H, Lue H, Bernhagen J, Ostareck DH, Ostareck-Lederer A 2013. Identification of DEAD-box RNA helicase 6 (DDX6) as a cellular modulator of vascular endothelial growth factor expression under hypoxia. J Biol Chem 288: 5815–5827 [DOI] [PMC free article] [PubMed] [Google Scholar]
- DeMaria CT, Brewer G 1996. AUF1 binding affinity to A+U-rich elements correlates with rapid mRNA degradation. J Biol Chem 271: 12179–12184 [DOI] [PubMed] [Google Scholar]
- DeMaria CT, Sun Y, Long L, Wagner BJ, Brewer G 1997. Structural determinants in AUF1 required for high affinity binding to A + U-rich elements. J Biol Chem 272: 27635–27643 [DOI] [PubMed] [Google Scholar]
- Ducut Sigala JL, Bottero V, Young DB, Shevchenko A, Mercurio F, Verma IM 2004. Activation of transcription factor NF-κB requires ELKS, an IκB kinase regulatory subunit. Science 304: 1963–1967 [DOI] [PubMed] [Google Scholar]
- Gan L, Li L 2006. Regulations and roles of the interleukin-1 receptor associated kinases (IRAKs) in innate and adaptive immunity. Immunol Res 35: 295–302 [DOI] [PubMed] [Google Scholar]
- Gruber AR, Fallmann J, Kratochvill F, Kovarik P, Hofacker IL 2010. AREsite: a database for the comprehensive investigation of AU-rich elements. Nucleic Acids Res 39(Database issue): D66–D69 [DOI] [PMC free article] [PubMed] [Google Scholar]
- Grullich C, Duvoisin RM, Wiedmann M, van Leyen K 2001. Inhibition of 15-lipoxygenase leads to delayed organelle degradation in the reticulocyte. FEBS Lett 489: 51–54 [DOI] [PubMed] [Google Scholar]
- Guha M, Mackman N 2001. LPS induction of gene expression in human monocytes. Cell Signal 13: 85–94 [DOI] [PubMed] [Google Scholar]
- Guha M, Mackman N 2002. The phosphatidylinositol 3-kinase-Akt pathway limits lipopolysaccharide activation of signaling pathways and expression of inflammatory mediators in human monocytic cells. J Biol Chem 277: 32124–32132 [DOI] [PubMed] [Google Scholar]
- Hitti E, Iakovleva T, Brook M, Deppenmeier S, Gruber AD, Radzioch D, Clark AR, Blackshear PJ, Kotlyarov A, Gaestel M 2006. Mitogen-activated protein kinase-activated protein kinase 2 regulates tumor necrosis factor mRNA stability and translation mainly by altering tristetraprolin expression, stability, and binding to adenine/uridine-rich element. Mol Cell Biol 26: 2399–2407 [DOI] [PMC free article] [PubMed] [Google Scholar]
- Honda K, Taniguchi T 2006. IRFs: master regulators of signalling by Toll-like receptors and cytosolic pattern-recognition receptors. Nat Rev Immunol 6: 644–658 [DOI] [PubMed] [Google Scholar]
- Iizuka N, Najita L, Franzusoff A, Sarnow P 1994. Cap-dependent and cap-independent translation by internal initiation of mRNAs in cell extracts prepared from Saccharomyces cerevisiae. Mol Cell Biol 14: 7322–7330 [DOI] [PMC free article] [PubMed] [Google Scholar]
- Inoue J, Gohda J, Akiyama T 2007. Characteristics and biological functions of TRAF6. Adv Exp Med Biol 597: 72–79 [DOI] [PubMed] [Google Scholar]
- Janssens S, Beyaert R 2002. A universal role for MyD88 in TLR/IL-1R-mediated signaling. Trends Biochem Sci 27: 474–482 [DOI] [PubMed] [Google Scholar]
- Kim TW, Staschke K, Bulek K, Yao J, Peters K, Oh KH, Vandenburg Y, Xiao H, Qian W, Hamilton T, et al. 2007. A critical role for IRAK4 kinase activity in Toll-like receptor-mediated innate immunity. J Exp Med 204: 1025–1036 [DOI] [PMC free article] [PubMed] [Google Scholar]
- Kratochvill F, Machacek C, Vogl C, Ebner F, Sedlyarov V, Gruber AR, Hartweger H, Vielnascher R, Karaghiosoff M, Rulicke T, et al. 2011. Tristetraprolin-driven regulatory circuit controls quality and timing of mRNA decay in inflammation. Mol Syst Biol 7: 560. [DOI] [PMC free article] [PubMed] [Google Scholar]
- Lee JS, Nauseef WM, Moeenrezakhanlou A, Sly LM, Noubir S, Leidal KG, Schlomann JM, Krystal G, Reiner NE 2007. Monocyte p110α phosphatidylinositol 3-kinase regulates phagocytosis, the phagocyte oxidase, and cytokine production. J Leukoc Biol 81: 1548–1561 [DOI] [PubMed] [Google Scholar]
- Livak KJ, Schmittgen TD 2001. Analysis of relative gene expression data using real-time quantitative PCR and the 2−ΔΔCT method. Methods 25: 402–408 [DOI] [PubMed] [Google Scholar]
- Messias AC, Harnisch C, Ostareck-Lederer A, Sattler M, Ostareck DH 2006. The DICE-binding activity of KH domain 3 of hnRNP K is affected by c-Src-mediated tyrosine phosphorylation. J Mol Biol 361: 470–481 [DOI] [PubMed] [Google Scholar]
- Miyake K 2006. Roles for accessory molecules in microbial recognition by Toll-like receptors. J Endotoxin Res 12: 195–204 [DOI] [PubMed] [Google Scholar]
- Naarmann IS, Harnisch C, Flach N, Kremmer E, Kuhn H, Ostareck DH, Ostareck-Lederer A 2008. mRNA silencing in human erythroid cell maturation: heterogeneous nuclear ribonucleoprotein K controls the expression of its regulator c-Src. J Biol Chem 283: 18461–18472 [DOI] [PubMed] [Google Scholar]
- Naarmann IS, Harnisch C, Muller-Newen G, Urlaub H, Ostareck-Lederer A, Ostareck DH 2010. DDX6 recruits translational silenced human reticulocyte 15-lipoxygenase mRNA to RNP granules. RNA 16: 2189–2204 [DOI] [PMC free article] [PubMed] [Google Scholar]
- Naarmann-de Vries IS, Urlaub H, Ostareck DH, Ostareck-Lederer A 2013. Caspase-3 cleaves hnRNP K in erythroid differentiation. Cell Death Dis 4: e548. [DOI] [PMC free article] [PubMed] [Google Scholar]
- O'Neill LA 2006. How Toll-like receptors signal: what we know and what we don't know. Curr Opin Immunol 18: 3–9 [DOI] [PubMed] [Google Scholar]
- Ostareck DH, Ostareck-Lederer A, Wilm M, Thiele BJ, Mann M, Hentze MW 1997. mRNA silencing in erythroid differentiation: hnRNP K and hnRNP E1 regulate 15-lipoxygenase translation from the 3′ end. Cell 89: 597–606 [DOI] [PubMed] [Google Scholar]
- Ostareck DH, Ostareck-Lederer A, Shatsky IN, Hentze MW 2001. Lipoxygenase mRNA silencing in erythroid differentiation: the 3′UTR regulatory complex controls 60S ribosomal subunit joining. Cell 104: 281–290 [DOI] [PubMed] [Google Scholar]
- Ostareck-Lederer A, Ostareck DH 2012. Precision mechanics with multifunctional tools: how hnRNP K and hnRNPs E1/E2 contribute to post-transcriptional control of gene expression in hematopoiesis. Curr Protein Pept Sci 13: 391–400 [DOI] [PubMed] [Google Scholar]
- Ostareck-Lederer A, Ostareck DH, Standart N, Thiele BJ 1994. Translation of 15-lipoxygenase mRNA is inhibited by a protein that binds to a repeated sequence in the 3′ untranslated region. EMBO J 13: 1476–1481 [DOI] [PMC free article] [PubMed] [Google Scholar]
- Ostareck-Lederer A, Ostareck DH, Cans C, Neubauer G, Bomsztyk K, Superti-Furga G, Hentze MW 2002. c-Src-mediated phosphorylation of hnRNP K drives translational activation of specifically silenced mRNAs. Mol Cell Biol 22: 4535–4543 [DOI] [PMC free article] [PubMed] [Google Scholar]
- Park BS, Song DH, Kim HM, Choi BS, Lee H, Lee JO 2009. The structural basis of lipopolysaccharide recognition by the TLR4-MD-2 complex. Nature 458: 1191–1195 [DOI] [PubMed] [Google Scholar]
- Rapoport SM, Schewe T 1986. The maturational breakdown of mitochondria in reticulocytes. Biochim Biophys Acta 864: 471–495 [DOI] [PubMed] [Google Scholar]
- Reynier F, de Vos AF, Hoogerwerf JJ, Bresser P, van der Zee JS, Paye M, Pachot A, Mougin B, van der Poll T 2012. Gene expression profiles in alveolar macrophages induced by lipopolysaccharide in humans. Mol Med 18: 1303–1311 [DOI] [PMC free article] [PubMed] [Google Scholar]
- Rutledge HR, Jiang W, Yang J, Warg LA, Schwartz DA, Pisetsky DS, Yang IV 2011. Gene expression profiles of RAW264.7 macrophages stimulated with preparations of LPS differing in isolation and purity. Innate Immun 18: 80–88 [DOI] [PubMed] [Google Scholar]
- Sakurai H 2012. Targeting of TAK1 in inflammatory disorders and cancer. Trends Pharmacol Sci 33: 522–530 [DOI] [PubMed] [Google Scholar]
- Sarkar S, Han J, Sinsimer KS, Liao B, Foster RL, Brewer G, Pestka S 2011. RNA-binding protein AUF1 regulates lipopolysaccharide-induced IL10 expression by activating IκB kinase complex in monocytes. Mol Cell Biol 31: 602–615 [DOI] [PMC free article] [PubMed] [Google Scholar]
- Shanmugam N, Reddy MA, Natarajan R 2008. Distinct roles of heterogeneous nuclear ribonuclear protein K and microRNA-16 in cyclooxygenase-2 RNA stability induced by S100b, a ligand of the receptor for advanced glycation end products. J Biol Chem 283: 36221–36233 [DOI] [PMC free article] [PubMed] [Google Scholar]
- Shimazu R, Akashi S, Ogata H, Nagai Y, Fukudome K, Miyake K, Kimoto M 1999. MD-2, a molecule that confers lipopolysaccharide responsiveness on Toll-like receptor 4. J Exp Med 189: 1777–1782 [DOI] [PMC free article] [PubMed] [Google Scholar]
- Stoecklin G, Tenenbaum SA, Mayo T, Chittur SV, George AD, Baroni TE, Blackshear PJ, Anderson P 2008. Genome-wide analysis identifies interleukin-10 mRNA as target of tristetraprolin. J Biol Chem 283: 11689–11699 [DOI] [PMC free article] [PubMed] [Google Scholar]
- Tacke F, Randolph GJ 2006. Migratory fate and differentiation of blood monocyte subsets. Immunobiology 211: 609–618 [DOI] [PubMed] [Google Scholar]
- Taganov KD, Boldin MP, Chang KJ, Baltimore D 2006. NF-κB-dependent induction of microRNA miR-146, an inhibitor targeted to signaling proteins of innate immune responses. Proc Natl Acad Sci 103: 12481–12486 [DOI] [PMC free article] [PubMed] [Google Scholar]
- Thisted T, Lyakhov DL, Liebhaber SA 2001. Optimized RNA targets of two closely related triple KH domain proteins, heterogeneous nuclear ribonucleoprotein K and αCP-2KL, suggest distinct modes of RNA recognition. J Biol Chem 276: 17484–17496 [DOI] [PubMed] [Google Scholar]
- Thomas PD, Campbell MJ, Kejariwal A, Mi H, Karlak B, Daverman R, Diemer K, Muruganujan A, Narechania A 2003. PANTHER: a library of protein families and subfamilies indexed by function. Genome Res 13: 2129–2141 [DOI] [PMC free article] [PubMed] [Google Scholar]
- Tiedje C, Kotlyarov A, Gaestel M 2010. Molecular mechanisms of phosphorylation-regulated TTP (tristetraprolin) action and screening for further TTP-interacting proteins. Biochem Soc Trans 38: 1632–1637 [DOI] [PubMed] [Google Scholar]
- Tiedje C, Ronkina N, Tehrani M, Dhamija S, Laass K, Holtmann H, Kotlyarov A, Gaestel M 2012. The p38/MK2-driven exchange between tristetraprolin and HuR regulates AU–rich element–dependent translation. PLoS Genet 8: e1002977. [DOI] [PMC free article] [PubMed] [Google Scholar]
- Ulloa L, Tracey KJ 2005. The “cytokine profile”: a code for sepsis. Trends Mol Med 11: 56–63 [DOI] [PubMed] [Google Scholar]
- van Leyen K, Duvoisin RM, Engelhardt H, Wiedmann M 1998. A function for lipoxygenase in programmed organelle degradation. Nature 395: 392–395 [DOI] [PubMed] [Google Scholar]
- Wagner BJ, DeMaria CT, Sun Y, Wilson GM, Brewer G 1998. Structure and genomic organization of the human AUF1 gene: alternative pre-mRNA splicing generates four protein isoforms. Genomics 48: 195–202 [DOI] [PubMed] [Google Scholar]
- Wang C, Deng L, Hong M, Akkaraju GR, Inoue J, Chen ZJ 2001. TAK1 is a ubiquitin-dependent kinase of MKK and IKK. Nature 412: 346–351 [DOI] [PubMed] [Google Scholar]
- Weischenfeldt J, Porse B 2008. Bone marrow-derived macrophages (BMM): isolation and applications. CSH Protoc 2008: pdb prot5080 [DOI] [PubMed] [Google Scholar]
- Wilusz CJ, Wormington M, Peltz SW 2001. The cap-to-tail guide to mRNA turnover. Nat Rev Mol Cell Biol 2: 237–246 [DOI] [PubMed] [Google Scholar]
- Winzen R, Thakur BK, Dittrich-Breiholz O, Shah M, Redich N, Dhamija S, Kracht M, Holtmann H 2007. Functional analysis of KSRP interaction with the AU-rich element of interleukin-8 and identification of inflammatory mRNA targets. Mol Cell Biol 27: 8388–8400 [DOI] [PMC free article] [PubMed] [Google Scholar]
- Yamamoto M, Sato S, Hemmi H, Hoshino K, Kaisho T, Sanjo H, Takeuchi O, Sugiyama M, Okabe M, Takeda K, et al. 2003. Role of adaptor TRIF in the MyD88-independent toll-like receptor signaling pathway. Science 301: 640–643 [DOI] [PubMed] [Google Scholar]