

Abstract
Aims: The discovery of methionine metabolism enzymes in the cell nucleus, together with their association with key nuclear processes, suggested a putative relationship between alterations in their subcellular distribution and disease. Results: Using the rat model of d-galactosamine intoxication, severe changes in hepatic steady-state mRNA levels were found; the largest decreases corresponded to enzymes exhibiting the highest expression in normal tissue. Cytoplasmic protein levels, activities, and metabolite concentrations suffered more moderate changes following a similar trend. Interestingly, galactosamine treatment induced hepatic nuclear accumulation of methionine adenosyltransferase (MAT) α1 and S-adenosylhomocysteine hydrolase tetramers, their active assemblies. In fact, galactosamine-treated livers showed enhanced nuclear MAT activity. Acetaminophen (APAP) intoxication mimicked most galactosamine effects on hepatic MATα1, including accumulation of nuclear tetramers. H35 cells that overexpress tagged-MATα1 reproduced the subcellular distribution observed in liver, and the changes induced by galactosamine and APAP that were also observed upon glutathione depletion by buthionine sulfoximine. The H35 nuclear accumulation of tagged-MATα1 induced by these agents correlated with decreased glutathione reduced form/glutathione oxidized form ratios and was prevented by N-acetylcysteine (NAC) and glutathione ethyl ester. However, the changes in epigenetic modifications associated with tagged-MATα1 nuclear accumulation were only prevented by NAC in galactosamine-treated cells. Innovation: Cytoplasmic and nuclear changes in proteins that regulate the methylation index follow opposite trends in acute liver injury, their nuclear accumulation showing potential as disease marker. Conclusion: Altogether these results demonstrate galactosamine- and APAP-induced nuclear accumulation of methionine metabolism enzymes as active oligomers and unveil the implication of redox-dependent mechanisms in the control of MATα1 subcellular distribution. Antioxid. Redox Signal. 20, 2541–2554.
Introduction
Methionine is an essential amino acid that is mainly metabolized in the liver for protein and S-adenosylmethionine (AdoMet or SAM) synthesis. Reductions in AdoMet levels occur in a multitude of pathologies that include from cancer to acute liver failure (31, 37, 45). Three methyltransferases, among them glycine N-methyltransferase (GNMT), account for most of hepatic AdoMet consumption (32, 39). Methylations generate S-adenosylhomocysteine (AdoHcy), a potent inhibitor of many methyltransferases (9); the AdoMet/AdoHcy ratio (methylation index) determines the flow through these reactions (45). Methionine adenosyltransferases (MATs) are the only known enzymes that catalyze AdoMet synthesis using methionine and ATP in the first, and rate-limiting, reaction of the methionine cycle (45). AdoMet is used primarily for transmethylation reactions, but it is also used by SAM radical proteins and after decarboxylation for polyamine biosynthesis (37, 45). S-adenosylhomocysteine hydrolase (SAHH) eliminates AdoHcy in a reversible reaction that favors its synthesis, unless homocysteine (Hcy) and adenosine are effectively removed. Hcy can be remethylated to methionine by methionine synthase (MTR) or betaine homocysteine methyltransferase (BHMT) and transported into the blood or enter the trans-sulfuration pathway (46). This last pathway connects methionine metabolism with cysteine and glutathione production, and hence with redox control.
Innovation.
The relationship between changes in subcellular localization of methionine metabolism enzymes and disease was analyzed in acute liver injury. The results demonstrate that S-adenosylmethionine (AdoMet) homeostasis is compromised due to a variety of processes, including from changes in expression to altered subcellular distribution of key proteins that control the AdoMet/S-adenosylhomocysteine (AdoHcy) ratio. Remodeling of methylation-based epigenetic modifications is fulfilled by nuclear accumulation of methionine adenosyltransferase I and AdoHcy hydrolase. Glutathione levels regulate subcellular distribution of these enzymes, effects that are prevented by N-acetylcysteine. These alterations in nucleocytoplasmic localization show a potential as markers of disease.
Regulation of the methionine cycle is complicated by the existence of several isoenzymes (MAT I, II, and III); the action is exerted by several metabolites (AdoMet and AdoHcy) and the existence of homo- (i.e., MAT I and III, and BHMT) and hetero-oligomers (MAT II) (45, 46). Different regulatory mechanisms contribute to determine the final outcome; they involve (i) hormones that act primarily at the transcriptional level (18); (ii) metabolites that activate or inhibit several steps (e.g., AdoMet); (iii) related metabolites that modulate expression (e.g., methylthioadenosine), activity, and oligomerization (e.g., glutathione and NADP+) (12, 20, 44).
Many studies have been focused on analyzing the changes in expression, protein levels, and activity of MAT isoenzymes and their relationship with disease. Among them, rat models of galactosamine and CCl4 intoxication in combination with biopsies of human cirrhotic livers showed decreased MAT activity and reductions in the MAT I (tetramer of α1) to MAT III (dimer of α1) activity ratio (7, 11). Additional studies demonstrated an expression switch from MAT1A (encoding α1 subunits) to MAT2A (encoding α2 subunits of MAT II) in hepatoma, resembling the fetal expression pattern (17). These changes decreased AdoMet concentrations, given the differences in Vmax and methionine affinity of the isoenzymes (33, 45). The importance of AdoMet levels in liver disease was further demonstrated when mice that exhibit low (MAT1A−/−) and high (GNMT−/−) hepatic AdoMet levels were produced (30, 35). These mice developed hepatocellular carcinoma spontaneously, highlighting the necessity of a strict control of AdoMet homeostasis for normal liver function.
Recently, nuclear localization of some methionine cycle enzymes was reported. Nuclear MATα1 accumulation correlated with increased histone 3 K27 trimethylation (me3K27H3), an epigenetic modification that was related to gene repression (50). Nuclear MATα2 has been found to act as a MafK corepressor and to interact with histone 3 K9 and K4 dimethylating enzymes (26), and nuclear SAHH was related to efficient RNA cap methylation (49). However, the mechanisms that regulate subcellular distribution of these proteins and their relationship with disease remain unknown. For this purpose, we have used models of acute liver injury as suitable experimental settings and found nuclear accumulation of methionine metabolism enzymes, together with the implication of a redox-dependent mechanism in the process. Altogether the results presented sustain the novel paradigm of gene expression regulation through the nuclear shuttling of enzymes controlling the methylation index.
Results
The rat model of d-galactosamine intoxication has been previously used to analyze changes in AdoMet production in hepatopathy, by measuring cytosolic MAT activity and AdoMet levels (7, 58). We reproduced this model in search of a putative link among disease and nucleocytoplasmic distribution of methionine cycle enzymes. No changes in liver weight, but striking differences in histology, between animals included in control and galactosamine groups were found (Supplementary Fig. S1; Supplementary Data are available online at www.liebertpub.com/ars). Control livers had normal appearance in hematoxylin/eosin staining, whereas galactosamine-treated animals showed intrasinusal lymphocytes, signs of steatosis, and small focuses of necrosis. Galactosamine also induced a dramatic increase in serum transaminases, together with a significant reduction in hepatic AdoMet levels and total MAT activity (Supplementary Tables S1 and S2). Analytical gel filtration chromatography (AGFC) showed a larger decline in MAT I activity than in MAT III activity, thus changing the MAT III/I ratio (Supplementary Fig. S2A, C and Supplementary Table S1). Livers showed the expected signs of hepatopathy and the previously reported changes; hence, the treatment was effective.
The model was further characterized by polymerase chain reaction (PCR) analysis of steady-state mRNA levels of the methionine cycle enzymes, using the 18S gene as reference (Fig. 1A). Severe reductions (70%–80%) in MAT1A, BHMT, and GNMT transcripts were detected upon galactosamine treatment, whereas mRNA levels for the rest of the enzymes increased; the largest changes corresponded to MAT2A (500%) and MAT2B (250%) transcripts, while more moderate elevations (∼150%–200%) were detected for MTR and SAHH. Therefore, a MAT1A to MAT2A expression switch was clearly visible after 48 h of treatment; the relative expression levels of both transcripts became similar (Fig. 1B). Additionally, galactosamine induced the expression of both γ-glutamylcysteine synthetase (GCL) subunits, modifier (GCLm) and ligase (GCLl), by 350% (Fig. 1A).
FIG. 1.
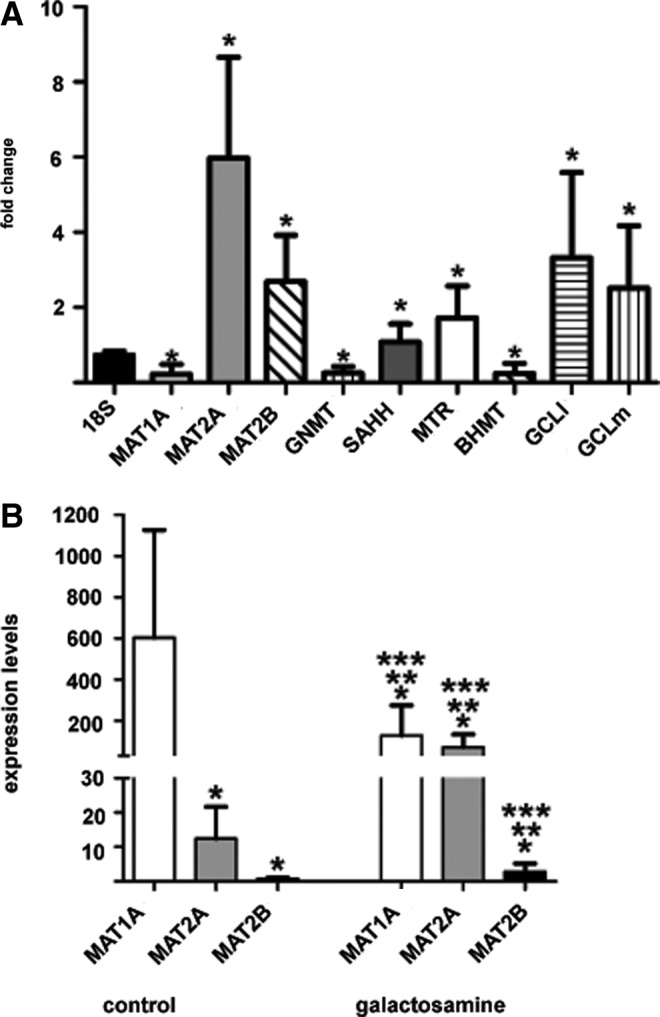
Analysis of expression changes by real-time RT-PCR. Changes in steady-state mRNA levels of enzymes of the hepatic methionine cycle and glutathione synthesis induced by d-galactosamine were analyzed by real-time RT-PCR. (A) Fold change in the galactosamine-treated group (n=16) calculated against the control group (n=16) using the 18S gene as reference (mean±SD). Statistical evaluation was performed using ratios for each transcript versus 18S (*p<0.05). (B) MAT transcript changes (mean±SD) within control (left) and galactosamine (right) groups using control MTR levels as reference for graphical purposes. Multiple comparisons were performed and changes were considered significant when p<0.05 (* vs. control MAT1A; ** vs. control MAT2A; *** vs. control MAT2B). MAT, methionine adenosyltransferase; MTR, methionine synthase; RT-PCR, reverse transcription polymerase chain reaction.
The consequences of these expression changes on protein levels were then analyzed in liver cytosols using α-tubulin as reference (Fig. 2A). Reductions (40%–45%) in MATα1 and BHMT levels were detected upon galactosamine treatment, whereas SAHH levels increased (190%) and those of GNMT remained unaffected (Fig. 2B). Protein changes were more moderate than in transcript levels; thus, putative alterations in mRNA and protein half-lives were explored. For this purpose, we first assessed whether the hepatic effects induced by galactosamine could be reproduced in H35 cells. Cytosolic BHMT protein levels decreased ∼30%, whereas those of SAHH increased ∼100% in galactosamine-treated cells, following the same trend observed in liver cytosols (Fig. 2C, D). Neither MATα1 nor GNMT were detected in control H35 cells as previously reported, although a faint GNMT band could be observed in cytosols of treated cells (Fig. 2E). Transient transfection with pHA-MAT allowed analysis of HA-MATα1; a tagged-MATα1 that exhibited MAT activity and the expected size and preserved the oligomerization features of MATα1 (Supplementary Figs. S3–S5). These transfected cells exhibited a 65% decrease in cytosolic HA-MATα1 levels after galactosamine treatment (Fig. 2F). Altogether, H35 cells reproduced liver behavior, allowing their use to evaluate putative changes in half-life. Half-lives of MAT2B, GCLm, and GCLl transcripts increased by galactosamine treatment, whereas those of SAHH and BHMT decreased or showed a trend toward reduction, respectively (Supplementary Table S3). In contrast, cytosolic BHMT and SAHH protein half-lives increased 200% by galactosamine treatment (Supplementary Table S3).
FIG. 2.
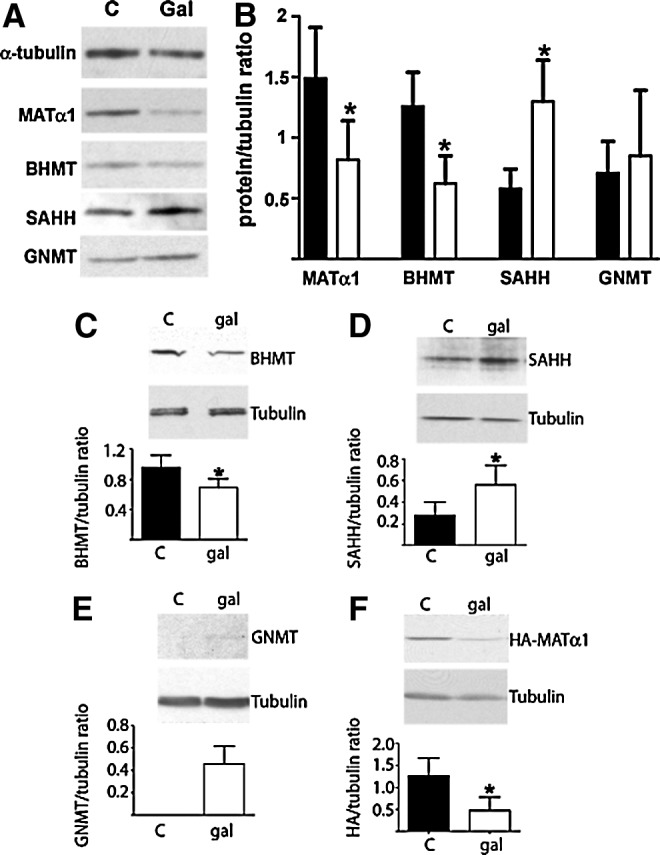
Western blot analysis of cytosolic methionine cycle enzymes. Samples of liver cytosols (25 μg) from control (n=16) and galactosamine-treated (n=16) rats were used for immunoblotting. (A) Representative blots of animals in each group. (B) Quantification of the signals for each protein corrected against α-tubulin (mean±SD) of animals in the control (black bars) and galactosamine groups (white bars). (C–E) Results from wild-type and (F) pHA-MAT transiently transfected H35 cells treated with PBS (control) or galactosamine (gal). Cytoplasmic samples (20–30 μg/lane) were used for immunoblotting using anti-BHMT (C), anti-SAHH (D), anti-GNMT (E), or anti-HA (F) and anti-α-tubulin (loading control). Student's t-tests of the data were performed against the corresponding control group (*p≤0.05). BHMT, betaine homocysteine methyltransferase; GNMT, glycine N-methyltransferase; SAHH, S-adenosylhomocysteine hydrolase; PBS, phosphate-buffered saline.
Next, changes in representative enzyme activities were measured in liver cytosols (Supplementary Table S1). Total MAT activity (MAT I+MAT II+MAT III) decreased 50% in the galactosamine group, but no changes were detected using 60 μM methionine and only a tendency toward increase was observed by DMSO activation of MAT III. These activity changes seemed compensated by the reduction in MATα1 protein levels (Fig. 2A). The treated group also showed a 25% reduction in BHMT activity; this was a modest change compared to alterations in mRNA and protein levels. Evaluation of hepatic metabolite changes by ultraperformance liquid chromatography–mass spectrometry (UPLC-MS) showed the already mentioned reduction in AdoMet levels in the galactosamine group, together with enhanced levels of Hcy, methionine, and, in particular, glutathione oxidized form (GSSG) (Supplementary Table S2). These changes caused a 30% decrease in the hepatic methylation index (AdoMet/AdoHcy) and the glutathione reduced form (GSH)/GSSG ratio.
Putative changes in the cytosolic association state of hepatic methionine cycle enzymes were evaluated by AGFC, confirming the previously described increase in MAT III activity in the galactosamine group (7), and hence a rise in the calculated dimer/tetramer activity ratio (Supplementary Fig. S2A, C and Supplementary Table S1). Additionally, dot-blot evaluation of MATα1 protein in the column fractions showed a strong reduction in the signal of the galactosamine group, where only MAT III oligomers were detected (Supplementary Fig. S2B, D). Calculated MAT III/I protein ratios were 11.64±3.96 and 24.66±5.38 (p=0.001) for control and treated groups, respectively. In contrast, cytosolic SAHH, GNMT, and BHMT exhibited no alteration in their association state (Supplementary Fig. S6).
Putative changes on MATα1 subcellular localization induced by galactosamine were then analyzed using initially transiently transfected H35 cells (Fig. 3). Only 15% of the control cells showed nuclear accumulation (nuclear-to-cytoplasmic signal ratio [N/C] >1.2) by indirect immunofluorescence, a percentage that increased to ∼60% after galactosamine treatment. In vivo confocal microscopy also demonstrated nuclear accumulation in ∼30% and ∼90% of the control and galactosamine-treated cells, respectively, whereas controls that express enhanced green fluorescence protein (EGFP) showed no alteration in subcellular distribution. Nuclear accumulation of MATα1 was confirmed by subcellular fractionation, showing a 60% increase in HA-MATα1, together with a ∼170% increase in nuclear SAHH in the treated group (Fig. 4A, B). Subcellular fractions of control and galactosamine-treated rat livers confirmed the increased nuclear MATα1 (200%) and SAHH (240%) levels, together with an elevated GNMT content (Fig. 4C, D). Further, these results were reinforced by immunohistochemistry that shows MATα1 cytoplasmic localization in control livers and nuclear staining in galactosamine-treated tissues (Fig. 5).
FIG. 3.

In vivo and indirect fluorescence confocal microscopy of transiently transfected H35 cells after d-galactosamine treatment. Hepatoma H35 cells were transiently transfected with pFLAG, pFLAG-MAT, pEGFP, or pMAT-EGFP. The plates were divided into two groups that were treated for 48 h with PBS (control) or 10 mM galactosamine. Representative examples of the expression of tagged-MATα1 in control and treated cells visualized by confocal microscopy are shown. (A) Indirect immunofluorescence of FLAG-MATα1 localization using anti-FLAG. (B) In vivo results with MATα1-EGFP. Colocalization with nuclear staining is shown in white (scale bar=25 μm). Histograms show quantification of the nucleo/cytoplasmic ratio (mean±SD) obtained with FLAG- (C) and EGFP- (D) transfected cells of five independent experiments carried out in triplicate (*p≤0.05). C=N when N/C=1±0.2. EGFP, enhanced green fluorescence protein; N/C, nuclear-to-cytoplasmic signal ratio. To see this illustration in color, the reader is referred to the web version of this article at www.liebertpub.com/ars
FIG. 4.

Western blot analysis of nuclear fractions. Nuclear fractions (100 μg/lane) of pHA-MAT- and wild-type transfected H35 cells were analyzed by western blot using anti-HA (A) or anti-SAHH (B), anti-tubulin, and anti-lamin B1 as cytoplasmic and nuclear markers, respectively. Signals were quantified and corrected against lamin B1 for comparison (mean±SD). Representative blots of five independent experiments carried out in triplicate are shown. (C) Representative immunoblots of liver nuclear fractions from control (n=6) and galactosamine-treated (n=6) rats incubated with the antibodies indicated on the left. (D) Quantification of the blots (mean±SD). Statistical analysis was performed by Student's t-test (*p≤0.05).
FIG. 5.

Subcellular distribution of MATα1 in liver samples analyzed by immunohistochemistry. Paraffin sections (5-μm thick) of liver samples from control and d-galactosamine-treated rats were incubated with anti-MATα1 or preimmune sera and counterstained with hematoxylin. Preimmune serum gave no signal in control (A) and galactosamine-treated livers (B, C). In contrast, anti-MATα1 signal was detected in hepatocyte cytosols of control (D) and galactosamine livers (E, F), whereas a mixture of positive (arrows) and negative (arrowheads) nuclear staining was visible in the treated samples. Panels (C) and (F) show a lower magnification view of the liver sections. Scale bars correspond to 10 μm (A, B, D, E) and 25 μm (C, F). To see this illustration in color, the reader is referred to the web version of this article at www.liebertpub.com/ars
Methionine cycle enzymes are oligomers in the cytoplasm, but the nuclear association state has been determined only for MATα1 (50). Therefore, we used AGFC to analyze possible changes in this parameter, and detected that the increased content of GNMT and SAHH in nuclear fractions of galactosamine-treated livers did not involve alterations in their elution pattern (Fig. 6A, B). Calculated elution volumes, 11.76 ml for GNMT and 11.13 ml for SAHH, corresponded to compact homo-tetramers of 133 and 171 kDa, respectively. In contrast, accumulation of nuclear MATα1 in treated livers occurred as tetramers with a parallel reduction in the monomer content (Fig. 6C), and the corresponding decrease in the calculated monomer/tetramer ratios (7.32±2.44 vs. 3.07±1.11; p=0.024) (Fig. 6D). MAT catalysis requires oligomerization; hence, the rise in nuclear MAT I content suggested an increase in activity that was in fact detected. Galactosamine treatment resulted in a 250% increase of nuclear MAT activity as compared with the controls [45.67±15.19 vs. 15.82±8.86 pmol/(min·mg−1), p=0.003].
FIG. 6.

Analysis of the association state of nuclear methionine metabolism enzymes. Livers of control (C; n=10) and galactosamine-treated rats (Gal; n=8) were used for subcellular fractionation. Representative AGFC profiles of nuclear fractions of control and treated animals obtained by dot-blot analysis are shown: (A) anti-GNMT, (B) anti-SAHH, and (C) anti-MATα1. Elution positions for tetramers (T) and monomers (M) are indicated. (D) MAT monomer/tetramer ratio (mean±SD) was calculated from the dot-blot data of six independent experiments carried out in duplicate. Data were analyzed by Student's t-tests (*p≤0.05). Protein standards used for column calibration and their elution volumes were as follows: blue dextran (2000 kDa; 7.13 ml), apoferritin (443 kDa; 9.55 ml), β-amylase (200 kDa; 10.38 ml), alcohol dehydrogenase (150 kDa; 11.05 ml), conalbumin (75 kDa; 11.88 ml), ovalbumin (43 kDa; 12.5 ml), carbonic anhydrase (29 kDa; 13 ml), and ATP (551 Da; 17.39 ml). AGFC, analytical gel filtration chromatography.
Next, several redox-modulating agents and transiently transfected H35 cells were used to get insight into the mechanisms that govern MATα1 subcellular distribution. Reductions in HA-MATα1 cytoplasmic content were found, concomitantly with nuclear accumulation, upon treatments with galactosamine (∼60%; Fig. 7A, C) and buthionine sulfoximine (BSO) (∼30%; Fig. 7B, D), an inhibitor of glutathione synthesis. N-acetylcysteine (NAC) and AdoMet prevented galactosamine effects on cytosolic protein levels, whereas nuclear changes were only prevented by NAC (Fig. 7A, C). BSO-induced alterations in HA-MATα1 levels were prevented by glutathione ethyl ester (EGSH) in both subcellular fractions, but not by AdoMet (Fig. 7B, D). Analysis of the glutathione levels and the GSH/GSSG ratio showed that only agents that prevented large alterations in these parameters (NAC and EGSH) were able to maintain the control nucleocytoplasmic distribution (Supplementary Fig. S7). No signs of apoptosis were detected in extracts of the different treatments, according to the lack of caspase-3 activation, but moderate changes in LDH activity in the culture media of galactosamine-treated cells were observed (Supplementary Figs. S8 and S9A). The effects described were confirmed in vivo by confocal microscopy using pMAT-EGFP-transfected H35 cells and the same agents (Supplementary Fig. S10A). Quantification of the N/C signal ratio indicated 250% increases upon galactosamine or BSO treatment, whereas NAC and EGSH partially prevented the effects on subcellular localization (Supplementary Fig. S10A, C).
FIG. 7.

Effect of redox-modulating agents on H35 cells. Cytosolic and nuclear fractions of hepatoma H35 cells transiently transfected with pHA-MAT, and incubated with the agents indicated in the figure, were analyzed by western blot. Representative western blots of 11 independent experiments are shown together with quantification of the data; (A, B) cytosolic HA-MATα1/tubulin and (C, D) nuclear HA-MATα1/lamin B1 ratios. Histograms present the results (mean±SD) as percentage of the control (PBS). Multiple comparisons were performed with ANOVA vs. control (*p≤0.05) and BSO or d-galactosamine (Gal; **p≤0.05). BSO, buthionine sulfoximine.
An enhanced nuclear capacity to produce AdoMet may be required to support key epigenetic modifications involving methylation; some of which were measured. No significant changes were observed in DNA methylation levels of both rat livers and pHA-MAT-transfected H35 cells, although a trend toward reduction was detected in the galactosamine-treated samples (Fig. 8A, B). In contrast, a 300% increase in me3K27H3 levels was detected in pHA-MAT-transfected cells that received galactosamine, and NAC prevented this increase (Fig. 8C, D). Therefore, nuclear accumulation of HA-MATα1 correlated positively with me3K27H3 upon galactosamine treatment.
FIG. 8.
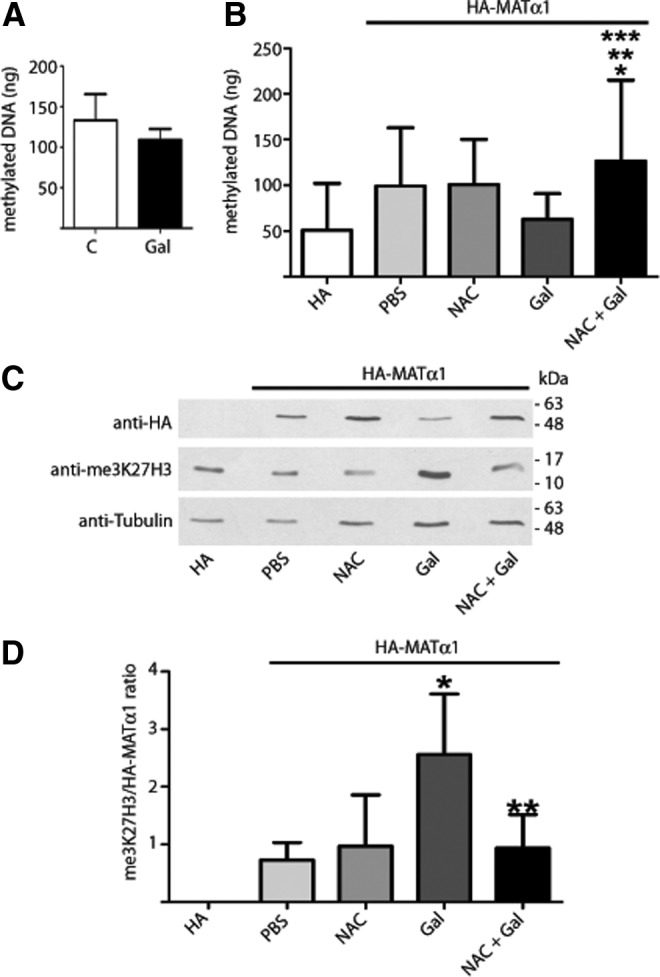
Effects of redox-modulating agents on nuclear methylations. (A) Global DNA methylation levels (mean±SD) from control (n=6) and galactosamine-treated livers (n=6). (B, C) Hepatoma H35 cells transiently transfected with pHA or pHA-MAT and treated with the indicated agents were used to obtain genomic DNA or cell extracts. (B) Global DNA methylation levels (mean±SD) from treated cells were calculated from data of three independent experiments carried out in triplicate using a standard curve of methylated control DNA. Multiple comparisons were performed with ANOVA (*p≤0.05 vs. pHA; ** vs. PBS; *** vs. Gal). (C) Representative immunoblots of me3K27H3 levels from four independent experiments carried out in triplicate are shown. The mobility and size of the standards are indicated on the right. (D) Quantification of me3K27H3 signals corrected against HA-MATα1 levels (mean±SD); tubulin signals were used as loading controls. Multiple comparisons were performed with ANOVA and differences were considered significant when p≤0.05 (* vs. PBS; ** vs. Gal). me3K27H3, histone 3 K27 trimethylation.
Finally, the effects of acetaminophen (APAP) intoxication on MATα1 nucleocytoplasmic distribution were also examined, given its known effects on methionine metabolism and GSH levels. An acute dose of the drug induced dramatic increases in rat serum transaminase levels (Supplementary Table S4), together with focal necrosis that was visible upon eosin/hematoxylin staining of liver sections (Supplementary Fig. S11). APAP induced significant decreases in hepatic levels of methionine, AdoMet, GSSG, and more severe on AdoHcy and GSH that resulted in an increased methylation index, together with a 25% decrease in the GSH/GSSG ratio (Supplementary Table S4). APAP-treated livers showed a 200% elevation of the nuclear MATα1 content, without significant changes in cytoplasmic levels as judged by western blot (Supplementary Fig. S12). In contrast, a 20% decrease in cytosolic MAT activity was detected in the presence of 60 μM or 5 mM methionine, and no significant changes were measured by DMSO activation (Supplementary Table S4). These data suggested an effect of APAP directed toward MAT I activity that was further analyzed by AGFC. Opposite behaviors for dimer/tetramer activity and protein ratios were detected in the cytosol. Thus, while the MAT III/I activity ratio increased 200%, reflecting a decrease in MAT I activity, the protein ratio was reduced by the increased tetramer content (Supplementary Fig. S12C, D). In parallel, the nuclear monomer/tetramer ratio decreased due to a significant increase in MAT I levels, without modification of the total nuclear MAT activity (Supplementary Fig. S12E–G). This lack of changes in nuclear MAT activity presented with a trend toward reduction in hepatic global DNA methylation (Supplementary Fig. S13A). Nuclear accumulation of MATα1-EGFP was also shown by in vivo confocal microscopy in H35-transfected cells upon APAP treatment, an effect that was partially prevented by NAC (Supplementary Fig. S10D, E). APAP, NAC, or their combination induced no significant changes in DNA methylation as compared with cells that received the vehicle (Supplementary Fig. S13B). However, APAP increased me3K27H3 levels (200%), an effect that was not prevented by NAC, despite the normalization of glutathione levels and the GSH/GSSG ratio (Supplementary Fig. S7C). Extracts from APAP-treated cells showed activated caspase-3 (19–17 kDa) and increased LDH activity (∼170%) in the culture media, suggestive of apoptosis (Supplementary Figs. S8B and S14).
Discussion
Many liver diseases associated with impairment of methionine metabolism proceed with changes in the MAT isoenzymes that are expressed (MAT1A to MAT2A switch) (7, 12, 14, 31, 33, 56, 61). By this expression switch, the cell changes from high-to-low Vmax MAT isoenzymes with the corresponding reductions in MAT activity, AdoMet levels, and the methylation index. Additionally, liver injury concurs with decreases in GSH content and/or increases in GSSG, nitric oxide (NO) concentrations, and reactive oxygen species (ROS) levels that are known to inhibit cytosolic MAT I/III and, in some cases, change the dimer/tetramer ratio (28, 34, 38, 40, 42, 44, 52, 56). Galactosamine and APAP differ notably in their mechanisms of action (5, 27), but acute doses of both agents induce liver injury with the mentioned alterations in hepatic metabolism (7, 42, 56, 58). Our results confirm these previous observations upon galactosamine treatment, together with a modest increase in MAT2B and MTR mRNA levels and a strong decrease in GNMT and BHMT transcripts (Supplementary Fig. S15). These expression changes resemble alterations reported in APAP intoxication, except for SAHH and GNMT levels that were transiently elevated in this model (56). Protein levels follow the same trend than mRNA in galactosamine intoxication, although more modest alterations are detected, due in some cases to opposite changes in their half-lives. Galactosamine also induces expression of both GCL subunits, whereas APAP and other hepatotoxicants only increase GCLl expression (22, 56). Putative mechanisms by which expression changes take place may involve the presence of antioxidant response elements (AREs) in the corresponding promoters (25), the uridine depletion induced by galactosamine (27), and stabilization/destabilization of the corresponding transcripts through binding to human antigen R (HuR) or AUF1, respectively, as has been demonstrated for MAT2A and MAT1A mRNAs during liver carcinogenesis (36, 59).
All these alterations result in reductions of hepatic AdoMet levels in galactosamine and APAP intoxications, as previously described (7, 42, 43, 56, 58). However, AdoHcy and methionine concentrations follow opposite trends in both models, probably due to the combination of divergent changes in SAHH, GNMT, BHMT, and MTR expression and protein levels, as well as in the flux through the trans-sulfuration pathway (56). Galactosamine effects in methionine and AdoMet are also supported by the previously reported decreases in ATP and sarcosine levels found in isolated hepatocytes (43). Additionally, decreased AdoMet levels could contribute to this picture by avoiding activation of trans-sulfuration (37, 46), increasing BHMT expression (46) (not observed with galactosamine), contributing to methionine and folate recycling by enhancing methylene tetrahydrofolate reductase (MTHFR) activity and increasing MTR expression (57), and modulating HuR nucleocytoplasmic distribution, and hence contributing to increase in MAT2A mRNA levels (36). Further, an increased MTHFR activity leads to higher 5-methyltetrahydrofolate levels that inhibit GNMT (32), whereas decreased BHMT levels would result in lower betaine consumption, increasing protection against protein conformational changes (10). Both drugs lead also to a compensatory increase of GCL expression that should render enhanced total glutathione levels. Nevertheless, such an increase is only observed for galactosamine, probably due to the different detoxification mechanisms used by both drugs. Such mechanisms may require a larger amount of glutathione for APAP metabolization than for galactosamine-derived ROS removal. However, the net results are reduced GSH/GSSG ratios that likely reflect the GSH consumption needed for N-acetyl-p-benzoquinone imine (NAPQI) generation and the GSSG production due to galactosamine-ROS elimination, as well as the galactosamine inhibition of glutathione recycling enzymes (5, 29, 40, 48).
These global effects of galactosamine and APAP on metabolite concentrations reflect mainly cytosolic changes, but may not mirror those in other subcellular compartments with different functions and needs. Classically, methionine metabolism was considered a cytoplasmic pathway and metabolites, such as AdoMet, were expected to move to compartments where methylation reactions were held. This hypothesis was supported by the cytoplasmic localization of the enzymes and the existence of AdoMet transporters (23, 33, 45). However, recent reports described nuclear localization of SAHH, GNMT, MATα1, MATα2, and MATβ that was related to in situ production of AdoMet and AdoHcy elimination (26, 49, 50, 60, 62). Hence, the paradigm has changed to propose that enzymes are transported to those locations where metabolite synthesis is needed (16). Nevertheless, the mechanisms involved in the control of their subcellular distribution and their relationship to disease remain unknown. Here, we show that APAP and galactosamine intoxications induce nuclear accumulation of MATα1 and increased MAT I levels that correlate with reduction (galactosamine) or no change (APAP) of the cytosolic protein levels, together with opposite consequences on the MAT III/I protein ratio. Alterations at the protein level only match the total MAT activity of both compartments in galactosamine intoxication, whereas higher MAT I levels in APAP treatment correlate with reduction (cytoplasm) or no effect (nucleus) in this parameter. These differential effects on cytosolic and nuclear MAT activities may rely on the induction of reversible (GSSG, NO, and ROS) and/or irreversible (NAPQI) modifications of the protein (4, 5, 42, 53), in the association capacity of the nuclear monomer pool into MAT I, and additionally on the moderate APAP dose used.
Epigenetic remodeling is required for the induction/repression of genes involved in defense mechanisms, apoptosis, or necrosis during progression of liver damage. The nuclear increase in MAT I induced by galactosamine and APAP may respond to higher AdoMet needs in this compartment, as reflected by the rise in me3K27H3 levels in H35-treated cells, and the subtle DNA hypomethylation in the galactosamine model. These results confirm previous data that associate MATα1 overexpression and changes in DNA methylation and me3K27H3, as well as the positive correlation between me3K27H3 levels and nucleocytoplamic distribution (50). Additionally, the concomitant elevation of nuclear SAHH and GNMT tetramers, their active assemblies (32, 49), observed in galactosamine-treated livers may contribute to eliminate the resulting AdoHcy and to a fine-tuning of AdoMet levels.
Oxidative stress is among the mechanisms that induce nuclear localization of proteins (21, 41), but it is also involved in the control of epigenetic modifications (13). Galactosamine, APAP, and BSO are known to produce oxidative stress, resulting in reduced GSH/GSSG ratios, and all these induce nuclear accumulation of MATα1. NAC and EGSH, precursors for GSH synthesis (29), normalize this ratio, preventing changes in MATα1 localization induced by the treatments. In contrast, AdoMet, as previously shown (28), is unable to normalize the GSH/GSSG ratio, and hence it does not prevent MATα1 nuclear accumulation. These results suggest the implication of a glutathione-dependent mechanism in nuclear localization of MATα1 and that for APAP may involve additional processes. Accordingly, NAC does not prevent APAP effects on DNA methylation and me3K27H3 in H35 cells, but increases global DNA methylation in galactosamine-treated cells and prevents the rise in me3K27H3. This positive correlation between nuclear MATα1 levels and me3K27H3, a known repression mark (6), is observed with both drugs, suggesting the need to downregulate certain genes that may have been activated by the global DNA hypomethylation normally associated with increased MAT2A expression (8, 15, 24), and for which our rat models show a trend. Altogether the available results suggest the preference of MAT I to supply AdoMet for me3K27H3 whereas MAT II subunits were found interacting with several methyltransferases involved in histone 3 K4 dimethylation (me2K4H3) and histone 3 K9 dimethylation (me2K9H3) (26). These epigenetic modifications have been studied specially in cancer and have been associated with either repression (me3K27H3 and me2K9H3) or activation (me2K4H3) of gene expression (51, 55); the final outcomes depend on the genes that were affected. Overall, changes induced by the treatments on hepatic MATα1 make hepatocytes approach the extrahepatic cell pattern, where this protein is poorly expressed and preferentially localized to the nucleus (50).
In summary, our data indicate that AdoMet homeostasis in liver injury is sustained by changes involving from transcription to activity and subcellular localization of methionine metabolism enzymes. The GSH/GSSG ratio controls MATα1 subcellular distribution; its decrease leads to MAT I nuclear accumulation to supply the increased AdoMet needs for epigenetic remodeling. Concomitantly, nuclear accumulation of SAHH contributes to preclude methyltransferase inhibition, maintaining the methylation index. Altogether these findings unveil new implications for the regulation of these enzymes in disease.
Materials and Methods
Animal models
Male Wistar rats (180–200 g) were divided into 4 groups (25 animals each) that received i.p. injections at 24-h intervals of phosphate-buffered saline (PBS; control 1 and 2 groups), d-galactosamine hydrochloride (400 mg/kg; Sigma, St. Louis, MO), or APAP (250 mg/kg; Sigma). Animals were sacrificed after 24 (control 1 and APAP groups) or 48 h (control 2 and galactosamine groups) and blood, liver, and kidneys were extracted. Tissues were processed immediately for subcellular fractionation or frozen in liquid nitrogen for storage at −80°C. All animals were treated according to the Guidelines for Animal Experimentation of the CSIC and the European Union.
Histology and immunohistochemistry
Liver samples and one kidney of each individual were fixed in formaldehyde 10% (v/v) before being embedded in paraffin. Sections (10 μm) were prepared and used for morphological analysis after standard hematoxylin/eosin staining.
Immunohistochemistry was performed on paraffin sections (5 μm) using anti-MATα1 or preimmune rabbit sera (1:1000, v/v), followed by EnVision (Dako Corporation, Carpinteria, CA) as previously described (50). Counterstaining was performed with hematoxylin. Sections were photographed and analyzed using Adobe-Photoshop CS software v. 8.0.1.
Liver function analysis
Serum samples were obtained by standard protocols after incubation at 37°C for 20–30 min. Transaminase levels were analyzed at the Centro de Análisis Sanitarios of the Universidad Complutense de Madrid (Facultad de Farmacia, Madrid, Spain).
Plasmids and expression and characterization of tagged proteins
The pHA(del) plasmid was prepared by deletion of C876 of pCMV-HA (Clontech, Mountain View, CA) to allow in-frame cloning of the rat MAT1A ORF that was obtained by EcoRI/NotI (Invitrogen-Life Technologies, Carlsbad, CA) digestion of pSSRL-BlueT2 (1). The resulting plasmid was named pHA-MAT. The HA-MATα1 protein contains the LMAMEAEFH linker sequence, increasing its size by ∼2 kDa. Protein characterization was carried out by MAT activity determinations (160 μl), western blot (80 μg), and AGFC (100 μl) using the soluble fraction obtained after overexpression into BL21(DE3) cells, as previously described (2, 50). The results were compared with soluble fractions of cells transformed with pHA(del) (Supplementary Figs. S3–S5). Additional plasmids used in this work, pFLAG-MAT and pMAT-EGFP, were previously described and both FLAG-MATα1 and MATα1-EGFP proteins were characterized (50).
Cell culture and treatments
Rat hepatoma H35 cells were grown in DMEM (Gibco-Life Technologies, Grand Island, NY) containing 10% (v/v) FBS and 2 mM glutamine. Transient transfections with pFLAG-MAT, pMAT-EGFP, or pHA-MAT construct were carried out using Lipofectamine for 6–8 h (Invitrogen-Life Technologies). Concentrations of the agents (Sigma) used in the treatments were as follows: 10 mM d-galactosamine (Gal), 5 mM NAC, 0.5 mM AdoMet chloride, 1 mM BSO, 1 mM EGSH, and 5 mM APAP. All the agents were diluted in PBS, except for APAP that was dissolved in ethanol (1% v/v final concentration). BSO and APAP treatments were carried out for 24 h, whereas galactosamine was added for 48 h. NAC was added 12 h before galactosamine or APAP, whereas AdoMet and EGSH were supplied 15 min prior to either galactosamine or BSO administration.
For half-life experiments, H35 cells (300,000 cells) were seeded and grown overnight. Three plates per time point were prepared containing either PBS (controls) or d-galactosamine (treated) for 48 h. The culture medium was then replaced with serum-free medium and 20 μg/ml cycloheximide (Sigma) or 5 μg/ml actinomycin D (Sigma) was added to the plates. Samples were collected at different time points up to 24 h to obtain either the cytosolic fractions or total RNA, and the effects on each protein or mRNA were analyzed by western blot or real-time RT-PCR, respectively. The values were corrected against α-tubulin (western blot) or the 18S transcript, and the half-lives were calculated using GraphPad Prism v. 5.0.
Confocal microscopy
H35 cells were grown on coverslips for indirect immunofluorescence (40,000 cells) or in vivo (100,000 cells) confocal microscopy and transient transfections with pFLAG-MAT or pMAT-EGFP were carried out before treatment, using the conditions described previously. Nuclei were stained for 1 h using Hoechst 33342 (5 μg/ml; Molecular Probes, Carlsbad, CA) before cell fixation or direct observation. Fixation was carried out using 2% (v/v) formaldehyde, followed by permeabilization using 0.3% (v/v) Triton X-100 (Calbiochem-Merck, Darmstadt, Germany) as previously described (50). Fixed cells were incubated for 1 h sequentially with monoclonal mouse M2 anti-FLAG (5 μg/ml; Sigma) and anti-mouse-Alexa Fluor 488 (Molecular Probes). Glass coverslips were mounted using Prolong Gold anti-fade reagent (Invitrogen-Life Technologies). Cell imaging (0.3–0.4 μm sections) was performed on a Leica TCS SPII Spectral microscope using a 63×/1.3 NA objective at the confocal microscopy facilities of the Universidad Autónoma de Madrid (UAM). Images were analyzed using the Leica Confocal Software (LCS Lite, Zurich, Switzerland).
Subcellular fractionation
Rat liver samples were homogenized in four volumes of 10 mM Tris/HCl (pH 7.4) containing 0.3 M sucrose, 0.1 mM EGTA, 0.1% 2-mercaptoethanol (Merck, Darmstadt, Germany), 1 mM benzamidine (Sigma), 0.1 mM PMSF (Sigma), and 10 μg/ml soybean trypsin inhibitor (Sigma). Homogenates were centrifuged at 12,500 g for 15 min at 4°C and the supernatants were ultracentrifuged at 105,000 g for 1 h at 4°C. This second supernatant, the cytosolic fraction, was used for activity measurements, AGFC, and western blot.
Separation of nuclear and cytoplasmic fractions was carried out in the absence of detergents as previously described (3, 50). For this purpose, liver samples (∼8 g) or H35 cells (2×10⁶/p100), wild type and transiently transfected with pFLAG-MAT or pHA-MAT, were used. Samples of subcellular fractions were utilized for western blot, AGFC, and activity determinations. Cross-contamination among fractions was monitored by measuring LDH activity as described previously (50), and by densitometric scanning of the immunoblot signals for the marker proteins α-tubulin (cytoplasm) and lamin B1 (nucleus) and found to be <0.08%. Cell extracts for evaluation of histone methylation were obtained by a 30-min incubation on ice in 50 mM Tris/HCl (pH 7.5), 150 mM NaCl, 0.5% (v/v) sodium dodecyl sulfate (SDS), 30 mM sodium pyrophosphate, 50 mM NaF, and protease inhibitors, followed by centrifugation at 100,000 g for 30 min.
Quantitative RT-PCR
Total RNA was isolated from livers of control and treated animals using the RNeasy kit (Qiagen, Hilden, Germany), and the quality and quantity were determined spectrometrically and by automated electrophoretogram on a Bioanalyzer 2100. Reverse transcription and PCR were done as previously described using 1.25 μg of total RNA as template and the High Capacity Archive kit (Applied Biosystems-Life Technologies, Grand Island, NY) (14). The cDNAs (10 ng) were amplified in triplicate using gene-specific primers (Supplementary Table S5) and Power SYBR Green PCR Master Mix (Applied Biosystems-Life Technologies) using the ABI 7900HT Real-Time PCR system (Applied Biosystems-Life Technologies) at the Genomic Service of the Instituto de Investigaciones Biomédicas “Alberto Sols” (CSIC-UAM). Fluorescent signals were collected after each extension step, and the curves were analyzed with SDS 2.2.2 software. Relative expression ratios were normalized to the geometric mean of the 18S gene used as a control. Experimental efficiencies were calculated for each transcript and used to obtain the fold changes according to Pfaffl (47).
Activity measurements
Samples of the subcellular fractions were used to determine MAT, BHMT, and LDH activities as described previously (18, 19, 50). Briefly, cytosolic MAT activity measurements were carried out for 30 min using 160 μl of samples and three types of reaction mixtures that differ mainly in their methionine (Sigma) content: (i) 5 mM (total activity; standard mixture), (ii) 60 μM (MAT I and MAT II activities), and (iii) 60 μM plus 10% (v/v) DMSO (MAT I, MAT II, and stimulated MAT III activities). MAT activity measurements in AGFC fractions (100 μl) and nuclear extracts (160 μl) were performed using the standard mixture for 30 min and 2 h, respectively. For BHMT activity determinations, cytosols (75 μl) were used and reactions were carried out for 30 min. LDH activity was followed at 340 nm and 37°C for 5 min using subcellular fractions (10–100 μl) or culture media (100 μl) in 50 mM Tris/HCl (pH 7.5), 0.2 mM NADH (Sigma), and 1 mM sodium pyruvate (Sigma).
Analytical gel filtration chromatography
Subcellular fractions (100 μl) were loaded on a Superose 12 10/300 GL column (GE Healthcare, Barcelona, Spain) equilibrated and eluted at 0.3 ml/min in 50 mM Tris/HCl (pH 8), 10 mM MgSO4, and 1 mM EDTA containing 150 mM KCl. Fractions (210 μl) were collected for activity measurements and/or dot-blot analyses. Standards (GE Healthcare and Sigma) for column calibration and their elution volumes are indicated in the figure legends.
Western blot and dot-blot
Liver cytosols (25 μg) or H35 cytosolic samples (80 μg) and nuclear fractions (150 μg) were loaded on 10% SDS-polyacrylamide gel electrophoresis (PAGE) gels and transferred to nitrocellulose membranes (GE Healthcare) for incubation with antibodies against MATα1 (1:10,000 v/v) (31), BHMT (1:20,000 v/v) (19), SAHH (1:1000 v/v, sc-55759; Santa Cruz, Santa Cruz, CA), GNMT (1:1000 v/v, sc-68871; Santa Cruz), FLAG (2.5 μg/ml; Sigma), HA (1:1000 v/v; Covance, Madrid, Spain), α-tubulin (1:2500 v/v; Sigma), or lamin B1 (1:1000 v/v; Abcam, Cambridge, United Kingdom). Evaluation of caspase-3 activation (50 μg/lane) and histone methylation (10 μg/lane) was performed on 14% SDS-PAGE gels and western blots incubated with anti-caspase-3 (1:1000 v/v; Cell Signalling, Danvers, MA) or anti-me3K27H3 (1 μg/ml; Upstate-Millipore, Charlottesville, VA), respectively. Western blot signals were developed using the Western Lightning Chemiluminescence Reagent (Perkin Elmer Life Sciences, Waltham, MA) and densitometric scanning was carried out using ImageJ v. 1.37 (http://rsb.info.nih.gov/ij/). Values were normalized against the α-tubulin or lamin B1 controls for comparison.
For dot-blot analysis aliquots (100 μl) of the column fractions were spotted onto nitrocellulose membranes as previously described (54), and incubated with the antibodies of interest using the same dilutions as for western blot.
Analysis of metabolite levels
Quantification of metabolite levels was performed, as previously described, at OWL Genomics Facilities (Derio, Vizcaya, Spain) (14). Briefly, tissue samples were homogenized in 0.4 M perchloric acid and the supernatant was used to determine reduced (GSH) and oxidized (GSSG) glutathione levels. AdoMet, AdoHcy, Hcy, and methionine were measured after 6-aminoquinolyl-N-hydroxysuccinimidyl carbamate derivatization using the AccQ Tag Ultra derivatization kit (Waters, Milford, MA). Samples were analyzed at 50°C using a BEH C18 column (Waters) and a gradient from 0.05% formic acid:water (buffer A) to 0.05% formic acid:acetonitrile (buffer B) coupled to ESI detection (UPLC-MS). Glutathione levels in H35-treated cells were determined by the method of Tietze.
Global DNA methylation
Genomic DNA from liver samples or H35 cells was extracted using the DNeasy kit (Qiagen). The quality and quantity of the purified DNA was determined spectrophotometrically (A260/A280 ratio). Samples (200 ng/well) were used to determine global DNA methylation levels using the IMPRINT® Methylation DNA Quantification kit (Sigma) following manufacturer's instructions.
Protein concentration determinations
Protein concentration was measured using the BioRad protein assay and bovine serum albumin as the standard.
Statistics
GraphPad Prism v. 5.0 (GraphPad Software) was used for statistical analysis of the data. Experiments that contain two groups of data were analyzed using Student's t-test for independent samples, whereas one-way ANOVA with Bonferroni post hoc test was preferred for multiple comparisons; differences were considered significant when p≤0.05.
Supplementary Material
Abbreviations Used
- AdoHcy
S-adenosylhomocysteine
- AdoMet
S-adenosylmethionine
- AGFC
analytical gel filtration chromatography
- APAP
acetaminophen
- BHMT
betaine homocysteine methyltransferase
- BSO
buthionine sulfoximine
- EGFP
enhanced green fluorescence protein
- EGSH
glutathione ethyl ester
- Gal
d-galactosamine
- GCL
γ-glutamylcysteine synthetase
- GCLl
γ-glutamylcysteine synthetase ligase
- GCLm
γ-glutamylcysteine synthetase modifier
- GNMT
glycine N-methyltransferase
- GSH
glutathione reduced form
- GSSG
glutathione oxidized form
- Hcy
homocysteine
- HuR
human antigen R
- MafK
Maf oncoprotein K
- MAT
methionine adenosyltransferase
- me2K4H3
histone 3 K4 dimethylation
- me2K9H3
histone 3 K9 dimethylation
- me3K27H3
histone 3 K27 trimethylation
- MTR
methionine synthase
- NAC
N-acetylcysteine
- NAPQI
N-acetyl-p-benzoquinone imine
- N/C
nuclear-to-cytoplasmic signal ratio
- NO
nitric oxide
- PAGE
polyacrylamide gel electrophoresis
- PBS
phosphate-buffered saline
- ROS
reactive oxygen species
- RT-PCR
reverse transcription polymerase chain reaction
- SAHH
S-adenosylhomocysteine hydrolase
- SDS
sodium dodecyl sulfate
- UPLC-MS
ultraperformance liquid chromatography–mass spectrometry
Acknowledgments
This work was supported by grants of the Ministerio de Economía y Competitividad (BFU2005-00050, BFU2008-00666, and BFU2009-08977 to M.A.P.; SAF2009-11642 and SAF2012-36519 to D.P.-S.; and PS09/01762 to J.P.-M.) and the Instituto de Salud Carlos III (RCMN C03/08 and PI05/0563 to M.A.P.; RD07/0064/0007 and RD12/0013/0008 to D.P.-S.). M.D. was supported by fellowships of RCMN C03/08 and PI05/0563 and M.P. by BFU2009-08977. The authors thank A. Cerro, D. Arroyo, and Y. López-Gordillo for their help with histological techniques.
Author Disclosure Statement
No competing financial interests exist.
References
- 1.Alvarez L, Asuncion M, Corrales F, Pajares MA, and Mato JM. Analysis of the 5′ non-coding region of rat liver S-adenosylmethionine synthetase mRNA and comparison of the Mr deduced from the cDNA sequence and the purified enzyme. FEBS Lett 290: 142–146, 1991 [DOI] [PubMed] [Google Scholar]
- 2.Alvarez L, Mingorance J, Pajares MA, and Mato JM. Expression of rat liver S-adenosylmethionine synthetase in Escherichia coli results in two active oligomeric forms. Biochem J 301: 557–561, 1994 [DOI] [PMC free article] [PubMed] [Google Scholar]
- 3.Andrews NC. and Faller DV. A rapid micropreparation technique for extraction of DNA-binding proteins from limiting numbers of mammalian cells. Nucleic Acids Res 19: 2499, 1991 [DOI] [PMC free article] [PubMed] [Google Scholar]
- 4.Avila MA, Mingorance J, Martinez-Chantar ML, Casado M, Martin-Sanz P, Bosca L, and Mato JM. Regulation of rat liver S-adenosylmethionine synthetase during septic shock: role of nitric oxide. Hepatology 25: 391–396, 1997 [DOI] [PubMed] [Google Scholar]
- 5.Baillie TA. and Rettie AE. Role of biotransformation in drug-induced toxicity: influence of intra- and inter-species differences in drug metabolism. Drug Metab Pharmacokinet 26: 15–29, 2011 [DOI] [PMC free article] [PubMed] [Google Scholar]
- 6.Bhaumik SR, Smith E, and Shilatifard A. Covalent modifications of histones during development and disease pathogenesis. Nat Struct Mol Biol 14: 1008–1016, 2007 [DOI] [PubMed] [Google Scholar]
- 7.Cabrero C, Duce AM, Ortiz P, Alemany S, and Mato JM. Specific loss of the high-molecular-weight form of S-adenosyl-L-methionine synthetase in human liver cirrhosis. Hepatology 8: 1530–1534, 1988 [DOI] [PubMed] [Google Scholar]
- 8.Cai J, Mao Z, Hwang JJ, and Lu SC. Differential expression of methionine adenosyltransferase genes influences the rate of growth of human hepatocellular carcinoma cells Cancer Res 58: 1444–1450, 1998 [PubMed] [Google Scholar]
- 9.Cantoni GL. Biological methylation: selected aspects. Annu Rev Biochem 44: 435–451, 1975 [DOI] [PubMed] [Google Scholar]
- 10.Chow MK, Devlin GL, and Bottomley SP. Osmolytes as modulators of conformational changes in serpins. Biol Chem 382: 1593–1599, 2001 [DOI] [PubMed] [Google Scholar]
- 11.Corrales F, Gimenez A, Alvarez L, Caballeria J, Pajares MA, Andreu H, Pares A, Mato JM, and Rodes J. S-adenosylmethionine treatment prevents carbon tetrachloride-induced S-adenosylmethionine synthetase inactivation and attenuates liver injury. Hepatology 16: 1022–1027, 1992 [DOI] [PubMed] [Google Scholar]
- 12.Corrales F, Ochoa P, Rivas C, Martin-Lomas M, Mato JM, and Pajares MA. Inhibition of glutathione synthesis in the liver leads to S-adenosyl-L-methionine synthetase reduction. Hepatology 14: 528–533, 1991 [PubMed] [Google Scholar]
- 13.Cyr AR. and Domann FE. The redox basis of epigenetic modifications: from mechanisms to functional consequences. Antioxid Redox Signal 15: 551–589, 2011 [DOI] [PMC free article] [PubMed] [Google Scholar]
- 14.Delgado M, Perez-Miguelsanz J, Garrido F, Rodriguez-Tarduchy G, Perez-Sala D, and Pajares MA. Early effects of copper accumulation on methionine metabolism. Cell Mol Life Sci 65: 2080–2090, 2008 [DOI] [PMC free article] [PubMed] [Google Scholar]
- 15.Ehrlich M. DNA hypomethylation in cancer cells. Epigenomics 1: 239–259, 2009 [DOI] [PMC free article] [PubMed] [Google Scholar]
- 16.Gibson BA. and Kraus WL. Small molecules, big effects: a role for chromatin-localized metabolite biosynthesis in gene regulation. Mol Cell 41: 497–499, 2011 [DOI] [PMC free article] [PubMed] [Google Scholar]
- 17.Gil B, Casado M, Pajares MA, Bosca L, Mato JM, Martin-Sanz P, and Alvarez L. Differential expression pattern of S-adenosylmethionine synthetase isoenzymes during rat liver development. Hepatology 24: 876–881, 1996 [DOI] [PubMed] [Google Scholar]
- 18.Gil B, Pajares MA, Mato JM, and Alvarez L. Glucocorticoid regulation of hepatic S-adenosylmethionine synthetase gene expression. Endocrinology 138: 1251–1258, 1997 [DOI] [PubMed] [Google Scholar]
- 19.Gonzalez B, Campillo N, Garrido F, Gasset M, Sanz-Aparicio J, and Pajares MA. Active-site-mutagenesis study of rat liver betaine-homocysteine S-methyltransferase. Biochem J 370: 945–952, 2003 [DOI] [PMC free article] [PubMed] [Google Scholar]
- 20.Gonzalez B, Garrido F, Ortega R, Martinez-Julvez M, Revilla-Guarinos A, Perez-Pertejo Y, Velazquez-Campoy A, Sanz-Aparicio J, and Pajares MA. NADP(+) binding to the regulatory subunit of methionine adenosyltransferase II increases intersubunit binding affinity in the hetero-trimer. PLoS One 7: e50329, 2012 [DOI] [PMC free article] [PubMed] [Google Scholar]
- 21.Hara MR, and Agrawal N, Kim SF, Cascio MB, Fujimuro M, Ozeki Y, Takahashi M, Cheah JH, Tankou SK, Hester LD, Ferris CD, Hayward SD, Snyder SH, and Sawa A. S-nitrosylated GAPDH initiates apoptotic cell death by nuclear translocation following Siah1 binding. Nat Cell Biol 7: 665–674, 2005 [DOI] [PubMed] [Google Scholar]
- 22.Heijne WH, Jonker D, Stierum RH, van Ommen B, and Groten JP. Toxicogenomic analysis of gene expression changes in rat liver after a 28-day oral benzene exposure. Mut Res 575: 85–101, 2005 [DOI] [PubMed] [Google Scholar]
- 23.Horne DW, Holloway RS, and Wagner C. Transport of S-adenosylmethionine in isolated rat liver mitochondria. Arch Biochem Biophys 343: 201–206, 1997 [DOI] [PubMed] [Google Scholar]
- 24.Huang ZZ, Mato JM, Kanel G, and Lu SC. Differential effect of thioacetamide on hepatic methionine adenosyltransferase expression in the rat. Hepatology 29: 1471–1478, 1999 [DOI] [PubMed] [Google Scholar]
- 25.Jaiswal AK. Nrf2 signaling in coordinated activation of antioxidant gene expression. Free Radic Biol Med 36: 1199–1207, 2004 [DOI] [PubMed] [Google Scholar]
- 26.Katoh Y, Ikura T, Hoshikawa Y, Tashiro S, Ito T, Ohta M, Kera Y, Noda T, and Igarashi K. Methionine adenosyltransferase II serves as a transcriptional corepressor of Maf oncoprotein. Mol Cell 41: 554–566, 2011 [DOI] [PubMed] [Google Scholar]
- 27.Keppler DO, Pausch J, and Decker K. Selective uridine triphosphate deficiency induced by D-galactosamine in liver and reversed by pyrimidine nucleotide precursors. Effect on ribonucleic acid synthesis. J Biol Chem 249: 211–216, 1974 [PubMed] [Google Scholar]
- 28.Kucera O, Cervinkova Z, Lotkova H, Krivakova P, Rousar T, Muzakova V, Hezova R, Kandar R, and Rudolf E. Protective effect of S-adenosylmethionine against galactosamine-induced injury of rat hepatocytes in primary culture. Physiol Res 55: 551–560, 2006 [DOI] [PubMed] [Google Scholar]
- 29.Lu SC. Regulation of glutathione synthesis. Mol Aspects Med 30: 42–59, 2009 [DOI] [PMC free article] [PubMed] [Google Scholar]
- 30.Lu SC, Alvarez L, Huang ZZ, Chen L, An W, Corrales FJ, Avila MA, Kanel G, and Mato JM. Methionine adenosyltransferase 1A knockout mice are predisposed to liver injury and exhibit increased expression of genes involved in proliferation. Proc Natl Acad Sci USA 98: 5560–5565, 2001 [DOI] [PMC free article] [PubMed] [Google Scholar]
- 31.Lu SC. and Mato JM. S-adenosylmethionine in liver health, injury, and cancer. Physiol Rev 92: 1515–1542, 2012 [DOI] [PMC free article] [PubMed] [Google Scholar]
- 32.Luka Z, Mudd SH, and Wagner C. Glycine N-methyltransferase and regulation of S-adenosylmethionine levels. J Biol Chem 284: 22507–22511, 2009 [DOI] [PMC free article] [PubMed] [Google Scholar]
- 33.Markham GD. and Pajares MA. Structure-function relationships in methionine adenosyltransferases. Cell Mol Life Sci 66: 636–648, 2009 [DOI] [PMC free article] [PubMed] [Google Scholar]
- 34.Martinez-Chantar ML. and Pajares MA. Role of thioltransferases on the modulation of rat liver S-adenosylmethionine synthetase activity by glutathione. FEBS Lett 397: 293–297, 1996 [DOI] [PubMed] [Google Scholar]
- 35.Martinez-Chantar ML, Vazquez-Chantada M, Ariz U, Martinez N, Varela M, Luka Z, Capdevil A, Rodriguez J, Aransay AM, Matthiesen R, Yang H, Calvisi DF, Esteller M, Fraga M, Lu SC, Wagner C, and Mato JM. Loss of the glycine N-methyltransferase gene leads to steatosis and hepatocellular carcinoma in mice. Hepatology 47: 1191–1199, 2008 [DOI] [PMC free article] [PubMed] [Google Scholar]
- 36.Martinez-Chantar ML, Vazquez-Chantada M, Garnacho M, Latasa MU, Varela-Rey M, Dotor J, Santamaria M, Martinez-Cruz LA, Parada LA, Lu SC, and Mato JM. S-adenosylmethionine regulates cytoplasmic HuR via AMP-activated kinase. Gastroenterology 131: 223–232, 2006 [DOI] [PubMed] [Google Scholar]
- 37.Mato JM, Alvarez L, Ortiz P, and Pajares MA. S-adenosylmethionine synthesis: molecular mechanisms and clinical implications. Pharmacol Ther 73: 265–280, 1997 [DOI] [PubMed] [Google Scholar]
- 38.McMillan JM. and Jollow DJ. Galactosamine hepatotoxicity: effect of galactosamine on glutathione resynthesis in rat primary hepatocyte cultures. Toxicol Appl Pharmacol 115: 234–240, 1992 [DOI] [PubMed] [Google Scholar]
- 39.Mudd SH, Brosnan JT, Brosnan ME, Jacobs RL, Stabler SP, Allen RH, Vance DE, and Wagner C. Methyl balance and transmethylation fluxes in humans. Am J Clin Nutr 85: 19–25, 2007 [DOI] [PubMed] [Google Scholar]
- 40.Okada T, Kawakami S, Nakamura Y, Han KH, Ohba K, Aritsuka T, Uchino H, Shimada K, Sekikawa M, Ishii H, and Fukushima M. Amelioration of D-galactosamine-induced acute liver injury in rats by dietary supplementation with betaine derived from sugar beet molasses. Biosci Biotechnol Biochem 75: 1335–1341, 2011 [DOI] [PubMed] [Google Scholar]
- 41.Okamoto K, Tanaka H, Ogawa H, Makino Y, Eguchi H, Hayashi S, Yoshikawa N, Poellinger L, Umesono K, and Makino I. Redox-dependent regulation of nuclear import of the glucocorticoid receptor. J Biol Chem 274: 10363–10371, 1999 [DOI] [PubMed] [Google Scholar]
- 42.Ozturk M, Lemonnier F, Cresteil D, and Lemonnier A. Changes in methionine metabolism induced by D-galactosamine in isolated rat hepatocytes. Biochem Pharmacol 35: 4223–4228, 1986 [DOI] [PubMed] [Google Scholar]
- 43.Ozturk M, Lemonnier F, Cresteil D, Scotto J, and Lemonnier A. Methionine metabolism and ultrastructural changes with D-galactosamine in isolated rat hepatocytes. Chem Biol Interact 51: 63–76, 1984 [DOI] [PubMed] [Google Scholar]
- 44.Pajares MA, Duran C, Corrales F, Pliego MM, and Mato JM. Modulation of rat liver S-adenosylmethionine synthetase activity by glutathione. J Biol Chem 267: 17598–17605, 1992 [PubMed] [Google Scholar]
- 45.Pajares MA. and Markham GD. Methionine adenosyltransferase (S-adenosylmethionine synthetase). Adv Enzymol Relat Areas Mol Biol 78: 449–521, 2011 [DOI] [PubMed] [Google Scholar]
- 46.Pajares MA. and Perez-Sala D. Betaine homocysteine S-methyltransferase: just a regulator of homocysteine metabolism? Cell Mol Life Sci 63: 2792–2803, 2006 [DOI] [PMC free article] [PubMed] [Google Scholar]
- 47.Pfaffl MW. A new mathematical model for relative quantification in real-time RT-PCR. Nucleic Acids Res 29: e45, 2001 [DOI] [PMC free article] [PubMed] [Google Scholar]
- 48.Quintero A, Pedraza CA, Siendones E, Kamal ElSaid AM, Colell A, Garcia-Ruiz C, Montero JL, De la Mata M, Fernandez-Checa JC, Mino G, and Muntane J. PGE1 protection against apoptosis induced by D-galactosamine is not related to the modulation of intracellular free radical production in primary culture of rat hepatocytes. Free Radic Res 36: 345–355, 2002 [DOI] [PubMed] [Google Scholar]
- 49.Radomski N, Kaufmann C, and Dreyer C. Nuclear accumulation of S-adenosylhomocysteine hydrolase in transcriptionally active cells during development of Xenopus laevis. Mol Biol Cell 10: 4283–4298, 1999 [DOI] [PMC free article] [PubMed] [Google Scholar]
- 50.Reytor E, Perez-Miguelsanz J, Alvarez L, Perez-Sala D, and Pajares MA. Conformational signals in the C-terminal domain of methionine adenosyltransferase I/III determine its nucleocytoplasmic distribution. FASEB J 23: 3347–3360, 2009 [DOI] [PubMed] [Google Scholar]
- 51.Rodriguez-Paredes M. and Esteller M. Cancer epigenetics reaches mainstream oncology. Nat Med 17: 330–339, 2011 [DOI] [PubMed] [Google Scholar]
- 52.Ruiz F, Corrales FJ, Miqueo C, and Mato JM. Nitric oxide inactivates rat hepatic methionine adenosyltransferase In vivo by S-nitrosylation. Hepatology 28: 1051–1057, 1998 [DOI] [PubMed] [Google Scholar]
- 53.Sanchez-Gongora E, Ruiz F, Mingorance J, An W, Corrales FJ, and Mato JM. Interaction of liver methionine adenosyltransferase with hydroxyl radical. FASEB J 11: 1013–1019, 1997 [DOI] [PubMed] [Google Scholar]
- 54.Sanchez-Perez GF, Gasset M, Calvete JJ, and Pajares MA. Role of an intrasubunit disulfide in the association state of the cytosolic homo-oligomer methionine adenosyltransferase. J Biol Chem 278: 7285–7293, 2003 [DOI] [PubMed] [Google Scholar]
- 55.Sandoval J. and Esteller M. Cancer epigenomics: beyond genomics. Curr Opin Genet Dev 22: 50–55, 2012 [DOI] [PubMed] [Google Scholar]
- 56.Schnackenberg LK, Chen M, Sun J, Holland RD, Dragan Y, Tong W, Welsh W, and Beger RD. Evaluations of the trans-sulfuration pathway in multiple liver toxicity studies. Toxicol Appl Pharmacol 235: 25–32, 2009 [DOI] [PubMed] [Google Scholar]
- 57.Stover PJ. One-carbon metabolism-genome interactions in folate-associated pathologies. J Nutr 139: 2402–2405, 2009 [DOI] [PMC free article] [PubMed] [Google Scholar]
- 58.Stramentinoli G, Gualano M, and Ideo G. Protective role of S-adenosyl-L-methionine on liver injury induced by D-galactosamine in rats. Biochem Pharmacol 27: 1431–1433, 1978 [DOI] [PubMed] [Google Scholar]
- 59.Vazquez-Chantada M, Fernandez-Ramos D, Embade N, Martinez-Lopez N, Varela-Rey M, Woodhoo A, Luka Z, Wagner C, Anglim PP, Finnell RH, Caballeria J, Laird-Offringa IA, Gorospe M, Lu SC, Mato JM, and Martinez-Chantar ML. HuR/methyl-HuR and AU-rich RNA binding factor 1 regulate the methionine adenosyltransferase expressed during liver proliferation, differentiation, and carcinogenesis. Gastroenterology 138: 1943–1953, 2010 [DOI] [PMC free article] [PubMed] [Google Scholar]
- 60.Xia M, Chen Y, Wang LC, Zandi E, Yang H, Bemanian S, Martinez-Chantar ML, Mato JM, and Lu SC. Novel function and intracellular localization of methionine adenosyltransferase 2{beta} splicing variants. J Biol Chem 285: 20015–20021, 2010 [DOI] [PMC free article] [PubMed] [Google Scholar]
- 61.Yang H, Sadda MR, Yu V, Zeng Y, Lee TD, Ou X, Chen L, and Lu SC. Induction of human methionine adenosyltransferase 2A expression by tumor necrosis factor alpha. Role of NF-kappa B and AP-1. J Biol Chem 278: 50887–50896, 2003 [DOI] [PubMed] [Google Scholar]
- 62.Yeo EJ. and Wagner C. Tissue distribution of glycine N-methyltransferase, a major folate-binding protein of liver. Proc Natl Acad Sci USA 91: 210–214, 1994 [DOI] [PMC free article] [PubMed] [Google Scholar]
Associated Data
This section collects any data citations, data availability statements, or supplementary materials included in this article.