Significance
In this study, we identify nerve-released glial cell line-derived neurotrophic factor (GDNF) family receptor (GFR)α1 as a key factor that enhances perineural invasion (PNI) through GDNF-Ret proto-oncogene (RET) signaling. We demonstrate that GFRα1 is released from nerves in a soluble form and cooperates with secreted GDNF to activate cancer cell surface RET, activating downstream signaling, cancer cell migration, and PNI. These findings advance our understanding of the molecular mechanisms of PNI and define the specific cancer cell requirements necessary for PNI to occur. This work promotes the concept that a ligand and receptor both released by the microenvironment may cooperate together to facilitate cancer invasion. These findings highlight the key participatory role that the nerve microenvironment plays in enabling cancer perineural invasion.
Abstract
The ability of cancer cells to invade along nerves is associated with aggressive disease and diminished patient survival rates. Perineural invasion (PNI) may be mediated by nerve secretion of glial cell line-derived neurotrophic factor (GDNF) attracting cancer cell migration through activation of cell surface Ret proto-oncogene (RET) receptors. GDNF family receptor (GFR)α1 acts as coreceptor with RET, with both required for response to GDNF. We demonstrate that GFRα1 released by nerves enhances PNI, even in the absence of cancer cell GFRα1 expression. Cancer cell migration toward GDNF, RET phosphorylation, and MAPK pathway activity are increased with exposure to soluble GFRα1 in a dose-dependent fashion. Dorsal root ganglia (DRG) release soluble GFRα1, which potentiates RET activation and cancer cell migration. In vitro DRG coculture assays of PNI show diminished PNI with DRG from GFRα1+/− mice compared with GFRα1+/+ mice. An in vivo murine model of PNI demonstrates that cancer cells lacking GFRα1 maintain an ability to invade nerves and impair nerve function, whereas those lacking RET lose this ability. A tissue microarray of human pancreatic ductal adenocarcinomas demonstrates wide variance of cancer cell GFRα1 expression, suggesting an alternate source of GFRα1 in PNI. These findings collectively demonstrate that GFRα1 released by nerves enhances PNI through GDNF-RET signaling and that GFRα1 expression by cancer cells enhances but is not required for PNI. These results advance a mechanistic understanding of PNI and implicate the nerve itself as a key facilitator of this adverse cancer cell behavior.
Perineural invasion (PNI) is a mode of cancer progression in which tumor cells invade in, around, or along nerves (1). PNI is widely recognized as a highly adverse prognostic factor associated with paralysis, pain, paresthesia, increased cancer recurrence, and diminished patient survival (2, 3). PNI is a relatively common event for some cancer types including pancreatic, head and neck, prostate, stomach, colon, biliary tract, and other cancers (2–6).
The molecular mechanisms underlying PNI remain poorly understood. Recent theories have suggested that nerve microenvironment may release chemotactic factors that attract cancer cells (2, 3). Glial cell line-derived neurotrophic factor (GDNF) is secreted by neurons and nerve supporting cells and plays a critical role in nerve development and axonal guidance. GDNF has been previously shown to be able to induce cancer cell migration (7, 8). GDNF first binds to GDNF family receptor (GFR)α1, which is a glycosyl-phosphatidylinositol (GPI)-anchored protein (9). This complex then binds to and activates the transmembrane Ret proto-oncogene (RET) receptor, inducing phosphorylation of RET tyrosine residues and initiating signal transduction (10). GFRα1 and RET must therefore interact together for a response to GDNF to occur through this receptor mechanism (9, 10). GDNF may also signal through alternate receptors including neural cell adhesion molecule (NCAM) and syndecan-3 (11–13).
Our group has demonstrated that nerve-secreted GDNF serves as a key chemoattractant for cancer cells in the process of PNI. Activated RET on the cancer cell triggers the MAPK pathway and induces cell migration toward nerves in both in vitro and in vivo models of PNI (8). The inhibition of GDNF or RET inhibits this process. Therefore, GDNF-RET activity appears to be a significant mechanism of chemotactic signaling that participates in PNI. In these models, multiple cancer cell lines exhibiting PNI in response to GDNF expressed both RET and GFRα1.
GDNF-RET signaling plays a fundamental role in nerve development and organogenesis. Interestingly, it has been previously shown that cell surface RET may be activated by GFRα1 cellular expression (cis) or by its noncellular presence (trans) in either a soluble or immobilized state (14, 15). Soluble GFRα1 molecules may capture GDNF and then present it to cell surface RET receptors for signal activation. GFRα1 can be released from the surface of neuronal cells, Schwann cells, and explants of sciatic nerve (14). Trauma to a nerve may facilitate such a release of GFRα1. We reasoned that the process of PNI entails a traumatic event to the nerve that might also lead to a release of soluble GFRα1.
These concepts led to our current hypothesis that soluble GFRα1 released from nerves may enhance cancer cell PNI through activation of RET and downstream signal transduction. Findings from this study may improve our understanding of the mechanisms underlying PNI and elucidate the cancer cell requirements necessary for PNI to occur.
Results
Expression of RET and GFRα1 in Cell Lines.
Human pancreatic adenocarcinoma MiaPaCa-2 cells were transfected with siRNA targeting RET, GFRα1, or nontargeting control. Murine fibroblast 3T3 cells, which express neither RET nor GFRα1, underwent stable transfection with either RET alone or RET and GFRα1. RET and GFRα1 expression was measured in MiaPaCa-2 siControl, MiaPaCa-2 siGFRα1, MiaPaCa-2 siRET, 3T3, 3T3-RET, and 3T3-RET-GFRα1 cells. RET mRNA was detected in MiaPaCa-2 siControl and siGFRα1 but not in siRET. RET mRNA was also detected in 3T3/RET and 3T3-RET-GFRα1 but not in 3T3. Similarly, GFRα1 mRNA was detected in MiaPaCa-2 siControl and siRET but not in siGFRα1. GFRα1 mRNA was also detected in 3T3-RET-GFRα1 but not in 3T3-RET or 3T3 (Fig. 1 A and B). To assess for protein expression, immunofluorescence microscopy was performed which confirmed similar results in these series of MiaPaCa-2 and 3T3 cell lines (Fig. 1C).
Fig. 1.
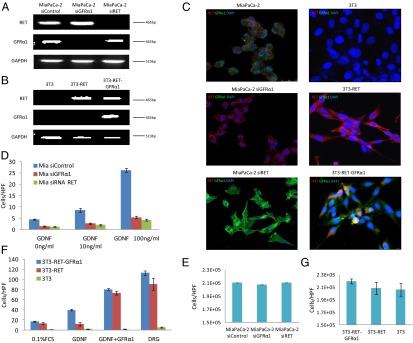
Generated cell lines were characterized. (A and B) Expression of RET and GFRα1 mRNA by generated MiaPaCa-2 and 3T3 cell lines. (C) Immunofluorescence microscopy for RET (red), GFRα1 (green), and DAPI (blue) in generated MiaPaCa-2 and 3T3 cell lines. (D) Boyden chamber migration assays using glial cell line-derived neurotrophic factor (GDNF) as an attractant over 24 h for MiaPaCa-2 derived cell lines. (E) MiaPaCa-2 siRNA control, siRNA RET, and siRNA GFRa1 cell proliferation over 24 h. (F) Boyden chamber migration assays using GDNF, GDNF plus soluble GFRα1-Fc fusion protein, or excised murine DRG as an attractant over 24 h for 3T3-derived cell lines. (G) 3T3-RET-GFRα1, 3T3-RET, and 3T3 cell proliferation are similar over 24 h.
GDNF-Mediated Cell Migration Requires both RET and GFRα1.
We assessed the ability of MiaPaCa2 siControl, siGFRα1, and siRET to migrate toward GDNF in Boyden chambers. MiaPaCa-2 siControl showed increased migration toward a higher concentration of GDNF, whereas MiaPaCa-2 siGFRα1 and MiaPaCa-2 siRET migration failed to increase (Fig. 1D). These findings confirm that the presence of RET and GFRα1 are both necessary for GDNF-mediated cell migration. Similar results were noted for 3T3 cells; 3T3 cells transfected with both RET and GFRα1 migrated toward GDNF (Fig. 1F). In contrast, 3T3 cells or 3T3 cells transfected with RET alone were unresponsive to GDNF.
Soluble GFRα1 Potentiates GDNF-Mediated Cell Migration.
We used the 3T3-RET and 3T3-RET-GFRα1 cell lines to assess the effect of soluble GFRα1 on cell migration. Boyden chamber migration assays were performed using different attractants including (i) GDNF, (ii) GDNF with soluble GFRα1, and (iii) dorsal root ganglia (DRG) containing live nerve and supporting cells; 3T3-RET-GFRα1 cells demonstrated significant migration toward GDNF, in contrast to the 3T3-RET and 3T3 cells, which failed to migrate toward GDNF. Interestingly, we found that a soluble, recombinant GFRα1-Fc fusion protein added to GDNF was able to significantly enhance the cell migration of both 3T3-RET-GFRα1 and 3T3-RET cells to an equivalent, robust level (Fig. 1F). In contrast, 3T3 cells (lacking RET) remain unresponsive to GDNF with soluble GFRα1. This key finding suggests that (i) GFRα1 is able to act as a soluble factor to enable GDNF-RET signaling, even when absent from the cancer cell; (ii) soluble GFRα1 may further enhance GDNF-RET signaling even when cellular GFRα1 is present and functional; and (iii) RET expression is necessary for GDNF-mediated migration in this system.
DRG contain a variety of cell types including nerves, glial cells, fibroblasts, and microglial cells. DRG are a known source of GDNF and may secrete many other growth factors and chemokines (8, 16). When used as a chemoattractant, DRG explants stimulated the robust migration by both 3T3-RET-GFRα1 and 3T3-RET cells, suggesting that DRG may be secreting GFRα1 and/or other factors to enhance migration; 3T3 cells (lacking RET) remain unresponsive to migration toward DRG, showing that cell migration requires RET signaling in this system.
Differences in proliferation between these cell lines might potentially confound migration results. To account for this variable, cell proliferation studies were performed on all cell lines that showed no significant differences 24 h after plating (Fig. 1 E and G).
Soluble GFRα1 Enhances GDNF-Mediated Cell Migration and MAPK Pathway Activity.
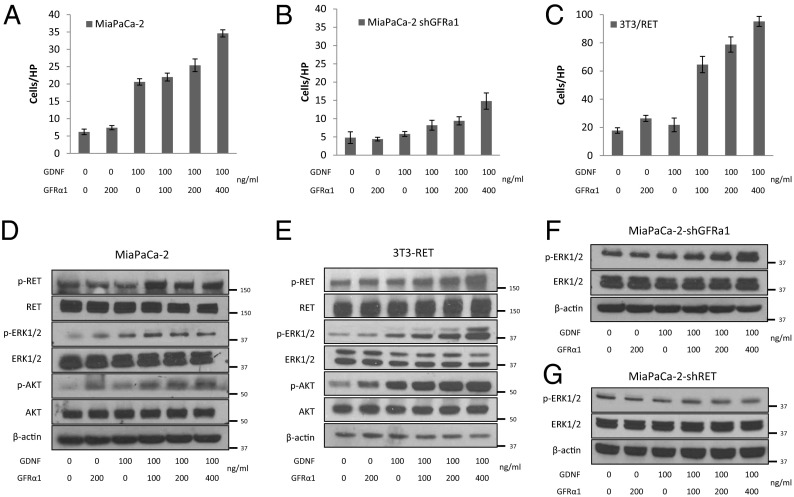
Adding a gradient of soluble GFRα1 to GDNF as a Boyden chamber attractant exerted dose–response effects on cell migration for the three RET-expressing cell lines MiaPaCa-2, MiaPaCa-2 shGFRα1, and 3T3-RET (Fig. 2 A–C). Soluble GFRα1 in the absence of GDNF had little or no effect on migration. The increase in migration by MiaPaCa-2 cells following exposure to soluble GFRα1 plus GDNF was even greater than the migratory response of MiaPaCa-2 shGFRα1 cells (Fig. 2 A and B). This finding suggests that the presence of soluble GFRα1 is functionally relevant toward cancer chemotaxis in the presence of endogenous cancer cell GFRα1 expression; 3T3-RET also demonstrated a robust migratory response to GDNF plus soluble GFRα1 in a dose-dependent fashion (Fig. 2C).
Fig. 2.
Soluble GFRα1 promotes cell migration toward GDNF and RET activation. (A–C) MiaPaCa-2, MiaPaCa-2 shGFRα1, and 3T3-RET cell line Boyden chamber migration assays over 24 h using varying concentrations of GDNF and soluble GFRα1 as attractants. (D–G) Western blots of proteins isolated from MiaPaCa-2, 3T3-RET, MiaPaCa-2–shGFRα1, and MiaPaCa-2–shRET cells undergoing Boyden chamber migration assays at conditions identical to A–C.
Downstream phosphoprotein expression was measured from cells undergoing these migration assays at identical conditions. GDNF-RET signaling may induce MiaPaCa-2 cell migration through MAPK pathway signaling (7, 8). Western blotting demonstrated that p-RET, p-ERK1/2, and pAKT expression increase with exposure of soluble GFRα1 and GDNF to both MiaPaCa-2 cells (Fig. 2D) and 3T3-RET cells (Fig. 2E). MiaPaCa-2 shGFRα1 cells fail to show activation of p-ERK1/2 following exposure to either soluble GFRα1 or GDNF alone; however, p-ERK1/2 is activated following exposure to GDNF when combined with soluble GFRα1 (Fig. 2F). MiaPaCa-2 shRET cells fail to show any activation of p-ERK1/2 following exposure to GDNF either with, or without, the addition of soluble GFRα1 (Fig. 2G), demonstrating that the presence of RET is required for activation of this pathway.
Soluble GFRα1 Is Released by DRG and Enhances Cell Migration.
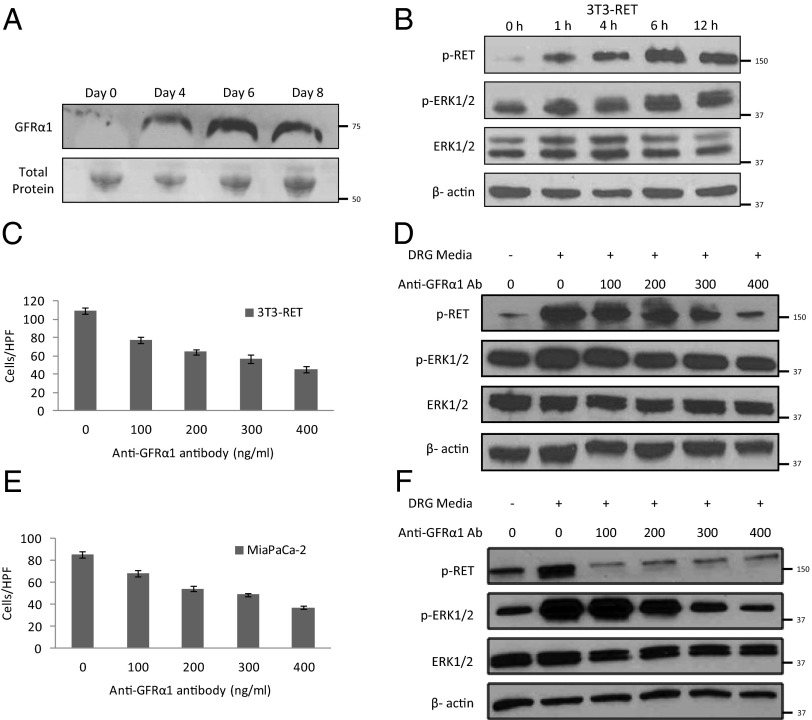
Conditioned media from DRG cultures were collected 4, 6, and 8 d after excised murine DRG were placed in Matrigel. Media samples were concentrated and underwent Western blotting. GFRα1 was detected by day 4, with increasing expression at day 6 (Fig. 3A). This demonstrates that GFRα1 is gradually released by explants of murine DRG.
Fig. 3.
DRG release soluble GFRα1 that promotes cell migration and RET activation. (A) Conditioned media from excised murine DRG following 0, 4, 6, or 8 d of exposure were concentrated and underwent Western blotting to detect released GFRα1. Total protein measured by Ponceau staining was used as a loading control. (B) 3T3-RET cells were cocultured with DRG from 0 to 12 h, and protein was isolated for Western blotting. (C and D) 3T3-RET cells underwent Boyden chamber migration assays over 24 h using conditioned media from DRG as an attractant with the addition of varying concentrations of an anti-GFRα1 antibody; Western blots were performed at parallel conditions. (E and F) MiaPaCa-2 cells underwent Boyden chamber migration assays over 24 h using conditioned media from DRG as an attractant with the addition of varying concentrations of an anti-GFRα1 antibody; Western blots were performed at parallel conditions.
Conditioned media from DRG cultures were added to 3T3-RET cells, which then underwent Western blotting. A time course demonstrates activation of p-RET and p-ERK1/2 over time, indirectly suggesting the presence of GDNF and GFRα1 within the conditioned media by showing their downstream functional effects (Fig. 3B). Boyden chamber migration assays were performed using conditioned media from DRG cultures as the attractant. Increasing concentrations of anti-GFRα1 antibody were added to the conditioned media; 3T3-RET cells exhibited an inhibition of migration toward DRG conditioned media with increasing concentrations of anti-GFRα1 antibody, demonstrating the importance of soluble GFRα1 for migration (Fig. 3C). Downstream phosphoprotein expression was measured in 3T3-RET cells undergoing migration assays at identical conditions. A decrease of p-RET and p-ERK1/2 expression was noted with increasing concentrations of anti-GFRα1 antibody (Fig. 3D). Similar results were noted when using MiaPaCa-2 cells (Fig. 3 E and F).
Perineural Invasion in Vitro Is Potentiated by GFRα1 Released from DRG.
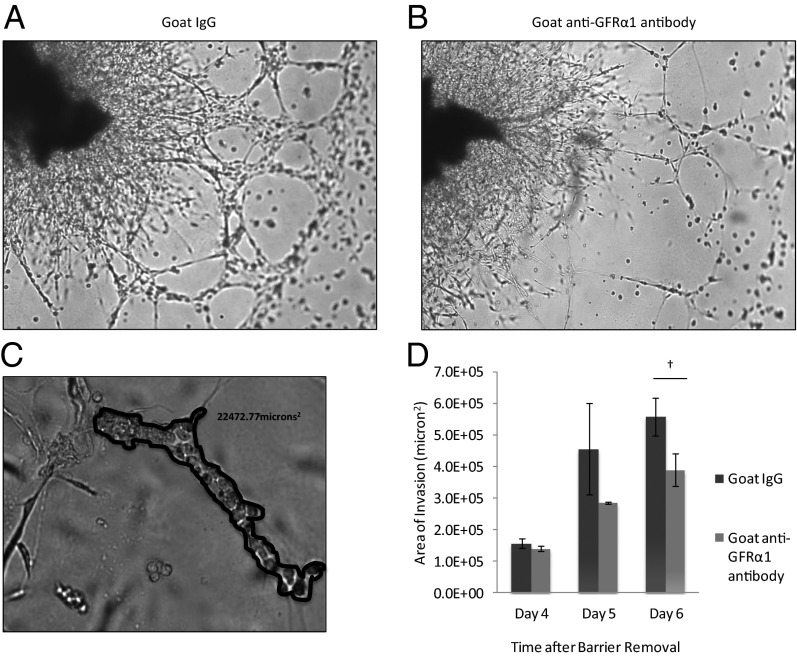
An in vitro coculture assay to assess cancer–nerve interactions and quantify the degree of PNI has been optimized (8, 16, 17). Excised DRG are grown in Matrigel, and MiaPaCa-2 cancer cells are added to the media. MiaPaCa-2 invades the Matrigel, associates with neurites, and migrates along the neurites toward the center of the DRG. To assess the role of GFRα1 in this process, anti-GFRα1 antibody was added to the media, which may block cancer cell surface GFRα1 and also diffuse into the Matrigel to potentially block DRG-released GFRα1. By day 6, anti-GFRα1 antibody significantly reduced the area of nerve invasion by cancer cells compared with control IgG (Fig. 4 A–D). The penetration of antibody throughout the Matrigel may be limited, and therefore these results likely represent partial rather than maximal effects. These findings show that GFRα1 facilitates PNI by MiaPaCa2 in this in vitro model.
Fig. 4.
GFRα1 potentiates PNI in a nerve–cancer coculture in vitro assay. (A) Coculture of murine DRG with MiaPaCa-2 cells in Matrigel permits assessment of the degree of PNI. By day 6, MiaPaCa-2 cells exposed to IgG as a control condition exhibit robust invasion, extending along neurites from the DRG. (B) DRG–MiaPaCa-2 coculture assay of PNI, when exposed to anti-GFRα1 antibody, demonstrates diminished PNI at day 6 compared with control (A). (C) The degree of PNI may be quantified in the DRG–MiaPaCa-2 coculture assay. Areas where MiaPaCa-2 cells are in direct contact with DRG neurites were demarcated, and the area was calculated using MetaMorph software. (D) The mean total area of invasion is compared between control IgG and anti-GFRα1 antibody exposed DRG–MiaPaCa-2 coculture assays (†P < 0.05; t test).
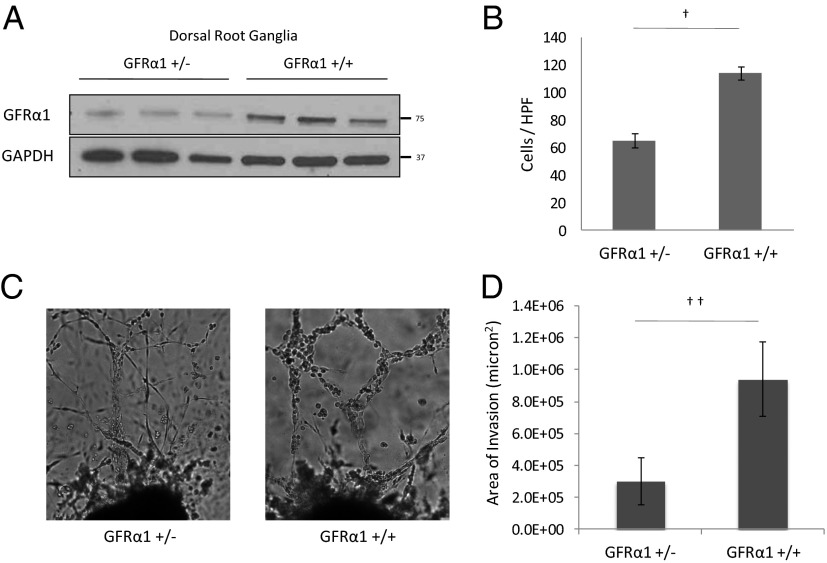
To study the effects of altering GFRα1 expression by the DRG in this model, we obtained GFRα1+/− heterozygote mice. GFRα1−/− homozygous deleted mice were not usable because they die within 24 h of birth with kidney agenesis and a lack of enteric neurons (18). Protein isolated from whole-cell lysates of the DRG was assessed for GFRα1 expression and demonstrated consistently diminished expression in the GFRα1+/− DRG compared with the wild-type GFRα1+/+DRG (Fig. 5A).
Fig. 5.
DRG from GFRα1+/− mice attract less cancer cell migration and less PNI compared with DRG from wild-type GFRα1+/+ mice. (A) Protein isolated from lysed DRG from GFRα1+/− and GFRα1+/+ mice underwent Western blotting for GFRα1. (B) The migration of MiaPaCa-2 shGFRα1 in Boyden chamber assays was quantified using GFRα1+/− DRG or GFRα1+/+ DRG as an attractant (†P < 0.001; t test). (C) DRG coculture assays were performed using MiaPaCa-2 shGFRα1 cells. Greater PNI was noted with GFRα1+/+ DRG compared with GFRα1+/− DRG. (D) The average area of invasion by MiaPaCa-2 shGFRα1 cells in DRG assays using GFRα1+/− DRG compared with GFRα1+/+ DRG (††P < 0.05; t test).
We selected MiaPaCa-2 shGFRα1 cells to use for experimental comparisons of GFRα1+/− to GFRα1+/+ DRG. The silencing of cellular GFRα1 may accentuate measurable differences in cell behavior induced by nerve-released GFRα1. Boyden chamber migration of MiaPaCa-2 shGFRα1 cells toward GFRα1+/− DRG as an attractant was reduced to 57% that of control GFRα1+/+ DRG (Fig. 5B). This reduction demonstrates that reduced levels of soluble GFRα1 released from DRG lead to diminished cancer cell migration toward nerves and their supporting cells.
We performed in vitro coculture assays of DRG and MiaPaCa-2 shGFRα1 cells and either GFRα1+/− DRG or GFRα1+/+ DRG. DRG harvested from GFRα1+/− and GFRα1+/+ mice exhibited similar morphology. However, the area of nerve invasion was significantly reduced in the GFRα1+/− DRG groups compared with the control GFRα1+/+ DRG groups (Fig. 5 C and D). These results demonstrate that the GFRα1 expression by nerves is an important factor in facilitating perineural nerve invasion, particularly in the context of low cancer cell GFRα1 expression.
Cancer Cell Expression of GFRα1 Is Not Required for Perineural Invasion in Vivo.
The GFRα1+/− heterozygote mice are from a C57BL/6J strain that will not support human pancreatic MiaPaCa-2 tumor formation in vivo. Because both RET and GFRα1 coreceptors must cooperate together to induce GDNF effects (9, 10), a demonstration of PNI in vivo by cancer cells lacking endogenous cell surface GFRα1 would implicate its substitution in soluble form by the nerve microenvironment. We therefore sought to demonstrate that cancer cell GFRα1 is nonessential for PNI in a system where soluble GFRα1 may be released by nerves. We reasoned that cancer cell RET expression would, in contrast, be required for this process.
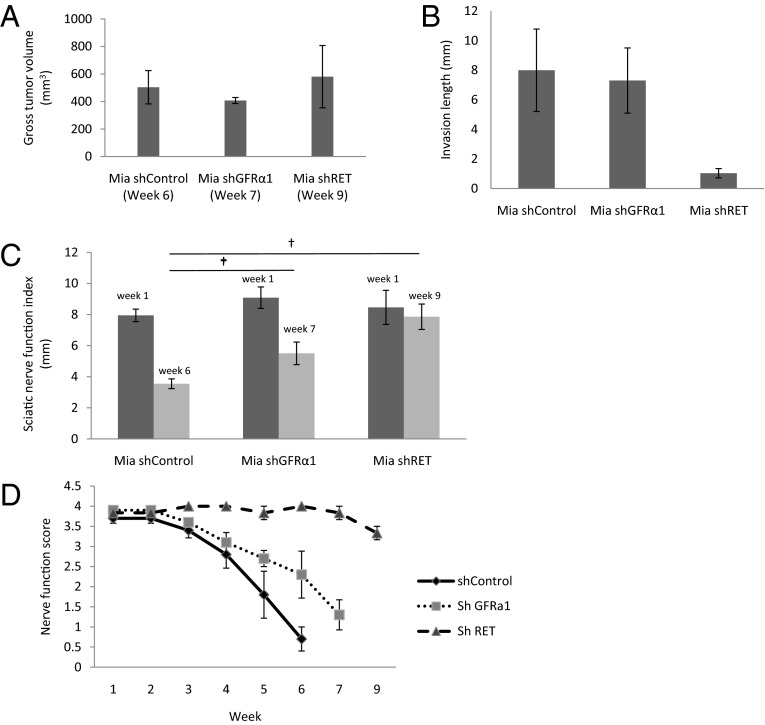
MiaPaCa-2 shControl, shGFRα1, and shRET cancer cells were injected into surgically exposed murine sciatic nerves of mice under anesthesia to form tumors. These primary sciatic nerve tumors grew at varying rates; shControl tumors at week 6 were of comparable volume to shGFRα1 tumors at week 7 and shRET tumors at week 9. To control for differing tumor volumes potentially confounding our assessment of PNI, we compared our end points at these different time points, when the primary sciatic nerve tumor volumes were equitable across the different experimental conditions (Fig. 6A).
Fig. 6.
A murine model of sciatic nerve PNI demonstrates that cancer cells lacking GFRα1 still maintain the ability to invade nerves. (A) Sciatic nerve tumors were grown in mice after implantation of Mia shControl, Mia shGFRα1, and Mia shRET cells (n = 4 per group). Tumors grew at varying rates. Tumor volumes at the time of sacrifice are demonstrated; comparisons were made between groups at these different time points to standardize tumor volume. (B) Sciatic nerve-invasion length was measured at the time of animal sacrifice (week 6 for Mia shControl, week 7 for Mia shGFRα1, week 9 for Mia shRET). (C) The sciatic nerve index (hind paw span) is a measure of sciatic nerve function and was measured at week 1 and at weeks 6, 7, and 9 (†P < 0.01; t test). (D) Nerve function scores (a measure of hind limb function) were measured weekly for each group.
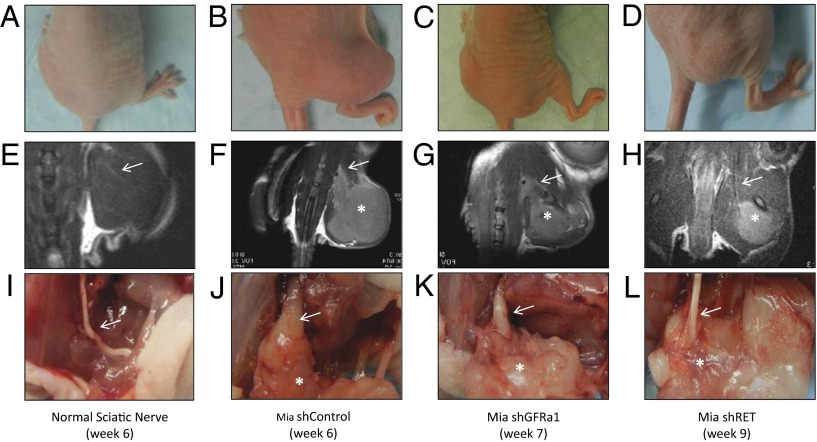
Mice with MiaPaCa-2 shControl tumors suffered progressive ipsilateral hind limb paralysis over 6 wk, with a decrease in hind paw width (Figs. 6 C and D and 7B). These animals also exhibited an 8-mm mean length of proximal PNI (Fig. 6B), with PNI confirmed by magnetic resonance imaging (MRI) and seen on gross and histological evaluation of the excised proximal sciatic nerve (Figs. 7 F and J and 8B).
Fig. 7.
Gross, MRI, and surgical images of sciatic nerve PNI by cancer cells lacking GFRα1 maintaining an ability to invade nerves. (A–D) Representative mice bearing no tumor, Mia shControl tumor, Mia shGFRα1 tumor, or Mia shRET tumor, respectively, in the right sciatic nerve at the indicated time points. The Mia shControl and Mia shGFRα1 mice demonstrate right hind limb paralysis, whereas the Mia shRET and normal mice have intact hind limb function. (E–H) Representative T2-weighted MRI images of mice. The Mia shControl and Mia shGFRα1 tumors demonstrate thickened sciatic nerves (arrows), whereas the Mia shRET tumor and non–tumor-bearing animal show normal caliber sciatic nerves (arrows). (I–L) Representative sciatic nerves at sacrifice with tumor exposure. The Mia shControl and Mia shGFRα1 tumors (asterisks) both demonstrate thickened and invaded sciatic nerves, with the Mia shGFRα1 nerves less severely infiltrated. In contrast, Mia shRET tumor (asterisk) and non–tumor-bearing animal show normal caliber sciatic nerves.
Fig. 8.
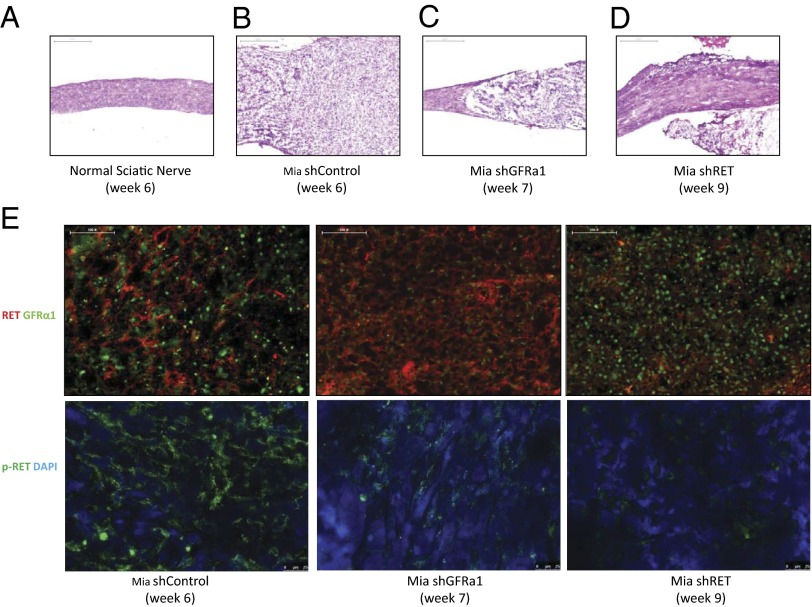
Histologic images of proximal sciatic nerve PNI by cancer cells lacking GFRα1 maintain an ability to invade nerves. (A) H&E-stained normal proximal sciatic nerve 6 wk after injection with PBS shows normal proximal sciatic nerve histology and caliber. (Scale bar, 500 µm.) (B) H&E-stained proximal sciatic nerve 6 wk after injection with Mia shControl cells demonstrates extensive PNI with expansion of the nerve by infiltrating tumor cells. (Scale bar, 500 µm.) (C) H&E-stained proximal sciatic nerve 7 wk after injection with Mia shGFRα1 cells demonstrates proximal sciatic PNI, although to a lesser severity compared with the shControl cells. (Scale bar, 500 µm.) (D) H&E-stained proximal sciatic nerve 9 wk after injection with Mia shRET cells demonstrates no significant PNI. (Scale bar, 500 µm.) (E) Immunofluorescence microscopy was performed on excised Mia shControl, shRET, and shGFRα1 primary sciatic nerve tumors stained for RET and GFRα1 expression (upper images) and p-RET expression (lower images) with DAPI nuclear staining. (Scale bar, 100 µm.)
In marked contrast, MiaPaCa-2 shRET tumors failed to develop any evidence of paralysis over 9 wk and maintained intact hind paw width (Figs. 6 C and D and 7D). These animals showed no significant length of PNI (Fig. 6B), with an absence of proximal PNI on MRI and by gross and histologic evaluation of the excised sciatic nerve (Figs. 7 H and L and 8D). Cancer cell expression of RET is clearly required for PNI in this model.
Interestingly, MiaPaCa-2 shGFRα1 tumors exhibited significant PNI. These animals exhibited a 7-mm mean length of PNI (Fig. 6B), with PNI confirmed by MRI and seen on gross and histological evaluation of the proximal sciatic nerve (Figs. 7 G and K and 8C). The extent of PNI is slightly less than that of shControl tumors (Fig. 7 F and J). Similarly, assays of sciatic nerve function demonstrate that shGFRα1 tumors induce progressive ipsilateral hind limb paralysis and a decrease in hind paw width over 6 wk (Figs. 6 C and D and 7C). The degree of paralysis is slightly less severe compared with that induced by shControl tumors but nonetheless induces significant deficits. These results collectively suggest that cancer cell surface GFRα1 may facilitate PNI but is not required due to alternate sources of GFRα1 being released from the nerve microenvironment. In contrast, cancer cell RET is required for PNI to occur.
Expression of RET, p-RET, and GFRα1 in Murine Sciatic Nerve Tumors.
MiaPaCa-2 shControl, shGFRα1, and shRET tumors were grown in vivo in the sciatic nerves of mice. We performed histologic assessment of the sciatic nerve at a site proximal to the location of the tumor implantation, to evaluate for PNI. Hematoxylin/eosin (H&E) staining demonstrates extensive PNI of the proximal sciatic nerve in the shControl tumors. In contrast, shRET tumors demonstrate completely normal proximal sciatic nerves without any PNI, whereas shGFRα1 tumors demonstrate an intermediate degree of PNI (Fig. 8 A–D).
We assessed the primary sciatic nerve tumors for RET, p-RET, and GFRα1 expression by immunofluorescence staining at the conclusion of the animal experiments. Immunofluorescence staining showed expression of both RET and GFRα1 in the MiaPaCa-2 shControl tumors, as well as robust p-RET expression. MiaPaCa2 shGFRα1 tumors expressed low levels of GFRα1 and intact RET expression, with p-RET detectable at an intermediate level. This finding suggests that an alternate source of GFRα1 is being supplied by the nerve microenvironment to permit some degree of RET activation to occur. MiaPaCa2 shRET tumors lacked expression of RET and p-RET but retained GFRα1 expression (Fig. 8E). These studies confirm the sustained silencing of RET and GFRα1 in the shRNA transfected cell lines over the course of the animal experiments.
GFRα1 Expression in a Tissue Microarray of Pancreatic Adenocarcinomas.
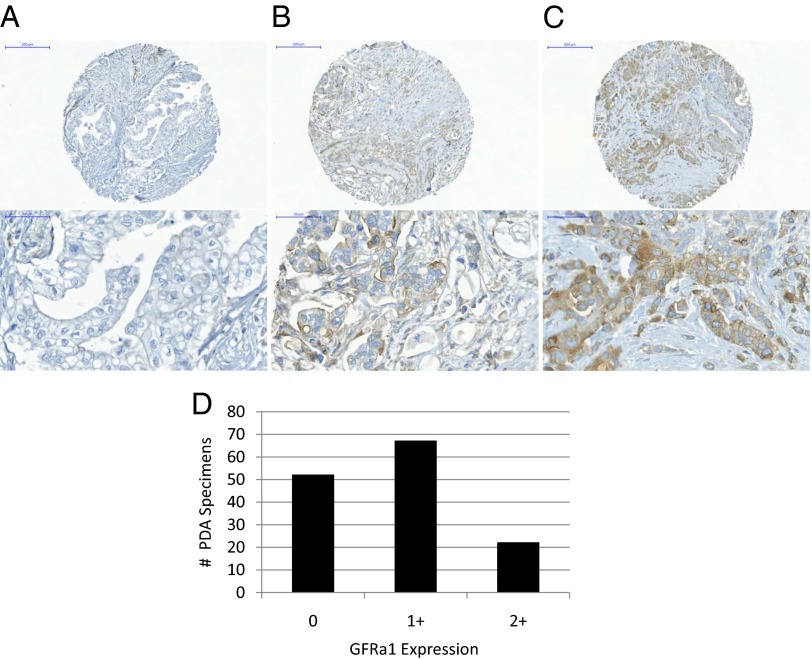
A tissue microarray was constructed from 141 surgically excised human pancreatic ductal adenocarcinomas, with each tumor specimen cored in triplicate, to create an array of 423 samples. Immunohistochemical staining for GFRα1 was performed on this array which was read by an experienced pathologist. The results (Fig. 9) demonstrate that 52 cases stained 0 (negative), 67 cases stained 1+ (mild-moderately positive), and 22 cases stained 2+ (strongly positive). These findings demonstrate a broad variance of GFRa1 expression by these cancers, with a significant proportion of cases failing to express detectable GFRa1 by immunohistochemistry (IHC) (37%).
Fig. 9.
A tissue microarray of 141 surgically excised human pancreatic ductal adenocarcinomas, in which PNI is nearly ubiquitous, was assessed by immunohistochemistry for cancer cell GFRα1 expression. (A–C) Representative sections of GFRα1 0 (A), 1+ (B), and 2+ (C) specimens are shown. (D) Wide variance in expression was noted, with 52 cases staining 0 (negative), 67 cases stained 1+ (mild to moderately positive), and 22 cases stained 2+ (strongly positive).
Discussion
PNI is an ominous clinical problem in which cancer cells are found to invade and track along nerves, often extending toward the central nervous system. This insidious process permits unpredictable cancer progression beyond the expected anatomic extent of a tumor mass, making complete surgical resection more difficult and requiring large radiation fields designed to cover the affected nerves (16). PNI may also cause significant morbidity, inducing paralysis, pain, or paresthesias of the affected nerves, and is associated with elevated cancer recurrence rates and poor patient survival (2–6). Cancers located in anatomically nerve-rich environments may be more prone to PNI, including pancreatic, prostate, and head and neck cancers among others.
The precise molecular mechanisms underlying PNI remain unclear. Most current theories suggest that reciprocal signaling and interactions occur between cancer cells and the nerve microenvironment induce this event (2, 3). A variety of neurotrophins and chemokines secreted by the nerve microenvironment may affect cancer cell migratory and invasive ability, proliferation, and promote PNI. Differentially expressed cancer genes, proteases, and adhesion molecule expression may also play important roles (3). The potential interaction of these many factors may lead to complex theoretical models of PNI.
We previously reported on the central role that GDNF-RET receptor signaling plays in models of PNI (8). GDNF is important for neuronal survival and differentiation and is also essential for kidney development and spermatogenesis. To exert its effect as a ligand for the RET receptor, GDNF first binds to GFRα, a GPI-anchored receptor. Two GFRα molecules bring together two RET molecules to form a functional receptor complex. RET phosphorylation activates signaling pathways that induce morphological transformation and cell migration. GFRα is required for GDNF signaling through RET (9). Our previous studies revealed that both RET and GFRα1 were expressed by cancer cell lines able to exhibit PNI (8). These findings had initially suggested that the expression of both coreceptors on the cancer cells might be required for PNI to occur.
However, Paratcha et al. demonstrated that GFRα1 may be released from nerves as a soluble factor and in this form may exert functional important effects on neuronal survival and differentiation through RET signaling (14). Soluble GFRα1 may also serve as a guidance signal for developing neuronal axons expressing the RET receptor (15). These findings led to our realization that nerve-released, soluble GFRα1 might also enhance the function of GDNF as a chemoattractant for cancer cells in PNI. This concept suggests that cancer cell GFRα1 expression is not necessarily a requirement for PNI to occur. Interestingly, GFRα1 is released following crush injury to rat sciatic nerves, suggesting that a physiologic release may accompany injury response (14). We reasoned that cancer infiltration into nerves might plausibly elicit a similar GFRα1 release to potentiate nerve-secreted GNDF, leading to an environment that enhances nerve–cancer interactions and facilitates PNI.
We demonstrate that the GPI-anchored GFRα1 receptor, located on cell surfaces, may also be released from nerves and function in a soluble form as a receptor to GDNF to activate RET to induce cancer cell migration and PNI. DRG harvested from a GFRα1+/− heterozygote mouse release ∼60% the amount of GFRα1 as control GFRα1+/+ mice. We showed that cancer cell migration and area of PNI are both significantly diminished using GFRα1+/− DRG, compared with control GFRα1+/+ DRG. These studies demonstrate that nerve-derived GFRα1 plays a participatory role in enabling PNI. In this model of PNI, the nerve releases both a ligand (GDNF) and a soluble receptor to that ligand (GFRα1) that together form a complex with cancer cell surface RET and activate of downstream RET signaling. These events promote cancer cell migration toward and invasion of the nerve.
These results also demonstrate that GFRα1 expression by cancer cells is not a requirement for PNI to occur. Cell lines lacking GFRα1 (MiaPaCa-2 shGFRα1 and 3T3-RET) show migration toward GDNF with the addition of soluble GFRα1. An in vitro assay of PNI demonstrated significant areas of PNI by MiaPaCa-2 shGFRα1 cocultured with control GFRα1+/+ DRG, suggesting that the DRG supplies the necessary GFRα1 lacking in the cancer cells to enable GDNF activation of RET. We observed a significant decrease in the area of PNI with the substitution of GFRα1+/+ DRG with GFRα1+/− DRG, which release lower amounts of GFRα1. A murine sciatic nerve model of PNI confirms that cancer cells lacking GFRα1, but expressing RET, maintained a robust ability to invade along sciatic nerves. In contrast, cancer cells lacking RET were unable to invade along nerves. Because GFRα1 is necessary for GDNF-RET signaling, the results in this system imply that the GFRα1 receptor is provided by the nerve rather than the cancer cell. We show that although cancer cell RET receptor expression is required for GDNF-mediated PNI, cancer cell GFRα1 receptor expression is not necessary because it may be supplied in soluble form by the nerve. Secreted GDNF may be captured by soluble GFRα1 in extracellular space and then bind to and activate cell surface RET (14).
To assess for the clinical relevance of this mechanism, we assessed the range of expression of GFRα1 by pancreatic adenocarcinomas (PDAs), a malignancy in which PNI is nearly ubiquitous. Pathologic studies have suggested that nearly 100% of PDA specimens will be found to exhibit PNI, if enough sections are evaluated at thin slices, suggesting that nearly all of PDAs possess an innate ability to invade nerves (2, 3, 19, 20). GDNF-RET signaling, a key feature of pancreatic PNI (9), is dependent on the cooperation of both the RET and the GFRα1 coreceptors for functional activity. If a significant variance in GFRa1 expression is noted in these cancers, then this evidence would support the concept that exogenously supplied GFRα1 (from nerves) is playing an important role in the GDNF-RET-GFRα1 signaling, supporting the process PNI. A tissue microarray was constructed from 141 human primary pancreatic ductal adenocarcinomas. Immunohistochemical staining for GFRα1 demonstrated a broad variance of GFRα1 expression by these cancers, ranging from 0 to 2+, with a significant proportion of cases failing to express detectable GFRa1 by IHC (37%). These findings strongly suggest that the provision of soluble GFRα1 by the nerve microenvironment is playing a clinically relevant role in promoting PNI.
This study has several limitations. (i) The absence of a viable GFRα1−/− knockout mouse precludes evaluation of cancer GDNF chemotaxis and PNI in the absence of soluble GFRα1−/−. (ii) Although the GFRα1+/− heterozygote knockout mouse is useful for coculture assays with excised DRG, the immunocompetent C57BL/6J strain does not permit sciatic nerve tumor generation for in vivo PNI assessment. (iii) We noted variation in sciatic nerve tumor growth rates of the genetically modified cell lines that may confound fair comparisons of the degree of PNI that is assessed in vivo. To account for this variable, experimental groups were compared when the total sciatic nerve tumor volume was equitable across groups, rather than at a single time point. (iv) Because pancreatic cancer tissues may be heterogeneous, the triplicate tissue microarray cores may not necessarily be completely representative of the entire tumor in our assessment of GFRα1 expression by pancreatic cancer.
We demonstrate that during PNI, the nerve releases a soluble form of GFRα1. Released GFRα1 serves as a critical coreceptor that joins with cancer surface RET receptor to enable cancer cell migration and PNI in response to nerve-secreted GDNF. Nerve-released GDNF and GFRα1 enable cancer RET signaling and PNI progression, even in the absence of cancer cell GFRα1 expression. Interestingly, GFRα1 release has been described in axonal guidance during nerve development, suggesting that this mechanism is conserved between two very different biological processes. The enhancement of PNI by released GFRα1 is an example of how the nerve microenvironment is a very active participant, rather than a passive bystander in this pathological process.
This work promotes the concept that a ligand and receptor both released by the microenvironment may cooperate together to facilitate cancer invasion. The molecular mechanisms of PNI may originate from normal neuronal physiologic processes that are exploited by cancer cells. These findings contribute to a comprehensive understanding of the molecular events underlying PNI and help to elucidate the cancer cell requirements that are necessary for PNI. Such investigation elucidating these mechanisms may facilitate for the optimal design of future therapeutic strategies intended to disrupt these interactions.
Materials and Methods
Cell Lines and Mice.
Human pancreatic adenocarcinoma MiaPaCa-2 (American Type Culture Collection) and the murine fibroblast cell line 3T3 were grown in Dulbecco’s modified Eagle medium (DMEM) containing 10% (vol/vol) FCS with penicillin and streptomycin and incubated in 5% (vol/vol) CO2 at 37 °C.
Athymic nude mice and BALB/c mice were purchased from the National Cancer Institute Mouse Repository. C57BL/6J mice were purchased from The Jackson Laboratory. C57BL/6J GFRα1+/− heterozygote mice were obtained from Sanjay Jain (Washington University School of Medicine, St. Louis, MO). DRG were isolated from mice as previously described (8) for use in vitro coculture assays.
Plasmids, Antibodies, and Reagents.
Human RET plasmid was obtained from Carlos Ibanez (Karolinska Institute, Stockholm, Sweden). Human GFRα1 plasmid was obtained from Hannu Sariola (Institute of Biomedicine, Helsinki, Finland). Human RET and GFRα1 were transfected into 3T3 cells using Lipofectamine 2000 transfection reagent (Life Technologies). G418 was used for cell selection.
Anti-RET (c-19), anti-GFRα1 (E11), and anti–β-actin antibodies were purchased from Santa Cruz Biotechnology. Anti–p-RET, anti-pERK1/2, anti-ERK1/2, anti-pAKT, and anti-AKT antibodies were obtained from Cell Signaling Technology. Alexa Fluor 568 goat anti-rabbit IgG (H+L) and Alexa Fluor 488 goat anti-mouse IgG (H+L) were purchased from Life Technologies. Alexa Fluor 488 goat anti-rabbit IgG (H+L) was purchased from Invitrogen. Anti–p-RET antibody (ab51103) targeting p-Y1062 for immunofluorescence staining was purchased from Abcam. Purified GDNF was purchased from EMD Chemicals. Recombinant human GFRα1-Fc chimera protein was purchased from R&D Systems. Growth factor-depleted Matrigel matrix was purchased from BD Biosciences.
siRNA and shRNA Transfection.
For transient RNA silencing, MiaPaCa-2 cells were transfected with siRNA targeting RET (siRET) or targeting GFRα1 (siGFRα1) using ON-TARGET sets of four siRNA (RET: LQ-003170-00-0005; GFRα1: LQ-007913-00-0002; Thermo Fisher Scientific) using Oligofectamine transfection reagent (Life Technologies). Cells were transfected with nontargeting siRNA (siControl) as a control using ON-TARGET siRNA (D-001810-01-05; Thermo Fischer Scientific).
For stable RNA silencing, RET and GFRα1 MISSION shRNA bacterial glycerol stocks were obtained from Sigma-Aldrich. Plasmids were packaged into lentivirus and transfected into MiaPaCa-2 cells. Cells were selected in puromycin over 4 wk. Nontargeting shRNA was used as a control. The RET sequence targeted was 5′-CCGGGCTGCATGAGAACAACTGGATCTCGAGATCCAGTTGTTCTCATGCAGCTTTTT-3′ (TRCN0000000405), whereas the GFRα1 sequence targeted was 5′-CCGGGCAGGGTCTGAGAATGAAATTCTCGAGAATTTCATTCTCAGACCCTGCTTTTTG-3′ (TRCN0000060631).
Immunofluorescence Microscopy.
Cells were grown on chamber slides, fixed in 4% paraformaldehyde, washed, blocked (10% FCS and 0.03% Triton X-100 in PBS), and incubated with polyclonal rabbit anti-RET and monoclonal mouse anti-GFRα1 antibodies overnight at 4 °C. Cells were washed (0.1% BSA in PBS), incubated with Alexa Fluor 568 goat anti-rabbit IgG and Alexa Fluor 488 goat anti-mouse IgG at 1:500 dilution for 1 h at room temperature, washed again, and treated with 4′,6-diamidino-2-phenylindole (DAPI) solution (1 µL of 14.3 mM stock for every 5 mL of PBS) for 5 min at room temperature.
RT-PCR and Western Blot.
Total RNA was extracted using the RNeasy Mini Kit (Qiagen). RNA concentration was assessed by spectrophotometry at 260 and 280 nm absorbance (NanoDrop ND-1000 Spectrophotometer; Thermo Fisher Scientific). First-strand cDNA synthesis was performed using the qScript cDNA Supermix kit (Quanta Biosciences) in a personal thermocycler (Eppendorf). The reactions were incubated for 5 min in 25 °C, 30 min in 42 °C, heated for 5 min in 85 °C, and held at 4 °C. The cDNA was amplified by PCR using the High Fidelity PCR Master Kit (Roche). Primers for PCR were the following: GFRα1: 5′-GGGCTTATTGGCACAGTCAT-3′ (forward), 5′- ATAATAGGGTGGACAGAGCG-3′ (reverse); RET: 5′-GAAAAGTGGTCAAGGCAACG-3′ (forward), 5′-AAATCTTCATCTTCCGCCCC-3′ (reverse); and GAPDH: 5-AAGGTGAAGGTCGGAGTCAAC-3′ (forward), 5-CATGAGTCCTTCCACGATACC-3′ (reverse).
Cells were lysed in SDS and heated at 94 °C for 5 min. Protein underwent electrophoresis in 10% Tris⋅HCl gels (Bio-Rad), transferred to poly(vinylidene difluoride) membranes, blocked with TBS-T (20 mM Tris⋅HCl, pH 7.6; 154 mM NaCl; and 0.1% Tween 20) containing 5% nonfat dry milk and exposed to primary antibody followed by a secondary antibody conjugated to horseradish peroxidase. Protein–antibody complexes were visualized using an ECL Plus detection system (Amersham). Band density was quantified by Quantity One (Bio-Rad).
Boyden Chamber Migration Assays.
Polyethylene terephthalate inserts with 8.0-µm pores (BD Biosciences) were used in 24-well plates. Cells were starved in 0.1% FCS overnight, and then 2 × 10⁵ cells were plated into each insert in 0.5 mL of media with 0.1% FCS. Below the inserts, 0.7 mL of 0.1% FCS media was added to each of the wells with GDNF (10 or 100 ng/mL) or DRG harvested from mice as previously described (8, 17). Controls had 0.1% FCS media alone in the wells below the inserts. For the studies examining soluble GFRα1 or anti-GFRα1 antibody added to DRG, the GFRα1 protein or anti-GFRα1 antibody was added to the wells below the inserts.
After 24 h, the inserts were removed, and the nonmigrating cells on the top surface of the membrane were wiped off with a cotton swab. The migrating cells on the bottom surface of the membrane were fixed in 100% alcohol for 10 min and stained with 1% methylene blue in 1% borax for 20 min. Membranes were excised and mounted on glass slides. Cells were counted at five high-power fields at predetermined areas on the membrane. For protein collection during these migration assays, the inserts were removed after 24 h, and the membranes were excised and placed in 50 µL of lysis buffer on ice. After cell lysis, the membranes were removed, and protein was quantified for Western blotting. All experimental groups were repeated in triplicate.
Soluble GFRα1 Production by DRG.
DRG were harvested as previously described (8, 17) from BALB/c, C57BL/6J GFRα1+/−, and GFRα1+/+ mice. DRG were grown within growth factor-depleted Matrigel matrix (BD Biosciences) in a 100-mm dish and cultured in DMEM containing 10% FCS at 37 °C with 5% CO2. Media were changed by the same volume of media containing 0.1% FCS at day 3. At days 4, 6, and 8, media were collected from DRG from BALB/c mice. At day 6, media were collected from DRG from C57BL/6J GFRα1+/− and GFRα1+/+ mice. Media were concentrated by a concentrator (Millipore) to 200-µL volume per sample. The same volume of DMEM containing 0.1% FCS were concentrated to 200-µL volume as a control. Total protein in each sample was quantified and assessed by Western blot for soluble GFRα1.
In Vitro Coculture Model of Nerve Invasion.
This model of nerve invasion is based a technique originally described by Ayala (17). Harvested DRG were each implanted in the center of a 15-µL drop of growth factor-depleted Matrigel (21) in a six-well plate with glass bottom. At day 7 after DRG implantation, 5 × 10⁴ cancer cells were added to the media around the DRG. Anti-GFRα1 antibody (200 µg/mL) was also added to media and daily thereafter, with goat IgG used alternatively as a control. Four, 5, and 6 d after the cancer cells were added, plates were examined on an Axiovert 200M microscope (Carl Zeiss), and images were acquired using a Photometrics Coolsnap ES camera (Photometrics). Software (MetaMorph 7.7.4; Molecular Devices) was used to outline and quantify the areas within the DRG invaded by cancer cells.
In Vivo Model of Murine Sciatic Nerve Invasion.
Athymic nude mice (n = 12) were anesthetized with isoflurane (5% for induction, 2% for maintenance) and sciatic nerves surgically exposed. The nerve is located deep to the femoral coccygeus and biceps femoris muscles. Mice were grouped randomly into three groups. MiaPaCa2 shRNA control (shControl), shRNA GFRα1 (shGFRα1), and shRNA RET (shRET) cells (6 × 10⁵) in 3-µL volume of PBS were microscopically injected into the distal sciatic nerve under the epineurium using a custom-made Hamilton syringe. An additional mouse underwent sciatic nerve injection with PBS as a non–tumor-bearing control.
Sciatic nerve function was assessed weekly as described previously (8). Gross behavior, the sciatic neurological score (hind limb motor response to extension, with 4 indicating normal and 1 indicating full paralysis) and the sciatic nerve function index (hind paw width) were measured. Functional comparisons between experimental groups were performed at varying times following cancer cell injection, when average tumor volumes were comparable across different experimental groups, ranging from 350 to 500 mm3.
Sciatic nerve and tumor specimens were excised immediately following animal sacrifice, frozen in OCT, and cut into 8-µm-thick sections on glass slides. The slides were fixed and stained with H&E. Images were acquired with Mirax slide scanner (20×/0.8 NA objective) using Mirax scan software (Carl Zeiss).
MRI of Sciatic Nerves.
All mice after undergoing nerve injection with cancer cells were assessed by MRI as described previously (16). A Bruker USR 4.7T 40-cm bore scanner (Bruker Biospin MRI) equipped with a 400 mT/m 12-cm bore gradient, using a custom-designed active decoupled radiofrequency surface coil (Stark MRI Contrast Research). After the mice were anesthetized (1.5% isoflurane; Baxter Healthcare), the sciatic nerves were localized by a scout fast-spin echo scan in three orientations, followed by a coronal T2-weighted fast-spin echo image acquired with TR/TE 1.9 s and 40 ms, 117 × 186 µm in-plane resolution, 20 slices of 0.8-mm slice thickness, and 16 averages. For contrast images, 0.1 mmol/kg gadolinium diethylenetriamine pentaacetic acid and Magnevist (Bayer Healthcare Pharmaceuticals) were injected via mouse tail vein. Coronal T1-weighted gradient-echo images were acquired continuously before and after injection. The acquisition parameters were TR 126 ms, TE 2.2 ms, and 156 × 186 µm in-plane resolutions, 12 slices with 0.8 mm slice thickness, and eight averages with a time resolution of 3 min.
Histology of Tumor Sections.
After animal sacrifice, both the proximal sciatic nerve and the primary sciatic nerve tumors were excised and frozen in OCT (Sakura Finetek). Sections were cut at 8-µm thickness and mounted on glass slides. H&E staining was performed to evaluate for the presence of nerve invasion. Immunofluorescence staining for RET, p-RET, and GFRα1 was performed using the primary and secondary antibodies described above. Images were captured on a Zeiss microscope (Zeiss LSM510 Inverted Confocal, Axiovert 200M).
Tissue Microarray of Pancreatic Adenocarcinomas.
This study was approved by the Memorial Sloan-Kettering Cancer Center (MSKCC) institution review board. A tissue microarray constructed from formalin-fixed, paraffin-embedded tissue blocks of 141 surgically excised human pancreatic ductal adenocarcinomas. Each tumor specimen was cored in triplicate. Immunohistochemical detection of anti-GFRα1 was performed using a Discovery XT processor (Ventana Medical Systems). Tissue sections were deparaffinized with EZPrep buffer (Ventana Medical Systems), antigen retrieval was performed with CC1 buffer (Ventana Medical Systems), and sections were blocked for 30 min with Background Buster solution (Innovex). Anti-GFRα1 antibody (sc-271546; Santa Cruz Biotechnology) was applied at 5 µg/mL, incubated for 5 h, and then incubated for 1 h with biotinylated horse anti-mouse IgG (Vector Labs; catalog no. MKB-22258) at 1:200 dilution. Detection was performed with DAB detection kit (Ventana Medical Systems) according to the manufacturer’s instructions. Slides were counterstained with hematoxylin and cover-slipped with Permount (Fisher Scientific). Slides were read by an experienced pathologist, who scored samples based on intensity and extent of staining on a scale of 0 (negative), 1+ (mild-moderately positive), and 2+ (strongly positive).
Statistical Analyses.
A Student t test was used for statistical analysis as appropriate. All P values were calculated using two-sided tests. Differences were considered statistically significant if the P value was less than 0.05. Error bars in the graphs represent 95% confidence intervals.
Supplementary Material
Acknowledgments
R.J.W. was supported by National Institutes of Health Grant R01CA157686. S.H. was supported by Anhui Provincial Natural Science Foundation Grant 1308085MH131.
Footnotes
The authors declare no conflict of interest.
This article is a PNAS Direct Submission.
This article contains supporting information online at www.pnas.org/lookup/suppl/doi:10.1073/pnas.1402944111/-/DCSupplemental.
References
- 1.Batsakis JG. Nerves and neurotropic carcinomas. Ann Otol Rhinol Laryngol. 1985;94(4 Pt 1):426–427. [PubMed] [Google Scholar]
- 2.Liebig C, Ayala G, Wilks JA, Berger DH, Albo D. Perineural invasion in cancer: A review of the literature. Cancer. 2009;115(15):3379–3391. doi: 10.1002/cncr.24396. [DOI] [PubMed] [Google Scholar]
- 3.Bapat AA, Hostetter G, Von Hoff DD, Han H. Perineural invasion and associated pain in pancreatic cancer. Nat Rev Cancer. 2011;11(10):695–707. doi: 10.1038/nrc3131. [DOI] [PubMed] [Google Scholar]
- 4.Fagan JJ, et al. Perineural invasion in squamous cell carcinoma of the head and neck. Arch Otolaryngol Head Neck Surg. 1998;124(6):637–640. doi: 10.1001/archotol.124.6.637. [DOI] [PubMed] [Google Scholar]
- 5.Beard CJ, et al. Perineural invasion is associated with increased relapse after external beam radiotherapy for men with low-risk prostate cancer and may be a marker for occult, high-grade cancer. Int J Radiat Oncol Biol Phys. 2004;58(1):19–24. doi: 10.1016/s0360-3016(03)01433-0. [DOI] [PubMed] [Google Scholar]
- 6.Law WL, Chu KW. Anterior resection for rectal cancer with mesorectal excision: A prospective evaluation of 622 patients. Ann Surg. 2004;240(2):260–268. doi: 10.1097/01.sla.0000133185.23514.32. [DOI] [PMC free article] [PubMed] [Google Scholar]
- 7.Veit C, et al. Activation of phosphatidylinositol 3-kinase and extracellular signal-regulated kinase is required for glial cell line-derived neurotrophic factor-induced migration and invasion of pancreatic carcinoma cells. Cancer Res. 2004;64(15):5291–5300. doi: 10.1158/0008-5472.CAN-04-1112. [DOI] [PubMed] [Google Scholar]
- 8.Gil Z, et al. Paracrine regulation of pancreatic cancer cell invasion by peripheral nerves. J Natl Cancer Inst. 2010;102(2):107–118. doi: 10.1093/jnci/djp456. [DOI] [PMC free article] [PubMed] [Google Scholar]
- 9.Jing S, et al. GDNF-induced activation of the ret protein tyrosine kinase is mediated by GDNFR-alpha, a novel receptor for GDNF. Cell. 1996;85(7):1113–1124. doi: 10.1016/s0092-8674(00)81311-2. [DOI] [PubMed] [Google Scholar]
- 10.Treanor JJ, et al. Characterization of a multicomponent receptor for GDNF. Nature. 1996;382(6586):80–83. doi: 10.1038/382080a0. [DOI] [PubMed] [Google Scholar]
- 11.Paratcha G, Ledda F, Ibáñez CF. The neural cell adhesion molecule NCAM is an alternative signaling receptor for GDNF family ligands. Cell. 2003;113(7):867–879. doi: 10.1016/s0092-8674(03)00435-5. [DOI] [PubMed] [Google Scholar]
- 12.Barnett MW, Fisher CE, Perona-Wright G, Davies JA. Signalling by glial cell line-derived neurotrophic factor (GDNF) requires heparan sulphate glycosaminoglycan. J Cell Sci. 2002;115(Pt 23):4495–4503. doi: 10.1242/jcs.00114. [DOI] [PubMed] [Google Scholar]
- 13.Bespalov MM, et al. Heparan sulfate proteoglycan syndecan-3 is a novel receptor for GDNF, neurturin, and artemin. J Cell Biol. 2011;192(1):153–169. doi: 10.1083/jcb.201009136. [DOI] [PMC free article] [PubMed] [Google Scholar]
- 14.Paratcha G, et al. Released GFRalpha1 potentiates downstream signaling, neuronal survival, and differentiation via a novel mechanism of recruitment of c-Ret to lipid rafts. Neuron. 2001;29(1):171–184. doi: 10.1016/s0896-6273(01)00188-x. [DOI] [PubMed] [Google Scholar]
- 15.Ledda F, Paratcha G, Ibáñez CF. Target-derived GFRalpha1 as an attractive guidance signal for developing sensory and sympathetic axons via activation of Cdk5. Neuron. 2002;36(3):387–401. doi: 10.1016/s0896-6273(02)01002-4. [DOI] [PubMed] [Google Scholar]
- 16.Bakst RL, et al. Radiation impairs perineural invasion by modulating the nerve microenvironment. PLoS ONE. 2012;7(6):e39925. doi: 10.1371/journal.pone.0039925. [DOI] [PMC free article] [PubMed] [Google Scholar]
- 17.Ayala GE, et al. In vitro dorsal root ganglia and human prostate cell line interaction: Redefining perineural invasion in prostate cancer. Prostate. 2001;49(3):213–223. doi: 10.1002/pros.1137. [DOI] [PubMed] [Google Scholar]
- 18.Enomoto H, et al. GFR α1-deficient mice have deficits in the enteric nervous system and kidneys. Neuron. 1998;21(2):317–324. doi: 10.1016/s0896-6273(00)80541-3. [DOI] [PubMed] [Google Scholar]
- 19.Takahashi T, et al. Perineural invasion by ductal adenocarcinoma of the pancreas. J Surg Oncol. 1997;65(3):164–170. doi: 10.1002/(sici)1096-9098(199707)65:3<164::aid-jso4>3.0.co;2-4. [DOI] [PubMed] [Google Scholar]
- 20.Noto M, et al. Pancreas head carcinoma: Frequency of invasion to soft tissue adherent to the superior mesenteric artery. Am J Surg Pathol. 2005;29(8):1056–1061. [PubMed] [Google Scholar]
- 21.Tonge DA, et al. Effects of extracellular matrix components on axonal outgrowth from peripheral nerves of adult animals in vitro. Exp Neurol. 1997;146(1):81–90. doi: 10.1006/exnr.1997.6498. [DOI] [PubMed] [Google Scholar]
Associated Data
This section collects any data citations, data availability statements, or supplementary materials included in this article.


