

Significance
To our knowledge, we show for the first time that the yeast DJ-1 homologs are required for diauxic-shift, an important metabolic reprogramming stage that is triggered by glucose deprivation. Deletion of the HSP31-34 genes results in reduced lifespan and alterations in several hallmarks of stationary-phase, including impairment of autophagy induction through deregulation of target of rapamycin complex 1 (TORC1). As both autophagy and TORC1 are associated with human disorders, our work has broad relevance toward the understanding of these processes in health and disease.
Abstract
The yeast Hsp31 minifamily proteins (Hsp31, Hsp32, Hsp33, Hsp34) belong to the highly conserved DJ-1 superfamily. The human DJ-1 protein is associated with cancer and neurodegenerative disorders, such as Parkinson disease. However, the precise function of human and yeast DJ-1 proteins is unclear. Here we show that the yeast DJ-1 homologs have a role in diauxic-shift (DS), characterized by metabolic reprogramming because of glucose limitation. We find that the Hsp31 genes are strongly induced in DS and in stationary phase (SP), and that deletion of these genes reduces chronological lifespan, impairs transcriptional reprogramming at DS, and impairs the acquisition of several typical characteristics of SP, including autophagy induction. In addition, under carbon starvation, the HSP31 family gene-deletion strains display impaired autophagy, disrupted target of rapamycin complex 1 (TORC1) localization to P-bodies, and caused abnormal TORC1-mediated Atg13 phosphorylation. Repression of TORC1 by rapamycin in the gene-deletion strains completely reversed their sensitivity to heat shock. Taken together, our data indicate that Hsp31 minifamily is required for DS reprogramming and cell survival in SP, and plays a role upstream of TORC1. The enhanced understanding of the cellular function of these genes sheds light into the biological role of other members of the superfamily, including DJ-1, which is an attractive target for therapeutic intervention in cancer and in Parkinson disease.
The Saccharomyces cerevisiae Hsp31 minifamily is comprised of Hsp31 (YDR533C), Hsp32 (YMR322C), Hsp33 (YOR391C), and Hsp34 (YPL280W) proteins, and belongs to the DJ-1 superfamily (1). Human DJ-1, the most extensively studied of this superfamily, is implicated in Parkinson disease and cancer. Although there is still no consensus on its precise role, DJ-1 appears to be a multifunctional protein associated with numerous functions, including protection against oxidative stress (2). DJ-1 acts as a redox-dependent chaperone, preventing α-synuclein aggregation, as a protease, as an RNA-binding protein, and as a free-radical scavenger (3). DJ-1 has also been linked to survival and oxidative stress signaling pathways, such as PTEN, AKT and NRF2 (3).
Among the Hsp31 minifamily, Hsp31 is the most divergent and likely gave rise to the other three paralogs by genome duplication (4), which share strong sequence homology of >90%. Although HSP32, HSP33, and HSP34 localize within subtelomeric regions, HSP31 is an interstitial gene. Although little is known about the function of these proteins, Hsp31 likely plays a role in stress response (5). Indeed, proteomic and transcriptomic studies have found that HSP31 expression increases after exposure to a variety of cellular insults (4, 6–8).
Here, we show that the Hsp31 minifamily is required for normal transition at diauxic-shift (DS) and for the acquisition of typical characteristics of stationary phase (SP). In their absence, yeast cells lose the capacity to survive in SP conditions and display target of rapamycin complex 1 (TORC1) signaling dysfunction. In this report, we provide novel insights into the function of the DJ-1-related Hsp31 minifamily, which may contribute to the understanding of the general function of the DJ-1 superfamily.
Results
The HSP31 Minifamily Is Required for Normal DS and SP.
Because Hsp31 is induced in postdiauxic phase (5), we started by assessing the levels of HSP31, HSP32, and HSP33 throughout the different phases of yeast growth in liquid medium (Fig. S1A). Because HSP32, HSP33, and HSP34 have extremely high sequence identity (Fig. S1B), it was not possible to design unique primers HSP34. In parallel, we determined the expression profile of GIS1 (GIg1-2 Suppressor), a transcription factor required for gene expression during nutrient limitation (9). We found that HSP31–33 and GIS1 had similar expression patterns (Fig. 1A): these genes were highly induced at DS and the levels were maintained in SP. We detected slight differences in the timing and levels of expression between the members of the Hsp31 minifamily. HSP31 and HSP33 mRNAs reached maximum levels in early SP, whereas HSP32 mRNA levels peaked at DS (Fig. 1A).
Fig. 1.

HSP31, HSP32, and HSP33 are required for normal DS and CLS. (A) Gene-expression quantification was performed via qRT-PCR in midlog, DS, early SP (1 d growth) and SP (2 d growth) and normalized by TAF10 and UBC6. Error bars represent SD (SD) of the mean (n = 3). Fold-induction is indicated on top of each bar. Statistical analyses were performed using Student t test (***P < 0.001, **P < 0.01, *P < 0.05). (B) Strains were monitored for CLS by counting colony-forming units. Day 0 is the time when cultures reached SP (survival = 100%). Mean and SD (n = 3) are indicated in the graph. (C–F) Expression analysis of hsp31Δ, hsp32Δ, and hsp33Δ at DS. (C) Overlap between up- or down-regulated genes in hsp31Δ, hsp32Δ, and hsp33Δ versus WT cells. (D and E) Overlapping genes were grouped in terms of GO. The most significant gene clusters are shown. Frequency is the percentage of overlapping genes that are clustered in a given ontology group; the yeast genome frequency is the total percentage of genes annotated for that term in the parental strain. (F) Log and DS expression profiles were downloaded from ArrayExpress (E-TABM-496) and subsequently analyzed to calculate the fold-change between these two conditions. DEGs > twofold (P < 0.05) were divided in up- and down-regulated groups and were compared with the overlapping genes obtained in C.
As previously shown for hsp31∆ cells (5), deletion of HSP32, HSP33, and HSP34 had no effect on yeast growth in normal conditions but resulted in higher sensitivity to oxidative stress (Fig. S1C), reduced thermotolerance (Fig. S1D), and accumulation of higher levels of reactive oxygen species (ROS) (Fig. S1 E and F). Given that the expression of HSP31, HSP32, and HSP33 significantly increased at DS, we tested whether the absence of these genes, as well as HSP34, affected yeast survival in SP, known as chronological lifespan (CLS). We included the gis1∆ strain for comparison as it has shorter CLS (10). Deletion of HSP31 family genes resulted in reduced CLS, although to a lesser extent than deletion of GIS1 (Fig. 1B). Reintroduction of the HSP31 family genes in knockout strains reverted this phenotype (Fig. S1 G and H). In addition, the absence of hsp31∆ thermotolerance was also reverted by each of the four HSP31 family members, suggesting they have at least partially overlapping functions (Fig. S1I).
The strong up-regulation of HSP31–33 at DS, together with the loss of cell viability in aged cultures of knockout strains, prompted us to further investigate the role of these genes during DS. We performed gene-expression microarrays of hsp31Δ, hsp32Δ, hsp33Δ, and WT strains at DS, which was determined based upon growth rate and glucose consumption. The microarray analyses were validated by testing selected differentially expressed genes (DEGs) by quantitative real-time PCR (qRT-PCR) (Table S1). The expression profiles of knockout strains were independently compared with that of the WT strain, and only genes differently expressed more than twofold (P ≤ 0.05) were subsequently analyzed. Among the three pair-wise comparisons, hsp32Δ showed the highest number of DEGs with alterations in one-quarter of the genome (Fig. 1C). To identify overlapping DEGs between the knockout strains, we performed separate comparisons of up- and down-regulated genes (Fig. 1C). hsp32Δ and hsp33Δ strains shared a high number of DEGs that did not overlap with hsp31Δ, in agreement with the high conservation between Hsp32 and Hsp33 (Fig. 1C). We selected DEGs common to the three knockout strains and clustered them using gene ontology (GO) analysis based upon biological process annotations (Fig. 1 D and E). Among the down-regulated GO terms we found genes involved in metabolic processes, cellular response to stress, and autophagy (Fig. 1D and Table S2), whereas the up-regulated group included genes involved in translation (Fig. 1E). Intriguingly, these biological processes are normally reprogrammed at DS in WT cells, suggesting that in knockout cells this metabolic regulation is perturbed (11). To further confirm that the DEGs overlap with the reprogrammed genes at DS, we compared our results with existing data available at ArrayExpress (12). We first compared existing log-phase expression profiles with DS profiles, allowing us to determine which genes change at DS. Next, we compared this dataset to our “overlapping” dataset. This analysis revealed that ∼62% of the genes in our dataset overlapped with the reprogrammed genes (Fig. 1F). However, ∼59% of the overlapping genes were differentially expressed in opposing directions (e.g., anticorrelated), indicating that normal diauxic transition is altered in the knockout strains (Fig. 1F).
Because of glucose limitation at DS, genes that are under glucose repression are derepressed. Indeed, we found that several DEGs are involved in glucose transport and metabolism, including MIG2, NRG2, and HXT5 (Table S3). MIG2 and NRG2, which are involved in glucose repression, were up-regulated in the knockout strains, whereas HXT5—a glucose transporter induced at DS (13)—was highly down-regulated. Interestingly, expression of HXT4, another glucose transporter induced at DS, was up-regulated in the knockout strains, a possible compensatory mechanism resulting from reduced expression of HXT5.
To confirm whether glucose repression is enhanced in the knockout strains, we next expressed Leu2 in both WT and hsp31∆ strains under the control of the GAL1 promoter. Whereas expression of Leu2 increased progressively upon galactose induction in the WT strain, hsp31∆ cells exhibited lower levels of Leu2, which did not increase over the time-frame of the experiment. These data suggest that glucose repression is enhanced in hsp31∆ in comparison with the WT strain, confirming that Hsp31 is required for glucose derepression (Fig. S1J).
Typical SP Characteristics Are Altered in HSP31 Minifamily Knockout Strains.
Several changes that occur in postdiauxic phase are maintained throughout SP (14). Therefore, we next evaluated whether typical characteristics of SP were altered in the knockout strains. We first tested the thermotolerance of the strains to a 50 °C heat shock, an indicator of cellular steady-state defenses. Consistently, the knockout strains were less thermotolerant than the WT strain, exhibiting decreased viability within 10 min of heat shock (Fig. 2A). The thickness of the cell wall—known to increase in SP cells—was evaluated by resistance to the lytic enzyme zymolyase. Cells in SP were incubated with zymolyase in a hyperosmotic environment and monitored for optical density over time. As the cell wall is digested, cells burst and the optical density decreases. The cell walls of HSP31 minifamily and GIS1 knockout strains were digested more rapidly than those of the WT strain, indicating reduced resistance to zymolyase and therefore a thinner cell wall (Fig. 2B).
Fig. 2.

hsp31Δ, hsp32Δ, hsp33Δ, and hsp34Δ cells fail to acquire typical SP characteristics. WT and gene-deletion strains were analyzed for resistance to heat stress (A), cell wall integrity (B), autophagy flux (C), and cell cycle (D). (A) Cultures were grown until SP (2 d growth) and subjected to a 50 °C heat shock for the specified time. (B) SP cultures were incubated with zymolyase cell lysis was measured by reading the OD600. (C) Log and SP cells expressing GFP-Atg8 were lysed and analyzed by immunoblotting. The presence of free GFP is an indicator of autophagic flux. (D) To quantify DNA content, cells were stained with propidium iodide and analyzed by flow cytometry. The graph represents the percentage of cells remaining in G2/M during SP. Error bars represent SD of the mean for each assay (n = 3, Student t test, **P < 0.01, *P < 0.05).
We next evaluated autophagy in the knockout strains at SP by monitoring ATG8, an autophagy gene down-regulated in the knockout strains. Atg8 is involved in the formation of autophagosomes and, during this process, is degraded in the vacuole (15). We assessed autophagy using a GFP-Atg8 reporter under the control of the ATG8 promoter, which permits monitoring of both autophagy induction and autophagic flux as Atg8 is rapidly degraded in the vacuole but GFP is not (16). Immunoblot analysis with an anti-GFP antibody detects two protein bands: the higher molecular-weight band corresponding to cytosolic GFP-Atg8, and the lower band corresponding to GFP-Atg8 degraded in the vacuole (16). We analyzed autophagy in WT, hsp31∆, hsp33∆, and hsp34∆ strains in both SP and log phase. Strikingly, we observed impaired induction of autophagy in the knockout strains during SP and reduced levels of basal autophagy during log phase (Fig. 2C). These results indicate that autophagy is impaired in the absence of at least one of the Hsp31 family members. Finally, we evaluated cell-cycle progression in the knockout strains. To measure DNA content, we stained cells with propidium iodide and performed flow cytometry analyses, which indicated that a higher percentage of cells remained in mitosis and failed to enter G0 in the knockout cells (Fig. 2D).
Autophagic Response Is Impaired During Carbon Starvation in hsp31Δ Cells.
As it was previously shown that HSP31 is induced in oxidative stress conditions (5) and that levels of ROS increase at DS, we hypothesized that ROS might trigger the observed up-regulation of HSP31-33 at DS (Fig. 1A). Intriguingly, oxidative stress induced by H2O2 failed to increase expression of HSP32 and HSP33, and only the highest concentration (2 mM) was able to induce HSP31 (Fig. S2A). Because yeast viability decreased beyond this concentration, we did not exceed this level in our experiments.
Next, we tested whether the HSP31 minifamily was induced by starvation, another hallmark of DS and SP. HSP32 and HSP33 expression was highly induced by both nitrogen and carbon starvation, but it was higher in carbon starvation conditions (Fig. S2B). On the other hand, HSP31 was only significantly up-regulated by nitrogen depletion (Fig. S2B). These results suggest that expression of the Hsp31 minifamily members during DS and SP is mainly regulated by starvation as opposed to oxidative stress.
We next assessed whether the autophagy impairment during SP in the knockout strains was also observed under nutrient (nitrogen or carbon) starvation or upon rapamycin treatment, a compound widely-used to induce autophagy via TORC1 inactivation (17). Cells expressing GFP-Atg8 were analyzed before and 1, 3, and 5 h posttreatment. Because the autophagy phenotypes of the knockout strains were identical, we focused our efforts on the hsp31∆ strain for the subsequent experiments. After 1 h of rapamycin treatment, we observed induction of autophagy, which increased over time in both WT and hsp31∆ cells (Fig. 3A). Nitrogen depletion also induced autophagy in hsp31∆ cells (Fig. S3A); however, its induction and flux remained at basal levels during carbon starvation (Fig. 3A and Fig. S3B). Similar results were obtained in hsp33∆ and hsp34∆ strains (Fig. S3C). Next, we confirmed these findings by fluorescence microscopy and found that, although hsp31Δ cells displayed faint GFP-Atg8 fluorescence signal in cytoplasm in the absence of glucose, WT cells displayed strong GFP-Atg8 signal localized to the vacuole (Fig. 3B). On the other hand, upon nitrogen starvation or rapamycin treatment, GFP-Atg8 was localized to the vacuole in both WT and hsp31Δ cells (Fig. 3B and Fig. S3A).
Fig. 3.

Autophagic response in hsp31Δ is impaired upon carbon starvation. WT and hsp31Δ strains expressing pATG8-GFP-Atg8 were grown until midlog phase and treated with rapamycin or starved for carbon (SC-C) for the specified time. (A) Total lysates were analyzed by immunoblotting using antibodies against GFP or a housekeeping control Pgk1. (B) After 5 h of incubation with rapamycin or starvation, GFP-Atg8 localization was analyzed by microscopy. (Scale bar, 5 µm.)
TORC1 Signaling Is Perturbed in hsp31Δ Cells.
Entry into postdiauxic phase and progression into SP is orchestrated by nutrient-sensing signaling pathways. Two of the major signaling pathways associated with this transition are regulated by the TORC1 and protein kinase A (PKA) (18). These two kinases—in addition to playing a role in cellular growth via translation and stress response repression—also negatively regulate autophagy (18). Because of the dramatic gene-expression changes observed in the knockout strains at DS, we asked whether these pathways were deregulated in hsp31Δ cells. We used Atg13 as a reporter, which is a key player in autophagy regulated via phosphorylation by PKA and TORC1 (18).
Because TORC1 hyperphosphorylates Atg13, we monitored phosphorylation-status via Atg13 mobility in SDS-polyacrylamide gels (18). In SP TORC1 is repressed and therefore the levels of Atg13 phosphorylation decrease. As expected for WT cells, Atg13 migrated faster in SP (Fig. 4A). However, in hsp31Δ cells the difference between Atg13 migration in log and SP was reduced (Fig. 4A). This finding suggests that Atg13 is more phosphorylated in hsp31Δ cells, possibly because of TORC1 hyperactivity. To confirm that the differences observed in migration were caused by phosphorylation and not by other posttranslational modifications, we treated SP Atg13 with λ-phosphatase and observed that Atg13 from hsp31Δ cells migrated side by side with Atg13 from WT cells, confirming that migrational differences in SP were caused by phosphorylation (Fig. S3D). We further analyzed the phosphorylation of Atg13 under carbon and nitrogen starvation conditions, which led to Atg13 dephosphorylation in both the parental and hsp31Δ strains. Migration of Atg13 from hsp31Δ cells was slower in all of the conditions tested and was more pronounced under carbon starvation (Fig. 4B and Fig. S3E), suggesting a difference in phosphorylation-status between the strains. To investigate the activity of PKA we immunoprecipitated Atg13 and analyzed phosphorylation by immunoblotting using a PKA substrate antibody [α-(P)PKA]. The levels of PKA-mediated Atg13 phosphorylation were similar between WT and hsp31Δ cells in the conditions tested (SP, carbon, and nitrogen starvation) (Fig. 4 C and D and Fig. S3F), indicating that this kinase is not affected in the knockout strain.
Fig. 4.

Atg13 phosphorylation is altered in hsp31Δ cells. Protein extracts were collected from cultures at midlog phase (Log) and SP (A), and from cultures that were starved for carbon (SC-C) (B). Migration of HA-Atg13 in SDS-polyacrylamide gels was assessed using α-HA. An α-Pgk1 was used for loading control. (C and D) Atg13 was immunoprecipitated with α-HA and analyzed for PKA mediated phosphorylation using α-(P)PKA. The numbers below the immunoblots indicate the ratio between phosphorylated and total Atg13.
In total, these results suggest that TORC1 is deregulated upon HSP31 deletion, which is more evident in SP conditions. Because heat shock also leads to TORC1 inactivation (19, 20), we next assessed whether blocking TORC1 reverted hsp31Δ lack of thermotolerance. Using growth assays we observed that knockout cells treated with rapamycin exhibited decreased sensitivity to heat shock, indicating that TORC1 inhibition restored normal heat-shock response (Fig. 5). This finding further supports that absence of HSP31 affects the normal upstream regulation of TORC1.
Fig. 5.
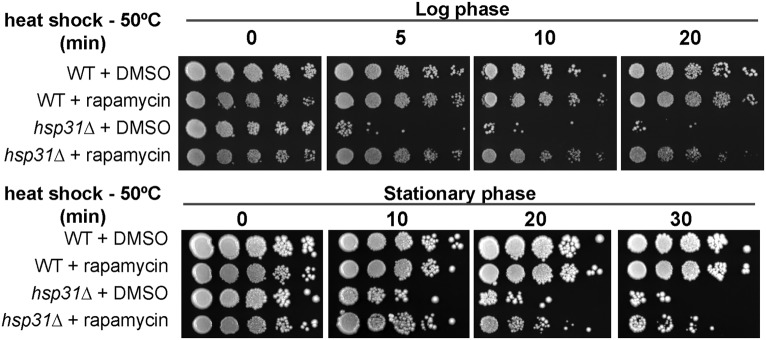
Rapamycin increases thermotolerance in hsp31∆ cells. Yeast strains in midlog phase were treated with DMSO or rapamycin for 3 h and subjected to a 5-, 10-, and 20-min heat shock at 50 °C. At postdiauxic phase cultures were incubated with rapamycin for 16 h before the heat shock. Cultures were serial diluted and spotted on media plates to analyze cell survival.
Hsp31 and Hsp32 Are Present in Stress Granules and P-Bodies.
To further characterize the cellular role of Hsp31 minifamily members and identify potential interaction partners, we performed proteomic analyses via GFP-Trap immunoprecipitation of Hsp31-GFP and Hsp32-GFP followed by mass spectrometry. Interestingly, we identified several components of stress granules (SGs) as interaction partners (Table S4), including core proteins such as Pbp1 and Pab1. SGs are dynamic cytoplasmic RNA-protein structures where nontranslating mRNAs are rapidly stored (21). These granules form during stress responses in which translation initiation is affected (21).
Next, we subjected WT cells expressing either Hsp31-GFP and Hsp32-GFP to glucose starvation and heat shock, two conditions associated with SG formation. In nonstressed cells we observed the presence of Hsp31-GFP foci, which significatly increased in both conditions (Fig. 6A and Fig. S4A). Because SGs are dynamic structures, we further characterized these foci by reintroducing glucose to the media and found that the percentage of cells with foci decreased to approximately basal levels, indicating that the assembly of these foci is reversible (Fig. 6A). SG assembly is dependent upon the presence of nontranslating mRNA. Thus, we treated cells with cycloheximide (CHX) before heat shock to trap mRNAs in polysomes (21). Similar to SG assembly, the number of Hsp31-GFP foci did not increase with heat shock when treated with CHX (Fig. 6A), suggesting their assembly also requires free mRNAs. We obtained similar results with Hsp32-GFP (Fig. 6B and Fig. S4A), although few foci were detected in nontreated cells and the localization pattern was different (Fig. 6).
Fig. 6.

Hsp31 and Hsp32 colocalize with SG and P-bodies. Midlog yeast WT W303 cells, grown in the presence of glucose (+Glu), expressing either Hsp31-GFP (A) or Hsp32-GFP (B) driven from the constitutive GPD promoter (centromeric vector) were subjected to the following treatments: 1 h of glucose deprivation (−Glu), 30 min of glucose readdition (−Glu+Glu), heat shock at 46 °C for 30 min (HS), treatment with CHX 2 min before the heat shock at 46 °C (30 min) (CHX + HS). The percentage of cells containing Hsp31-GFP (A) and Hsp32-GFP (B) foci is displayed in the graphs. Error bars represent the SD. Statistical analysis was performed using Student t test (**P < 0.01, *P < 0.05; 500 cells were scored per condition, n = 3). (C and D) Cells coexpressing Hsp31-GFP or Hsp32-GFP with Pub1-mCherry (C), a SG marker or Edc3-mCherry (D), a P-body marker, were subjected to heat shock as described above and analyzed by confocal microscopy. (Scale bars, 5 µm.)
To further characterize these foci, we coexpressed Hsp31-GFP and Hsp32-GFP with Pub1, a marker of SGs, or Edc3, a marker of Processing bodies (P-bodies, or Pbs). P-bodies are also RNA-protein structures that contain translationally silenced mRNAs, but diverge in their major components. Whereas SGs contain several translation initiation factors, P-bodies contain several mRNA decapping proteins (22). Although these structures likely have different roles (22), they interact dynamically and, in certain conditions, SG formation depends on P-body assembly (21). Our results clearly showed that Hsp31-GFP and Hsp32-GFP are present in P-bodies and SG foci (Fig. 6 C and D).
P-Body and SG Assembly Is Affected in the Absence of HSP31.
We next investigated whether the formation of SG and P-bodies was affected in the absence of Hsp31. Similar to what has been described (23), P-bodies (Dcp1 foci) appeared at early SP (Fig. 7A), whereas SGs (Pab1 foci) assembled only in SP (Fig. 7B). In the absence of Hsp31 the number of cells containing either P-bodies or SGs was significantly decreased (Fig. 7 A and B), indicating that their formation is impaired.
Fig. 7.

P-body and SG formation is affected by HSP31 deletion in early SP. (A) WT and hsp31Δ strains expressing Dcp1-DsRed, a marker of P-bodies, were grown to early SP (1 d of growth) and were analyzed by epifluorescence microscopy to score the percentage of cells containing Dcp1 foci (Student t test, *P < 0.05, n = 3). Error bars represent SD. (B) WT and hsp31Δ cells expressing Pab1-GFP, a marker of SGs, were analyzed after 1 or 2 d of growth by fluorescence microscopy. The percentage of cells containing Pab1 granules is indicated at the top left corner of the panel representing 2-d growth cultures; SD is shown in brackets. Five hundred cells were scored per condition (Student t test, P < 0.05, n = 3). (C) Cells bearing genomically tagged Kog1-GFP and Dcp1-DsRed were analyzed by confocal microscopy after 1 d of growth. The numbers indicated in the top left corner of the panel in the merged field correspond to the percentage of cells that contain Kog1-GFP foci colocalized with Dcp1-DsRed. Only the cells positive for Dcp1 were used in the calculation (60 cells scored per strain). SD is indicated below (Student t test, P < 0.005, n = 3). (Scale bars, 5 µm.)
Although TORC1 is known to be sequestered into SGs upon heat shock (19), its localization during SP or glucose starvation has not been described. Given that P-bodies are the first structures formed in SP (23), and that SG formation depends on P-body assembly in glucose starvation (21), we hypothesized that TORC1 might be trapped in P-bodies in early SP. Thus, we genomically fused GFP to Kog1, a TORC1 subunit, to monitor TORC1 localization during SP. As predicted, Kog1 lost its typical vacuolar membrane localization in early SP WT cells (24) (Fig. S4B) and, instead, localized as cytoplasmic foci (Fig. 7C). When we coexpressed Kog1-GFP with the P-body marker Dcp1, we observed that a subset of Kog1 granules clearly colocalized with Dcp1 foci, although not all Kog1 foci were positive for Dcp1 or vice versa. However, in hsp31∆ cells we observed not only fewer cells with P-bodies, but also a dramatic ∼fourfold decrease in cells with Kog1/P-body colocalization (P < 0.01) (Fig. 7C). Curiously, we also found P-bodies adjacent to Kog1 foci in several knockout cells. Taken together, these data strongly suggest that Hsp31 plays a critical role in the sequestration of TORC1 into P-bodies during glucose starvation.
Discussion
This study provides novel insights into the function of the Hsp31 minifamily. We found that HSP31 and its orthologs are required for DS, which occurs when glucose becomes limiting, leading to extensive metabolic and transcriptional reprogramming (11, 14, 25).
We found that nutrient starvation also induces expression of the Hsp31 minifamily. In agreement, the Escherichia coli EcHsp31 is also induced in SP and decreases cell survival during this phase when deleted (26). In addition, the Caenorhabditis elegans DJ-1 homolog DJR-1.2 is induced upon starvation and the dauer stage (starvation-induced alternative developmental stage) (27). Interestingly, human leukemia cell lines depleted for DJ-1 have reduced viability in serum-starvation conditions (28).
The TORC1 pathway is one of the major signaling pathways implicated in DS and progression into SP (14, 29–31). TORC1 is highly conserved nutrient-sensitive kinase that controls growth by promoting transcription, protein translation, and mRNA stability, and by repressing stress responses and autophagy (24, 32). Because of the high complexity of the TORC1 signaling pathway many questions are still unanswered, such as how carbon availability is signaled to TORC1 (24). The study of this pathway is difficult because of the cross-talk with other signaling pathways, such as the PKA pathway (another key kinase that signals the entry into DS), and also because of their overlapping readouts. Our data reveal that HSP31 minifamily members are potential upstream effectors of TORC1. We observed a dramatic transcriptional effect as a result of deletion of the Hsp31 minifamily members and the consequent absence of typical SP characteristics. Interestingly, some of the knockout phenotypes, such as deficient G0 arrest and reduced thermotolerance, are similar to those observed in strains deleted for the kinase Rim15 that integrates signals from Sch9, PKA, and TORC1 (33), and transduces them to Gis1 [the transcription factor responsible for expression of postdiauxic-shift genes (9)] and to Msn2/Msn4 (transcription factors responsible for expression of stress-induced genes). We found that autophagy in the knockout strains is completely blocked when the carbon source is depleted, but it is identical to the WT response upon rapamycin treatment and nitrogen starvation. This finding is consistent with the impairment observed in SP, because the entry into this phase is characterized by the depletion of any carbon source; this indicates that Hsp31 is involved in transducing the carbon starvation signal that leads to autophagy induction. This finding also shows that the autophagic machinery is working properly, and importantly, that Hsp31 has no role downstream of TORC1.
We also assessed the kinase activity of TORC1 and PKA using Atg13 as a reporter. Phosphorylation of Atg13 by either one of these kinases represses autophagy, making it a key player in this process. We found striking differences in Atg13 phosphorylation mediated by TORC1 in SP between hsp31∆ and control cells, suggesting that TORC1 is hyperactive in the knockout strain. We also found differences in TORC1-mediated phosphorylation in carbon starvation conditions and, unexpectedly, also in nitrogen starvation. Interestingly, the differences in phosphorylation were detected in log-phase cells growing in rich media, suggesting that HSP31 deletion leads to higher basal TORC1 activation, which is independent of PKA-mediated phosphorylation.
Notably, when Hsp31 and Hsp32 associate with components of SGs and P-bodies, cytoplasmic granules rapidly formed under stress conditions (21) that contain nontranslating mRNAs and proteins, allowing the selective translation of genes essential for survival (21, 22). We found that foci containing Hsp31 or Hsp32 share characteristics of SGs and P-bodies, including increased assembly during stress, dependence on the presence of nontranslating mRNAs, and reversibility. Importantly, Hsp31/32 foci colocalize with P-bodies and SGs, which are known to interact with one another (21). Curiously, we found a different pattern of SG/P-body colocalization between Hsp31 and Hsp32 foci, suggesting slightly different roles in this process. The absence of Hsp31 affected the formation of both SGs and P-bodies in SP, further supporting a role for Hsp31 in these granules. We also investigated the subcellular localization of TORC1, which is known to be sequestered in SGs upon heat shock (19). We found that Kog1, a TORC1 subunit, moves from the vacuolar membrane to P-bodies. Interestingly, P-bodies have been previously shown to colocalize with other signaling molecules, including the PKA subunits Tpk2 and Tpk3 in SP (34). We observed that the presence of Kog1 in P-bodies was clearly reduced in hsp31∆, strongly supporting that TORC1 is not properly regulated upon the deletion of Hsp31 minifamily genes. Future studies will clarify whether this mis-localization is directly caused by the absence of Hsp31 and whether the localization of TORC1 to P-bodies is a mechanism for reduction of TORC1 activity when glucose becomes limiting.
Our findings suggest that the Hsp31 minifamily modulates TORC1 activity in yeast, potentially serving as negative regulators of autophagy (Fig. S5). Human DJ-1 has been previously associated with autophagy, but its precise role is controversial (35–37). Although no association between members of the Hsp31 minifamily and RNA metabolism has been described, human DJ-1 is an RNA binding protein (38), suggesting this cellular function may be conserved. SGs have been associated with certain neurodegenerative diseases, such as amyotrophic lateral sclerosis, and thus it will be critical to investigate if human DJ-1 plays a similar role in modulation of these particles, and whether this function contributes to Parkinson disease pathogenesis.
Materials and Methods
Strains and Plasmids.
All strains and plasmids used in this study are described in Table S5. Primers used for qRT-PCR are listed in Table S6. Further information is described in SI Materials and Methods.
Media and Growth Conditions.
Yeast strains were grown on standard media. For starvation experiments, cultures were grown until midlog phase in synthetic complete (SC) media, and resuspended either on carbon starvation media (SC-C), or on nitrogen starvation media (SC-N). Rapamycin (Sigma) was added to midlog-phase cultures growing on SC-URA at a final concentration of 200 ng/mL. For GAL1 induction analysis, cultures were grown in SC-URA with 2% (wt/vol) glucose until midlog phase, washed, and resuspended in SC-URA with 2% galactose.
Microscopy, immunoblotting, DNA microarrays, and qRT-PCR procedures are described in detail in SI Materials and Methods.
Supplementary Material
Acknowledgments
We thank Prof. Paula Ludovico for helpful discussions; Prof. Claudina Rodrigues-Pousada for access to a tetrad dissection microscope; Dr. Nicolas Sylvius and the NUCLEUS facility (University of Leicester) for assistance with microarrays; and Drs. Daniel Klionsky, Yoshinori Ohsumi, Tony Hazbun, Roy Parker, Uesono Yukifumi, and Marek Skoneczny for providing plasmids and strains. This work was supported by a Parkinson UK Project Grant G-0902 (to F.G. and T.F.O.); Grant SFRH/BD/36065/2007 (to L.M.-F.); Fundação para a Ciência e Tecnologia (P.A. and T.F.P.); Fundação Calouste Gulbenkian (T.F.O.); a European Molecular Biology Organization Installation grant (to T.F.O.); a Marie Curie International Reintegration grant (Neurofold) (to T.F.O.); and the Deutsche Forschungsgemeinschaft Center for Nanoscale Microscopy and Molecular Physiology of the Brain (T.F.O.).
Footnotes
The authors declare no conflict of interest.
This article is a PNAS Direct Submission.
Data deposition: The data reported in this paper have been deposited in the Gene Expression Omnibus (GEO) database, www.ncbi.nlm.nih.gov/geo (accession no. GSE56124).
See Commentary on page 6858.
This article contains supporting information online at www.pnas.org/lookup/suppl/doi:10.1073/pnas.1319221111/-/DCSupplemental.
References
- 1.Wei Y, Ringe D, Wilson MA, Ondrechen MJ. Identification of functional subclasses in the DJ-1 superfamily proteins. PLOS Comput Biol. 2007;3(1):e10. doi: 10.1371/journal.pcbi.0030010. [DOI] [PubMed] [Google Scholar]
- 2.Cookson MR. Parkinsonism due to mutations in PINK1, parkin, and DJ-1 and oxidative stress and mitochondrial pathways. Cold Spring Harb Perspect Med. 2012;2(9):a009415. doi: 10.1101/cshperspect.a009415. [DOI] [PMC free article] [PubMed] [Google Scholar]
- 3.Wilson MA. The role of cysteine oxidation in DJ-1 function and dysfunction. Antioxid Redox Signal. 2011;15(1):111–122. doi: 10.1089/ars.2010.3481. [DOI] [PMC free article] [PubMed] [Google Scholar]
- 4.Wilson MA, St Amour CV, Collins JL, Ringe D, Petsko GA. The 1.8-A resolution crystal structure of YDR533Cp from Saccharomyces cerevisiae: A member of the DJ-1/ThiJ/PfpI superfamily. Proc Natl Acad Sci USA. 2004;101(6):1531–1536. doi: 10.1073/pnas.0308089100. [DOI] [PMC free article] [PubMed] [Google Scholar]
- 5.Skoneczna A, Miciałkiewicz A, Skoneczny M. Saccharomyces cerevisiae Hsp31p, a stress response protein conferring protection against reactive oxygen species. Free Radic Biol Med. 2007;42(9):1409–1420. doi: 10.1016/j.freeradbiomed.2007.01.042. [DOI] [PubMed] [Google Scholar]
- 6.de Nobel H, et al. Parallel and comparative analysis of the proteome and transcriptome of sorbic acid-stressed Saccharomyces cerevisiae. Yeast. 2001;18(15):1413–1428. doi: 10.1002/yea.793. [DOI] [PubMed] [Google Scholar]
- 7.Santos PM, Simões T, Sá-Correia I. Insights into yeast adaptive response to the agricultural fungicide mancozeb: A toxicoproteomics approach. Proteomics. 2009;9(3):657–670. doi: 10.1002/pmic.200800452. [DOI] [PubMed] [Google Scholar]
- 8.Miura T, Minegishi H, Usami R, Abe F. Systematic analysis of HSP gene expression and effects on cell growth and survival at high hydrostatic pressure in Saccharomyces cerevisiae. Extremophiles. 2006;10(4):279–284. doi: 10.1007/s00792-005-0496-6. [DOI] [PubMed] [Google Scholar]
- 9.Pedruzzi I, Bürckert N, Egger P, De Virgilio C. Saccharomyces cerevisiae Ras/cAMP pathway controls post-diauxic shift element-dependent transcription through the zinc finger protein Gis1. EMBO J. 2000;19(11):2569–2579. doi: 10.1093/emboj/19.11.2569. [DOI] [PMC free article] [PubMed] [Google Scholar]
- 10.Wei M, et al. Life span extension by calorie restriction depends on Rim15 and transcription factors downstream of Ras/PKA, Tor, and Sch9. PLoS Genet. 2008;4(1):e13. doi: 10.1371/journal.pgen.0040013. [DOI] [PMC free article] [PubMed] [Google Scholar]
- 11.De Virgilio C. The essence of yeast quiescence. FEMS Microbiol Rev. 2012;36(2):306–339. doi: 10.1111/j.1574-6976.2011.00287.x. [DOI] [PubMed] [Google Scholar]
- 12.Rustici G, et al. ArrayExpress update—Trends in database growth and links to data analysis tools. Nucleic Acids Res. 2013;41(Database issue):D987–D990. doi: 10.1093/nar/gks1174. [DOI] [PMC free article] [PubMed] [Google Scholar]
- 13.Verwaal R, et al. HXT5 expression is under control of STRE and HAP elements in the HXT5 promoter. Yeast. 2004;21(9):747–757. doi: 10.1002/yea.1106. [DOI] [PubMed] [Google Scholar]
- 14.Galdieri L, Mehrotra S, Yu S, Vancura A. Transcriptional regulation in yeast during diauxic shift and stationary phase. OMICS. 2010;14(6):629–638. doi: 10.1089/omi.2010.0069. [DOI] [PMC free article] [PubMed] [Google Scholar]
- 15.Xie Z, Nair U, Klionsky DJ. Atg8 controls phagophore expansion during autophagosome formation. Mol Biol Cell. 2008;19(8):3290–3298. doi: 10.1091/mbc.E07-12-1292. [DOI] [PMC free article] [PubMed] [Google Scholar]
- 16.Klionsky DJ, Cuervo AM, Seglen PO. Methods for monitoring autophagy from yeast to human. Autophagy. 2007;3(3):181–206. doi: 10.4161/auto.3678. [DOI] [PubMed] [Google Scholar]
- 17.Heitman J, Movva NR, Hall MN. Targets for cell cycle arrest by the immunosuppressant rapamycin in yeast. Science. 1991;253(5022):905–909. doi: 10.1126/science.1715094. [DOI] [PubMed] [Google Scholar]
- 18.Stephan JS, Yeh Y-Y, Ramachandran V, Deminoff SJ, Herman PK. The Tor and PKA signaling pathways independently target the Atg1/Atg13 protein kinase complex to control autophagy. Proc Natl Acad Sci USA. 2009;106(40):17049–17054. doi: 10.1073/pnas.0903316106. [DOI] [PMC free article] [PubMed] [Google Scholar]
- 19.Takahara T, Maeda T. Transient sequestration of TORC1 into stress granules during heat stress. Mol Cell. 2012;47(2):242–252. doi: 10.1016/j.molcel.2012.05.019. [DOI] [PubMed] [Google Scholar]
- 20.Urban J, et al. Sch9 is a major target of TORC1 in Saccharomyces cerevisiae. Mol Cell. 2007;26(5):663–674. doi: 10.1016/j.molcel.2007.04.020. [DOI] [PubMed] [Google Scholar]
- 21.Buchan JR, Muhlrad D, Parker R. P bodies promote stress granule assembly in Saccharomyces cerevisiae. J Cell Biol. 2008;183(3):441–455. doi: 10.1083/jcb.200807043. [DOI] [PMC free article] [PubMed] [Google Scholar]
- 22.Buchan JR, Parker R. Eukaryotic stress granules: The ins and outs of translation. Mol Cell. 2009;36(6):932–941. doi: 10.1016/j.molcel.2009.11.020. [DOI] [PMC free article] [PubMed] [Google Scholar]
- 23.Shah KH, Zhang B, Ramachandran V, Herman PK. Processing body and stress granule assembly occur by independent and differentially regulated pathways in Saccharomyces cerevisiae. Genetics. 2013;193(1):109–123. doi: 10.1534/genetics.112.146993. [DOI] [PMC free article] [PubMed] [Google Scholar]
- 24.Loewith R, Hall MN. Target of rapamycin (TOR) in nutrient signaling and growth control. Genetics. 2011;189(4):1177–1201. doi: 10.1534/genetics.111.133363. [DOI] [PMC free article] [PubMed] [Google Scholar]
- 25.DeRisi JL, Iyer VR, Brown PO. Exploring the metabolic and genetic control of gene expression on a genomic scale. Science. 1997;278(5338):680–686. doi: 10.1126/science.278.5338.680. [DOI] [PubMed] [Google Scholar]
- 26.Mujacic M, Baneyx F. Regulation of Escherichia coli hchA, a stress-inducible gene encoding molecular chaperone Hsp31. Mol Microbiol. 2006;60(6):1576–1589. doi: 10.1111/j.1365-2958.2006.05207.x. [DOI] [PubMed] [Google Scholar]
- 27.Lee J-Y, Kim C, Kim J, Park C. DJR-1.2 of Caenorhabditis elegans is induced by DAF-16 in the dauer state. Gene. 2013;524(2):373–376. doi: 10.1016/j.gene.2013.04.032. [DOI] [PubMed] [Google Scholar]
- 28.Liu H, et al. Expression and role of DJ-1 in leukemia. Biochem Biophys Res Commun. 2008;375(3):477–483. doi: 10.1016/j.bbrc.2008.08.046. [DOI] [PubMed] [Google Scholar]
- 29.Zaragoza D, Ghavidel A, Heitman J, Schultz MC. Rapamycin induces the G0 program of transcriptional repression in yeast by interfering with the TOR signaling pathway. Mol Cell Biol. 1998;18(8):4463–4470. doi: 10.1128/mcb.18.8.4463. [DOI] [PMC free article] [PubMed] [Google Scholar]
- 30.Gray JV, et al. “Sleeping beauty”: Quiescence in Saccharomyces cerevisiae. Microbiol Mol Biol Rev. 2004;68(2):187–206. doi: 10.1128/MMBR.68.2.187-206.2004. [DOI] [PMC free article] [PubMed] [Google Scholar]
- 31.Dechant R, Peter M. Nutrient signals driving cell growth. Curr Opin Cell Biol. 2008;20(6):678–687. doi: 10.1016/j.ceb.2008.09.009. [DOI] [PubMed] [Google Scholar]
- 32.Laplante M, Sabatini DM. mTOR signaling in growth control and disease. Cell. 2012;149(2):274–293. doi: 10.1016/j.cell.2012.03.017. [DOI] [PMC free article] [PubMed] [Google Scholar]
- 33.Swinnen E, et al. Rim15 and the crossroads of nutrient signalling pathways in Saccharomyces cerevisiae. Cell Div. 2006;1:3. doi: 10.1186/1747-1028-1-3. [DOI] [PMC free article] [PubMed] [Google Scholar]
- 34.Tudisca V, et al. Differential localization to cytoplasm, nucleus or P-bodies of yeast PKA subunits under different growth conditions. Eur J Cell Biol. 2010;89(4):339–348. doi: 10.1016/j.ejcb.2009.08.005. [DOI] [PubMed] [Google Scholar]
- 35.Krebiehl G, et al. Reduced basal autophagy and impaired mitochondrial dynamics due to loss of Parkinson’s disease-associated protein DJ-1. PLoS ONE. 2010;5(2):e9367. doi: 10.1371/journal.pone.0009367. [DOI] [PMC free article] [PubMed] [Google Scholar]
- 36.Irrcher I, et al. Loss of the Parkinson’s disease-linked gene DJ-1 perturbs mitochondrial dynamics. Hum Mol Genet. 2010;19(19):3734–3746. doi: 10.1093/hmg/ddq288. [DOI] [PubMed] [Google Scholar]
- 37.Ren H, et al. DJ-1, a cancer and Parkinson’s disease associated protein, regulates autophagy through JNK pathway in cancer cells. Cancer Lett. 2010;297(1):101–108. doi: 10.1016/j.canlet.2010.05.001. [DOI] [PubMed] [Google Scholar]
- 38.Hod Y, Pentyala SN, Whyard TC, El-Maghrabi MR. Identification and characterization of a novel protein that regulates RNA-protein interaction. J Cell Biochem. 1999;72(3):435–444. [PubMed] [Google Scholar]
Associated Data
This section collects any data citations, data availability statements, or supplementary materials included in this article.