

Abstract
Although many lung diseases are associated with hypoxia, alveolar type II epithelial (ATII) cell impairment, and pulmonary surfactant dysfunction, the effects of O2 limitation on metabolic pathways necessary to maintain cellular energy in ATII cells have not been studied extensively. This report presents results of targeted assays aimed at identifying specific metabolic processes that contribute to energy homeostasis using primary ATII cells and a model ATII cell line, mouse lung epithelial 15 (MLE-15), cultured in normoxic and hypoxic conditions. MLEs cultured in normoxia demonstrated a robust O2 consumption rate (OCR) coupled to ATP generation and limited extracellular lactate production, indicating reliance on oxidative phosphorylation for ATP production. Pharmacological uncoupling of respiration increased OCR in normoxic cultures to 175% of basal levels, indicating significant spare respiratory capacity. However, when exposed to hypoxia for 20 h, basal O2 consumption fell to 60% of normoxic rates, and cells maintained only ∼50% of normoxic spare respiratory capacity, indicating suppression of mitochondrial function, although intracellular ATP levels remained at near normoxic levels. Moreover, while hypoxic exposure stimulated glycogen synthesis and storage in MLE-15, glycolytic rate (as measured by lactate generation) was not significantly increased in the cells, despite enhanced expression of several enzymes related to glycolysis. These results were largely recapitulated in murine primary ATII, demonstrating MLE-15 suitability for modeling ATII metabolism. The ability of ATII cells to maintain ATP levels in hypoxia without enhancing glycolysis suggests that these cells are exceptionally efficient at conserving ATP to maintain bioenergetic homeostasis under O2 limitation.
Keywords: mitochondrial function, metabolism
the alveolar epithelium forms the barrier between the pulmonary vasculature and the external milieu and serves as the surface across which O2 and waste gases are exchanged. Because of their physical location, the cells that line alveoli in developed human lungs are normally exposed to an exceptionally well-oxygenated environment of ∼13% O2 in nondiseased lungs (i.e., a Po2 of ∼105 mmHg compared with a Po2 of ∼40 mmHg in peripheral blood) (33). However, decreases in alveolar O2 tensions (pulmonary hypoxia) can result from a number of pathological conditions, including chronic obstructive pulmonary disease, lung cancers, and pulmonary hypertension and edema (34). In contrast, differentiation and development of the fetal lung distal epithelium normally occurs in low O2 (1–5% O2) (19), with hypoxia-related signaling in the pulmonary epithelium throughout gestation (8, 9, 28). This condition is critical for normal fetal lung development and preparation for breathing after birth (1, 32). Thus, elucidating the molecular mechanisms of pulmonary adaptations to low O2 tension is of particular clinical significance for understanding both lung pathology and normal development.
Two distinct cell types compose the alveolar epithelium. Large, squamous alveolar epithelial type I (ATI) cells cover ∼95% of the surface area and serve as the primary mediators of gas exchange across the epithelial barrier. Alveolar type II (ATII) epithelial cells are the primary producers of pulmonary surfactant and also have important roles in ion and fluid transport (21, 22, 37), innate immunity (20), and as progenitors capable of repopulating ATI cells following physical damage or stress (13). Maintenance of surfactant homeostasis, which is essential for normal lung function, requires considerable metabolic energy investment by ATII cells for lipid and protein synthesis, packaging, and secretion (31). Thus, ATII cells are highly metabolically active under normal physiological conditions.
Metabolic changes are a fundamental component of the cellular response to hypoxia. In general, the hypoxic phenotype is characterized by a shift away from primary reliance on oxidative phosphorylation to enhanced glycolysis for maintenance of energy homeostasis; however, the typical response varies significantly by cell type and depends largely on cell-specific function and energy demand. AMP-activated kinase, mammalian target of rapamycin, and many other signaling pathways are involved in mediating cellular metabolic homeostasis and response to stressors, including O2 limitation (17). At the level of O2 sensing and initiation of response pathways, hypoxic responses are primarily mediated by the family of O2-sensitive hypoxia-inducible factor (HIF) transcription factor proteins. Multiple HIF isoforms regulate a wide variety of genes involved in directing cell energy metabolism under conditions of limited O2 availability and, in the lung, have been shown additionally to play critical roles in alveolar development (16) and production of pulmonary surfactant (1).
Previous work has illustrated numerous ATII-specific responses to short-term hypoxic exposure (e.g., <8 h). These cellular processes include proangiogenesis signaling, generation of reactive O2 species and activation of AMP-activated kinase (33), upregulation of glucose transporters and their localization to the cell membrane (25), and internalization and inactivation of Na+-K+-ATPase channels (10, 14, 23). These processes result in decreased ATP demand (and, consequentially, a return to steady-state cellular ATP levels) and enhanced glucose import. However, the molecular impacts of longer-term hypoxia on ATII cells have received far less attention. Neither steady-state ATP levels (25) nor cell survival (36) are impaired in primary alveolar epithelial cells exposed to prolonged hypoxia, but the enduring metabolic adaptations facilitating this robust resistance to hypoxic stress are poorly characterized.
Given their exceptional resistance to fluctuation from the well-oxygenated environment in which they reside under normal physiological conditions, we hypothesize that ATII cells undergo unique cell type-specific metabolic adaptations to hypoxia. Here we present findings characterizing the impact of long-term hypoxic exposure on ATII cellular metabolism and report cell-specific transcriptional and proteomic responses that contribute to ATII cell adaptation to O2 limitation. Our results demonstrate that hypoxia induces molecular remodeling of both the glycolytic and oxidative pathways in ATII cells but that maintained oxidative phosphorylation is sufficient to fulfill energy requirements and maintain bioenergetics homeostasis without enhanced anaerobic glycolysis.
MATERIALS AND METHODS
Reagents.
All cell culture media and supplements were obtained from Life Technologies (Grand Island, NY) except for dimethyloxalylglycine (DMOG), mitochondrial inhibitors, and general chemicals from Sigma-Aldrich (St. Louis, MO); metabolic flux assay medium and consumables from Seahorse Bioscience (North Billerica, MA); and fetal bovine serum (FBS) from Atlanta Biologicals (Lawrenceville, GA). CyDyes, IPG strips, and differential gel electrophoresis (DIGE) consumables were obtained from GE Healthcare Life Sciences (Pittsburgh, PA).
Cell culture.
The model ATII cell line, mouse lung epithelial 15 (MLE-15, a gift from Drs. Stephan Glasser and Jeffrey Whitsett, Cincinnati Children's Hospital Medical Center, Cincinnati, OH), was employed for all experiments. Like ATII cells, MLE-15 cells express and secrete surfactant proteins SP-B and SP-C (7). MLE-15 cultures were maintained in a humidified incubator under ambient air (normoxia, 21% O2) and 5% CO2 at 37°C. Stock and experimental cultures were grown in HITES medium (7). Cells were plated at densities designated for each assay and allowed to attach to culture plates/flasks in the normoxic incubator before initiation of experimental conditions. Hypoxic exposures were performed by incubation in a hypoxic chamber (Biospherix, Redfield, NY) with 1.5% O2, 5% CO2 at 37°C. Prolyl-4-hydroxylase inhibitor (PHI) exposures were performed by adding 250 μM DMOG, a 2-oxoglutarate analog (7, 35).
Isolation and culture of ATII primary cells.
ATII cells were isolated from mouse lungs as described previously (30), with minor modifications. All procedures were conducted under approved Institutional Animal Care and Use Committee protocols. Briefly, female C57B/6 mice (∼6 wk old) were anesthetized by intraperitoneal injection of freshly prepared tribromoethanol solution (125 mg/kg; 15 μl of 2.5% Avertin/g body wt) and exsanguinated, and lungs were perfused via saline injection (10 ml) in the right atrium. The trachea was cannulated, and lungs were filled with 3 ml dispase (Thermo Fisher Scientific, Waltham, MA), followed immediately with 0.5 ml low-melt agarose (45°C), which was solidified by addition of ice to the chest cavity. Lungs were removed and incubated in dispase and DNase I (Sigma). Cell suspensions were treated with red blood cell lysing buffer (Sigma), filtered (100 to 40 to 20 μm nylon gauze), collected by centrifugation, and incubated on plates precoated with donkey serum (BD Biosciences, San Jose, CA). After incubation, ATII cells were panned from the plates, collected, and cultured on Matrigel (BD Biosciences)-coated plates in small airway epithelial cell (SAEC) medium (Lonza, Walkersville, MD) plus 5% fetal bovine serum (Atlanta Biologicals, Flowery Branch, GA). Yields of ATII were ∼4–6 × 10⁶ cells/mouse with a purity of cell preparations typically >90% ATII, as assessed by modified Papanicolaou stain (2).
Metabolic flux analysis.
Cellular O2 consumption and acid generation were assessed using a Seahorse Bioscience XF24 instrument. Cells were plated in 24-well XF assay plates in either HITES (MLE-15) or SAEC/5% FBS (primary ATII cells) media at a density of 5 × 10⁴ cells/well in described growth conditions. Growth medium was removed before assay and replaced with unbuffered Seahorse Bioscience assay media at pH 7.4, supplemented with 11.1 mM glucose or 5.5 mM glucose, 2 mM Glutamax, 10 μg/ml insulin, 10 μg/ml transferrin, and 40 nM sodium selenite, and either 1% FBS (MLE-15) or 5% FBS (primary ATII cells). For basal O2 consumption rate (OCR) and proton production rate (PPR) determination, O2 concentrations and pH were simultaneously measured during four 2-min periods over a total span of 20 min. After this period, the mitochondrial electron transport/ATP-synthesis uncoupling reagent carbonyl cyanide-p-trifluoromethoxy-phenylhydrazone (FCCP) was injected to a final concentration of 0.5 μM to determine maximum OCR and spare respiratory capacity (as indicated by the increase over basal respiration in response to mitochondrial uncoupling) (3, 35). A separate set of cultures was assayed to determine OCR coupling to ATP generation by injecting the ATP synthase-inhibiting reagent oligomycin A to a final concentration of 1.5 μM, and OCR dedicated to ATP production was calculated as the percentage difference between OCR before and following injection (3). Raw OCR data were transformed via the “Level (Direct) AKOS” algorithm (6) using the Seahorse XF24 1.5.0.69 software package. The “Variable Technique” within the software was used to calculate PPR from measured rates of extracellular pH change with compensation for media buffering capacity. Analysis of significance between normoxic control and treatment groups was performed using Student's t-test or paired Student's t-test.
Measurements of intracellular ATP, lactate, and glycogen content.
ATP content of cultured cells was measured using the CellTitre Glo Luminescent cell viability assay (Promega, Madison, WI) as per the manufacturer's instructions. Cells (grown in parallel to metabolic flux assay cultures) were plated on 96-well plates at a density of 5 × 10³ cells/well and cultured for 20 h in normoxia, hypoxia, or media containing 250 μM DMOG.
Extracellular lactate production was measured using a probe-based assay (Lactate Colorimetric/Fluorimetric Assay Kit; BioVision, Milpitas, CA) according to the manufacturer's instructions. Cells were plated on six-well plates at densities of 5 × 10⁵ cells/well and maintained in normoxic or hypoxic conditions for 20 h. Cells were then rinsed two times with PBS, media were replaced with modified HITES medium containing 0.5% fetal bovine serum, and culture plates were returned to normoxic or hypoxic conditions. Culture media was sampled at time points 0, 15, 30, 60, and 120 min after media was replaced. Media samples were analyzed via colorimetric assay and cell lysates via fluorimetric assay. Total protein of cell lysates was determined via BCA assay for normalization. Intracellular glycogen content was determined using a fluorimetric probe-based assay (Glycogen Assay Kit; BioVision) as per the manufacturer's instructions. MLE-15 cells were plated on six-well plates at densities of 2.5 × 10⁵ cells/well. Normoxic control cultures were maintained at 21% O2 for 3 days. Hypoxia and DMOG-treated cultures were allowed to incubate in normoxia for 20 h, after which media was replaced and the cultures moved into treatment conditions (hypoxic chamber or media containing a final concentration of 250 μM DMOG, respectively) for 48 h, after which the media was replaced and the cultures moved into normoxic conditions for 20 h. Glycogen values were corrected for sample glucose content and normalized to total cellular protein concentration. Analysis of significance between normoxic control and treatment groups was performed using Student's t-test, with P values <0.05 being considered significant.
qPCR and arrays.
For RNA harvest, aliquots of MLE-15 were seeded on six-well culture plates at 1.5 × 10⁵ cells/well. After 20 h of exposure to experimental conditions, lysates from sample wells were pooled for each condition for RNA extraction using the RNeasy Mini Kit (QIAGEN, Valencia, CA), followed by DNase I digestion. cDNA synthesis was performed using 2 μg total RNA, a mixture of random 9-mer and oligo(dT) priming, and Moloney murine leukemia virus reverse transcriptase (reagents from New England Biolabs, Ipswich, MA). Glucose metabolism qPCR arrays for mouse (PAMM-006Z; SABiosciences, Valencia, CA) were performed according to the manufacturer's instructions in triplicate using a Mastercycler RealPlex2 (Eppendorf, Hamburg, Germany). Cycle threshold (Ct) values for all genes of interest were normalized to β-actin and hypoxanthine-ribosyl transferase-averaged relative expression, with ΔCt values averaged for each gene after normalization. Fold change values for target genes between hypoxia and normoxia groups were calculated using ΔΔCt analysis to determine expression fold difference. Genes with greater than twofold difference between normoxia and hypoxia groups are reported as differentially up- or downregulated in response to hypoxia treatment. Significance of differential expression was assessed via Student's t-test of the replicate 2−ΔCt values for each gene, with P values <0.05 considered significant.
DIGE.
DIGE 2D-PAGE was a modified version of CyDye labeling protocols provided by the manufacturer (GE Healthcare). Briefly, 2 × 10⁵ cells/condition were lysed [4 M urea, 1 M thiourea, 2 mM MgCl2, 40 mM Tris, pH 8.0, 1% Triton X-100 plus protease inhibitor cocktail (Sigma) and phosphatase inhibitors (1 mM Na3VO4, 5 mM NaF)] and then treated with benzonase nuclease (Sigma) for 20 min on ice. Samples (50 μg protein) were acetone precipitated, resolubilized in CyDye-labeling buffer, and labeled according to the manufacturer's protocol (GE LifeSciences). Samples were adsorbed to 24-cm IPG strips and separated by isoelectric focusing on an Ettan IPGphor II system (GE) to 60,000 total volt-hours. Proteins on IPG strips were reduced, alkylated, and then separated by SDS-PAGE (24-cm 12.5% gels) on an HPE-FlatTop Tower horizontal electrophoresis system (Gel, San Francisco, CA) according to the manufacturer's protocol.
Images of gels were acquired using a Typhoon Trio+ Imager (GE LifeSciences). SameSpots v.4.3 2D analysis software (Nonlinear Dynamics, Durham, NC) was used for differential protein expression analysis of normalized protein spot (peak) densitometric volumes. Spot numbers and spot-picking lists of targeted spots, having values of P < 0.05 after Bonferoni correction and differential expression levels exceeding ±1.5-fold expression vs. normoxia values, were generated by the SameSpots software. Thirty-nine protein spots met this criteria, were picked from the gel (Ettan Spot Picker; GE Lifesciences), destained, washed, and dried via vacuum centrifuge. Digestion of protein was performed via incubation with trypsin overnight, followed by dehydration and then reconstitution with 10 μl of 2% acetonitrile/0.2% formic acid.
Samples were analyzed via liquid chromatography-electrospray ionization tandem mass spectrometry (LC-MS/MS) on a linear ion trap mass spectrometer (LTQ; Thermo Finnigan) coupled to an LC Packings nano LC system. A 75-μm C18 LC column (Microtech Scientific) was used with a 60-min gradient from 2% acetonitrile/0.2% formic acid to 60% acetonitrile/0.2% formic acid. Data dependent analysis was performed on all ions above an ion count of 1,000. MS/MS data were searched against the NCBI human database using Thermo Finnigan Bioworks 3.3.1 SP1 software. Variable modifications of methionine oxidation were considered. Protein identifications met minimum criteria of a protein probability of 1.0 × 10⁻³ or better and cross-correlation value vs. charge state >1.5, 2.0, and 2.5 for +1, +2, and +3 ions, with at least four unique peptides matching the protein. Of 39 picked spots analyzed, data for only 21 identified proteins from 17 spots met these criteria.
RESULTS
MLE-15 and primary ATII cells maintain ATP homeostasis during hypoxia and simulated hypoxia.
Intracellular ATP content was measured following 20 h culture in hypoxia vs. normoxia to examine changes in energy homeostasis in MLE-15 (a standard ATII-like murine cell line) and mouse primary ATII cells. In addition to culture of cells in a controlled hypoxic environment, a separate set of MLE-15 cultures was exposed to DMOG, a PHI that promotes O2-independent stabilization of HIFs. Neither 20 h growth in hypoxia (1.5% O2) nor exposure to DMOG resulted in significant decreases in cellular ATP content for MLE-15 cells vs. normoxia controls (Fig. 1). Similar to MLE-15 cells, primary ATII cells maintained ATP concentrations near normoxic levels following 20 h exposure to hypoxia, experiencing only a small (albeit significant) decrease in ATP concentration. These findings indicate that both MLE-15 and primary ATII cells are able to maintain steady-state energy balance during hypoxia.
Fig. 1.
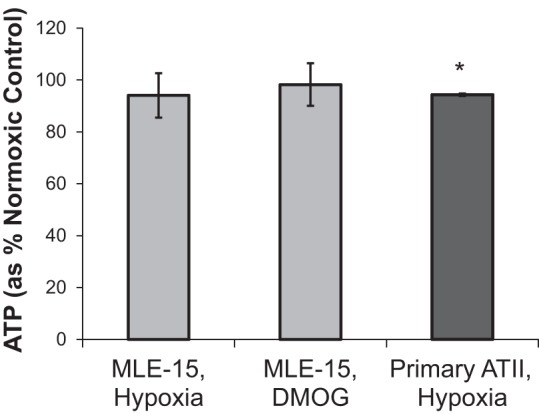
Hypoxia and prolyl-4-hydroxylase inhibitor (PHI) exposure do not alter steady-state normoxic ATP concentration in alveolar type II (ATII) cells. ATP was measured in mouse lung epithelial 15 (MLE-15) cells and primary ATII cells exposed for 20 h to hypoxia (1.5% O2) and compared with parallel control cultures exposed to normoxia (21% O2), as described in materials and methods. An additional set of MLE-15 cultures was exposed to the pharmacological hypoxia mimic dimethyloxalylglycine (DMOG). Samples were assayed in triplicate per plate using luminescent assay. Plates were run in quadruplicate for MLE-15, triplicate for primary ATII. *P < 0.05 vs. paired normoxia control. Error bars represent ± SE.
ATII cell metabolism is highly dependent on O2 consumption.
Cellular ATP is generated via O2-dependent (oxidative phosphorylation) and -independent means (glycolysis). To determine how hypoxia impacts the relative contribution of either pathway to ATP homeostasis in MLE-15 and primary ATII cells, we analyzed indicators of glycolysis and mitochondrial respiration via sensitive, real-time measurements of PPR (extracellular acidification) and OCR. MLE-15 cultures grown in normoxia consumed O2 at an average basal rate of 12.7 ± 1.7 pmol O2·min−1·μg protein−1, whereas the basal OCR in normoxia for primary ATII cells was 25.6 ± 1.4 pmol O2·min−1·μg protein−1 (Fig. 2A). The maximal functional capacity of mitochondrial electron transport was assessed following basal measurements by exposing cells to an electron transport chain/ATP synthase uncoupling molecule, FCCP. The difference between basal and uncoupled OCR measurements indicates the spare respiratory capacity of the cell, or the ability to perform respiration above basal level. OCR measurements following addition of FCCP indicated that uncoupled respiration rates for MLE-15 or ATII cells cultured in normoxia were ∼175% and 132% of basal OCR, respectively (22.6 ± 4.0 pmol O2·min−1·μg protein−1 for MLE cells and 38.2 ± 4.0 pmol O2·min−1·μg protein−1 for primary ATII cells), demonstrating a significant reserve of potential mitochondrial functional capacities (Fig. 2A). Inhibition of oxidative ATP production by exposure of MLE-15 cells to oligomycin A induced a 50% decrease in OCR, demonstrating that MLE-15 O2 consumption in normoxic conditions is coupled to ATP generation with about 50% of O2 consumed through oxidative phosphorylation (Fig. 2B).
Fig. 2.
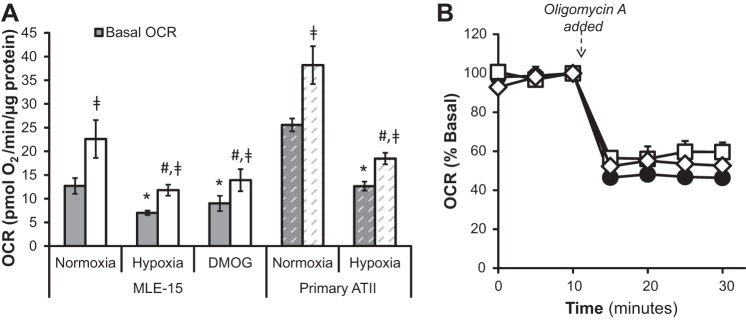
Hypoxia and PHI suppress basal and maximal respiration. A: O2 consumption rate (OCR) was measured for MLE-15 cells and primary ATII cells cultured in normoxia (21% O2) or hypoxia (1.5% O2). An additional set of MLE-15 cultures was exposed to PHI (DMOG). Following measurements of basal respiration (gray bars), carbonyl cyanide-p-trifluoromethoxy-phenylhydrazone (FCCP) was added to the assay media to measure uncoupled OCR (white bars). B: the proportion of O2 consumption dedicated to generation of ATP via oxidative phosphorylation was determined by measuring OCR before and after addition of oligomycin A, an inhibitor of ATP synthase, to assay media. OCR response to oligomycin A was measured in MLE-15 cultured in normoxia (●), hypoxia (□), and DMOG (◇). For MLE-15 cultures, samples were assayed minimally in quadruplicate for each condition, and plates were run in triplicate. For primary cultures, a total of six single-well experiments for each condition. *Significant difference (P < 0.05) between treatment group and normoxic control basal OCR. #Significant difference between treatment group and normoxic control uncoupled OCR. □Significant difference between basal and uncoupled OCR for a given treatment. Error bars represent ± SE.
Hypoxia suppresses oxidative metabolism in ATII cells.
After 20 h exposure to hypoxia or DMOG, basal OCR for MLE-15 cells was reduced to 55 and 70%, respectively, whereas that for primary ATII cells was reduced to ∼50% of rates measured in corresponding normoxic control cultures (Fig. 2A). Whereas hypoxia- and DMOG-exposed MLE-15 cells did maintain significant spare respiratory capacity, uncoupled (maximal) respiration rates for both conditions were ∼50% and 40% lower, respectively, than those of normoxic cultures. In fact, maximal OCR for hypoxia or DMOG-treated cells only reached the basal OCR of normoxic MLE-15 cells, indicating that both hypoxia and PHI reduce the capacity of MLE-15 to perform respiration. A similar reduction of 50% in maximal OCR was observed for primary ATII cells cultured in hypoxia compared with normoxic controls. Maximal OCR as percentage of basal respiration did not differ between normoxic, hypoxic, and DMOG exposures, being ∼175% (MLE cells) or 150% (primary ATII cells) of the respective basal OCR values. This demonstrates that basal and maximal OCR are suppressed to a similar degree under the treatment conditions. The proportion of total O2 consumption dedicated to ATP production also did not differ significantly from normoxic MLE-15, as indicated by the similar effect of oligomycin A for all conditions (Fig. 2B).
Hypoxic exposure does not enhance glycolytic function in ATII cells.
Basal PPR, an indicator of lactic acid generation associated with glycolytic activity, did not differ significantly from normoxic control for either hypoxic or DMOG-treated MLE-15 cultures (Fig. 3). As with measured OCR, basal normoxic PPR values for primary ATII were approximately twofold higher than those obtained for MLE-15. Unlike MLE-15, in which neither hypoxia nor DMOG induced change in PPR, primary cells experienced a significant decrease in PPR following hypoxic exposure.
Fig. 3.
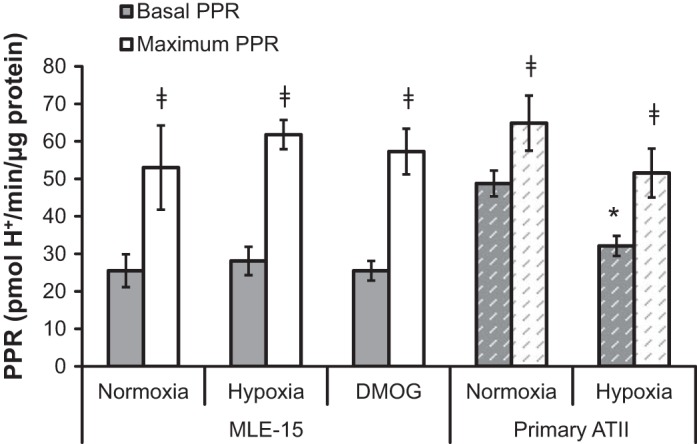
Hypoxia and PHI do not impact extracellular proton production rates (PPR). PPR was measured as an indicator of glycolysis in MLE-15 and primary ATII cells exposed to hypoxia compared with normoxic controls. An additional set of MLE-15 cultures was exposed to PHI (DMOG). PPR measurements were performed under basal conditions (gray bars) and following addition of FCCP to assay media (“maximal PPR,” white bars). For MLE-15, samples were assayed minimally in quadruplicate for each condition, and plates were run in triplicate. For primary cultures, a total of six single-well experiments for each condition. *Significant difference (P < 0.05) between treatment group and normoxic control. Error bars represent ± SE.
Mitochondrial uncoupling via FCCP exposure abates oxidative ATP generation in MLE-15 cells, leading to a compensatory increase in glycolysis to maintain production. Normoxia, hypoxia, and DMOG treatments all demonstrated a similar glycolytic response to FCCP (Fig. 3), indicating similar glycolytic capacities between conditions and cell types. Maximal PPR values for primary ATII were similar to those measured in MLE-15, although this represented only 130% of their basal PPR compared with ∼200% in MLE-15. The primary cell PPR response to FCCP did not differ significantly from normoxic controls, indicating that ability to perform glycolysis was maintained (Fig. 3).
To confirm these extracellular flux observations, lactate was measured directly in culture media of MLE-15 cells exposed to normoxia and hypoxia. As expected, these measurements showed that generation of extracellular lactate was not increased by hypoxic exposure (Fig. 4A) nor did hypoxia increase intracellular lactate concentrations (Fig. 4B) in exposed cells.
Fig. 4.

Hypoxia does not alter cellular lactate generation in MLE-15 cells. A: lactate was measured in media of MLE-15 cultures exposed to normoxia (●) and hypoxia (□). Time points indicate time passed after the addition of fresh media following 20 h exposure. B: intracellular lactate was measured in cell homogenates immediately following collection of media samples at time 120 min in A. Experiments were performed in triplicate. Error bars represent ± SE.
The ratio of protons produced to O2 consumed generally provides a relative measure of reliance on glycolytic vs. oxidative pathways for ATP generation. The normoxic PPR/OCR values for MLE-15 and primary ATII are the same (2.1 ± 0.29 and 1.9 ± 0.04, respectively) (Fig. 5). Hypoxia (and DMOG in MLE-15) increased this ratio, seeming to demonstrate a more glycolytic phenotype; however, because PPR values did not change in response to hypoxia (Fig. 3), this shift is likely a consequence of reduced O2 consumption (i.e., lower OCR) rather than an increased glycolytic rate. Taken together, these metabolic results indicate that hypoxia exposure of ATII cells reduces the rate of ATP production by oxidative phosphorylation (Figs. 2 and 5) without a concomitant increase in glycolytic rate (Figs. 3 and 4). Therefore, the maintenance of a relatively stable intracellular ATP concentration during hypoxia (Fig. 1) is likely the result of a parallel reduction in ATP turnover/usage.
Fig. 5.
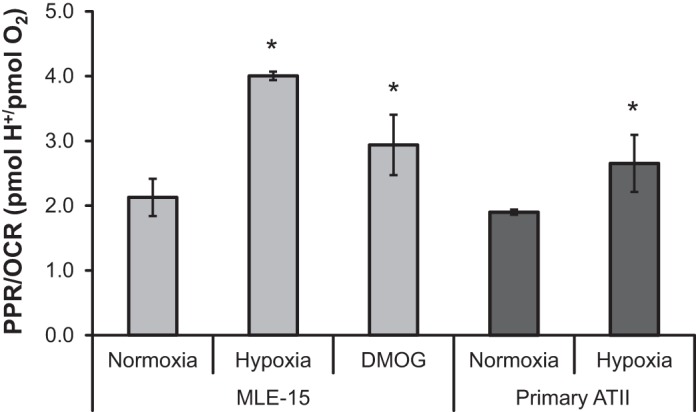
Suppression of OCR during hypoxia and PHI exposure increases relative reliance on glycolysis. Basal PPR and basal OCR measurements were used to generate a PPR-to-OCR ratio for MLE-15 and primary ATII cells exposed to hypoxia compared with normoxic controls. An additional set of MLE-15 cultures was exposed to PHI (DMOG). *Significant difference (P < 0.05) between treatment group and normoxic control. Error bars represent ± SE.
Hypoxia induces changes in ATII mRNA expression of metabolic enzymes.
A glucose metabolism-focused qPCR array was used to measure changes in gene expression associated with hypoxia exposure in MLE-15 cells. Detailed results from all genes included in the array are listed in Table 1; as indicated, results were replicated and verified for selected genes by additional qPCR with different primers (data not shown). Expression of genes related to glycolysis were collectively upregulated in response to hypoxia, including those associated directly with glycolytic ATP production (phosphoglycerate kinase) and major regulatory steps of glycolytic control (phosphofructokinase). Hypoxia triggered transcriptional upregulation of enzymes responsible for phosphorylation (hexokinase) and isomerization (phosphoglucomutase) of glucose for use in glycolysis or glycogenesis, as well as upregulation of gene transcripts related to glycogenesis, suggesting the potential for hypoxia to stimulate intracellular generation and storage of glycogen. Transcription of pyruvate dehydrogenase kinase (Pdk1), which inhibits activity of pyruvate dehydrogenase via phosphorylation [thereby limiting entry of pyruvate into tricarboxylic acid (TCA) cycle oxidative metabolism], was increased in response to hypoxia, whereas no significant changes in expression were observed for TCA cycle enzymes or those involved in other processes assessed [Supplemental Table S1 (Supplemental data for this article may be found on the American Journal of Physiology: Lung Cellular and Molecular Physiology website.)]
Table 1.
Hypoxia-dependent differential gene expression in MLE-15 cells
| Protein ID | Gene Name | Biological Process | Ref. Seq. ID | Fold Change* Hypoxia vs. Normoxia | P Value |
|---|---|---|---|---|---|
| Aldolase A, fructose-bisphosphate | Aldoa | Glycolysis | NM_007438 | 3.09 | 0.05 |
| Enolase 1, α-nonneuron | Eno1 | Glycolysis | NM_023119 | 3.17 | 0.03 |
| Glucan (1,4-α), branching enzyme 1 | Gbe1 | Glycogenesis | NM_028803 | 6.81† | 0.001 |
| Glucose phosphate isomerase 1 | Gpi1 | Glycolysis | NM_008155 | 3.91 | 0.04 |
| Glycogen synthase 1, muscle | Gys1 | Glycogenesis | NM_030678 | 5.27† | 0.04 |
| Hexokinase 2 | Hk2 | Glycolysis/glycogenesis | NM_198308 | 6.88† | 0.05 |
| Pyruvate dehydrogenase kinase 1 | Pdk1 | Glycolysis/TCA cycle | NM_172665 | 5.02† | 0.008 |
| Phosphofructokinase, liver, B-type | Pfkl | Glycolysis | NM_008826 | 3.62 | 0.02 |
| Phosphoglycerate kinase 1 | Pgk1 | Glycolysis | NM_008828 | 3.55† | 0.002 |
| Phosphoglucomutase 2 | Pgm2 | Glycolysis/glycogen Metabolism | NM_028132 | 4.51 | 0.02 |
| Triosephosphate isomerase 1 | Tpi1 | Glycolysis | NM_009415 | 2.87 | 0.05 |
MLE-15, mouse lung epithelial 15; TCA, tricarboxylic acid.
All genes meeting criteria of >2.0-fold change in gene expression and P < 0.05 (prior to rounding) are shown. Expression of all genes was increased after exposure to hypoxia vs. normoxia.
Expression changes validated via targeted PCR for selected genes.
Hypoxia alters the ATII cell proteome, including expression and/or modification of metabolic enzymes, transport proteins, and structural proteins.
To complement mRNA array analyses, differential protein expression for ATII cells exposed to hypoxia vs. normoxia was examined using quantitative DIGE of CyDye-labeled proteins. Identifications and fold expression changes of LC/MS-identified protein spots between normoxia and hypoxia are listed in Table 2. Consistent with qPCR gene array data, hypoxia alters expression and/or posttranslational modifications (yet unidentified) of several key enzymes of the glycolysis/gluconeogenesis pathway, including triose phosphate isomerase, fructose bisphosphate aldolase, and phosphoglycerate kinase, as indicated by differential expression within multiple protein spots (plugs) of the DIGE gels. Hence, these results suggest a shift in activity of these two pathways. Expression of enzyme isoforms involved in fatty acid biosynthesis (ATP citrate lyase) and β-oxidation (3-ketoacyl-CoA thiolase) are reduced upon exposure of MLE cells to hypoxia, as are expression levels of several proteins associated with transport or endocytosis (e.g., Rab5c GTPase and MDR-9).
Table 2.
Hypoxia-dependent differential protein expression in MLE-15 cells
| Average Normalized Volumes† |
|||||||
|---|---|---|---|---|---|---|---|
| Spot No. | Protein ID | Accession No. | Biological Process | Hypoxia | Normoxia | Fold Change‡ | ANOVA |
| 1608 | ATP citrate lyase | Q91V92 | Lipid metabolism | 0.612 | 2.898 | (4.7) | 0.0002 |
| 1631 | ATP Citrate Lyase | Q91V92 | Lipid metabolism | 1.273 | 2.200 | (1.7) | 0.003 |
| 1609 | ATP citrate lyase | Q91V92 | Lipid metabolism | 1.166 | 2.346 | (2.0) | 0.025 |
| 1003 | Fructose bisphosphate Aldolase A | P05064 | Glycolysis | 2.331 | 0.870 | 2.7 | 0.004 |
| Phosphoglycerate kinase 1 | P09411 | Glycolysis | |||||
| 516 | Fructose bisphosphate aldolase A | P05064 | Glycolysis | 0.577 | 1.203 | (2.1) | 0.0007 |
| 1616 | Triose phosphate isomerase | P17751 | Gluconeogenesis, glycolysis, pentose shunt | 2.167 | 0.787 | 2.8 | 0.004 |
| 1237 | Triose phosphate isomerase | P17751 | Gluconeogenesis, glycolysis, pentose shunt | 1.815 | 0.841 | 2.2 | 0.019 |
| 459 | Succinate dehydrogenase Fe-S subunit | Q9CQA3 | Electron transport | 0.630 | 1.960 | (3.1) | 0.002 |
| 869 | ATP synthase, mitoch precursor; subunit α | Q03265 | ATP synthesis | 0.461 | 2.456 | (5.3) | 0.028 |
| 1621 | 3-Ketoacyl-CoA thiolase, mitochondrial | Q8BWT1 | Fatty acid metabolism | 2.448 | 0.964 | 2.5 | 0.008 |
| 1280 | Rab5c GTPase | P35278 | Vesicle/protein transport | 2.323 | 0.488 | 4.8 | 0.00008 |
| Glyceraldehyde-3-phosphate dehydrogenase | P16858 | Glycolysis | |||||
| 1288 | Rab5c GTPase | P35278 | Vesicle/protein transport | 1.969 | 0.627 | 3.1 | 0.002 |
| 1493 | Multidrug resistance-associated protein-9 | Q80WJ6 | Transport | 1.347 | 0.602 | 2.2 | 0.002 |
| 1642 | Multidrug resistance-associated protein 9 | Q80WJ6 | Transport | 0.868 | 1.773 | (2.0) | 0.006 |
| 1634 | Cofilin-1 | P18760 | Cytoskeleton dynamics | 4.290 | 1.801 | 2.4 | 0.004 |
| Cofilin-2 | P45591 | Cytoskeleton dynamics | |||||
| 1622 | Junction plakoglobin | Q02257 | Cell adhesion | 1.647 | 0.731 | 2.3 | 0.0009 |
| Desmoplakin | E9Q557 | Cell adhesion | |||||
| 497 | Nucleolin | P09405 | Transcription | 0.834 | 2.744 | (3.3) | 0.007 |
Differential gel electrophoresis analysis was performed for 6 experimental replicates for each hypoxia and normoxia exposures (n = 6 experiments).
Decreased protein expression indicated by parentheses; all others were increased.
Hypoxia alters cellular metabolism to favor glycogen storage.
Given that hypoxia-induced expression changes in enzymes required for glucose import and glycogen synthesis, we hypothesized that MLE-15 cells would generate glycogen stores when challenged with hypoxia or PHI. Whereas cultures maintained in normoxia demonstrated minimal glycogen content, MLE cells assayed immediately following 48 h incubation in either hypoxia or DMOG demonstrated a significant increase in intracellular glycogen (Fig. 6). An additional subset of MLE-15 were cultured in hypoxia and subsequently transferred to normoxia for a 24-h “recovery” period. These samples showed intermediate levels, suggesting that stored glycogen was subsequently mobilized during recovery. Taken together, the data suggest that MLE-15 cells store glycogen under hypoxic conditions or when exposed to PHI, and subsequently metabolize the stored polysaccharide following reentry into normoxic conditions.
Fig. 6.
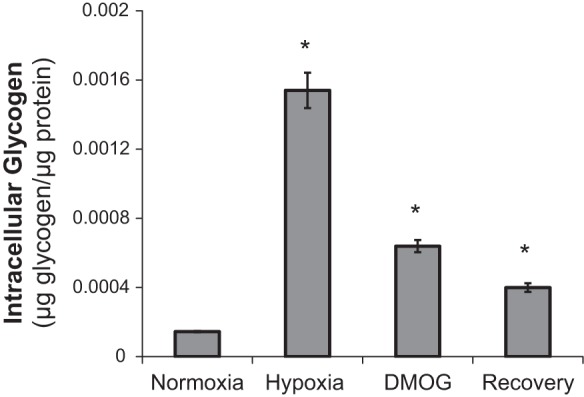
Hypoxia and PHI promote intracellular storage of glycogen, which is consumed upon recovery in normoxia. MLE-15 cultures were assayed for intracellular glycogen content using quantitative fluorimetric detection, as described in materials and methods. Samples were assayed in duplicate per assay plate and adjusted for sample glucose content; assays were run in triplicate. *P < 0.05 vs. normoxia control. Error bars represent ± SE.
DISCUSSION
This study used a multifaceted approach to comprehensively examine previously undefined shifts in ATII cell metabolism in response to ambient vs. low O2, combining metabolic assays, proteomics, and genomic approaches to identify specific metabolic enzymes and pathways that are altered as a function of changing O2 availability. We found that primary and model ATII cells are highly oxidative under normoxic conditions and that hypoxia results in decreased O2 consumption accompanied by proteomic and transcriptomic changes, ultimately generating a more glycolytic cellular phenotype by suppressing O2 consumption while maintaining considerable spare respiratory capacity and relatively stable levels of intracellular ATP. Interestingly, this overall decrease in O2 consumption is not accompanied by a dramatic increase in glycolytic rate, likely because of a parallel decrease in ATP turnover/usage by the cells. These results support previous observations that primary alveolar epithelial cells (25) are well-adapted to maintaining energy homeostasis over long-term periods of O2 limitation.
Metabolic parameters for ATII cells under normal O2 conditions have been established by these studies. MLE-15 and primary ATII cells in normoxia rely on oxidative phosphorylation to supply most ATP, with MLE-15 consuming O2 at basal rates in a range of values reported for primary bovine aortic endothelial cells (3). Maximal uncoupled respiratory capacity for MLE cells is ∼175% over basal metabolism, also within a range of that previously reported for endothelial cells (just over 200% basal) and lower than the 300% over basal reported for cardiomyocytes (3, 35). Primary ATII cells consume O2 and produce extracellular protons at basal rates approximately two times that of MLE cultures and maintain lower spare respiratory capacity (∼150% of basal). However, the relative reliance on oxidative vs. glycolytic metabolism (as reflected by the ratio of basal proton production to O2 consumption) is identical between cell type, indicating similar metabolic strategy for serving cell energy demand. Lower spare capacities suggest that primary ATII were operating closer to their maximal capacity in terms of both oxidative and glycolytic function at the time of measurement. The transformed nature of the MLE-15 cell line, as well as the fact that MLE-15 stocks had been maintained in culture for many passages while primary ATII were used within days of the isolation and purification procedures, may account for these differences. Nonetheless, the striking similarity of the PPR-to-OCR ratio indicates that MLE-15 faithfully model basal metabolic function for primary ATII.
A 20-h hypoxic treatment resulted in a similar degree of suppression of basal OCR in both MLE and primary ATII. The degree of OCR decrease in hypoxia observed here (40–50%) concurs with those previously recorded via respirometry for primary ATII isolated from rat lung and subjected to 2% O2 for 24 h (12), although these previous values were obtained using a different method to measure in vitro O2 consumption. However, we did not observe a parallel increase in hypoxic glycolytic rate, as measured by real-time PPR or lactate generation, strongly suggesting that the maintenance of relatively stable ATP concentrations in hypoxia during the time course of these experiments is the result of reduced ATP usage/turnover.
This maintenance of ATP homeostasis supports previous findings that alveolar epithelial cells maintain intracellular ATP concentrations near normoxic levels at 20 h exposure to 1.5% O2 (25). Similarly, the observation that PHI does not alter steady-state ATP in MLE-15 cells supports previous findings in cardiomyocytes exposed to similar concentrations of DMOG (35). ATP homeostasis in hypoxia has been explained in many cases as resulting from inhibition of energy-consuming processes. In ATII cells, activity of the Na+-K+-ATPase in maintenance of fluid homeostasis may account for as much as 20% of cellular ATP demand, with prior work demonstrating suppression of this process in hypoxia (10, 27). Hypoxic ATII cells undergo endocytosis and degradation of this plasma membrane-associated Na+-K+-ATPase, resulting in a large decrease in the necessity of the cell to produce ATP to maintain bioenergetic homeostasis. Reducing demand for ATP by downregulating this and other energy-requiring processes leads to decreased O2 consumption, since the need to perform oxidative phosphorylation is reduced.
However, results reported here support the conclusion that mitochondrial respiration is also directly suppressed through molecular alteration of the oxidative and glycolytic pathways. If reduced ATP demand was the only factor leading to reduced mitochondrial respiration in hypoxia, uncoupling of respiration would be expected to restore OCR in hypoxic cells to the level of uncoupled normoxic OCR. Rather, we find that hypoxic uncoupled OCR levels are ∼50% lower than normoxic uncoupled OCR, indicating that ATII cells experience direct suppression of mitochondrial functional capacity in hypoxia. Direct suppression of cell mitochondrial function may occur through different mechanisms, including altered expression of or damage to mitochondrial enzymes, substrate limitation for TCA cycle reactions and electron transport, and altered mitochondrial dynamics through biogenesis and/or mitophagy. Differentially expressed and/or modified metabolic enzymes identified in qPCR array and 2D DIGE were predominantly related to glycolysis and not directly to mitochondrial function. However, hypoxia did upregulate expression of PDK1 mRNA in cultures over threefold. PDKs inactivate pyruvate dehydrogenase via phosphorylation, leading to reduced oxidation of pyruvate in TCA reactions. Thus, enhanced PDK1 could contribute to suppression of mitochondrial OCR by restricting substrate availability for TCA cycle generation of reducing equivalents. No downregulation of expression of TCA cycle enzymes involved in oxidative metabolism was found, suggesting that suppressed mitochondrial function observed in flux analyses was not an effect of altered transcription of these mitochondrial enzymes.
Our findings in MLE-15 differ from the dramatic effects of HIF stabilization in cardiomyocytes, in which exposure to DMOG resulted in complete loss of spare respiratory capacity (35), an effect the authors termed “clamping” of mitochondrial function. By comparison, MLE-15 cells exposed to DMOG experienced clamping of O2 consumption at a rate higher than basal levels, indicated by the intermediate degree of spare respiratory capacity in treated cells (i.e., exceeding hypoxic basal OCR but falling well below normoxic capacity), observations that were recapitulated in both MLE-15 and primary ATII cells exposed to 1.5% O2. ATII cells may therefore be better able to adapt to the metabolic pressure of O2 limitation by reducing ATP demand and initiating expression and proteomic-level changes via hypoxia-inducible mechanisms while maintaining reserve capacity for ATP generation.
DIGE indicated that four enzymes involved in early steps of glycolysis are upregulated by exposure of MLEs to hypoxia. This is supported by the qPCR array analysis, which demonstrated collective upregulation of these (and other) glycolysis enzymes. Together, DIGE and qPCR data indicate that a response coordinated at the transcriptional and translational levels leads to enhanced glycolytic function under hypoxic conditions. In contrast, neither hypoxia nor PHI exposure resulted in an anticipated increase in extracellular proton flux. The relationship of these observations to glycolytic output was confirmed by direct measurements of lactate concentration in MLE-15 culture media, which showed no difference in the rate of extracellular lactate generation or intracellular lactate concentrations between normoxic and hypoxic cells. As with suppression of OCR in hypoxia, this may be explained in part by lowered ATP demand, allowing the reduced mitochondrial and glycolytic activity to still meet cellular needs without resulting in a dramatic rise in ADP, a major glycolytic stimulator. Changes in pathway gene expression would likely still occur, since many of these are primarily triggered through HIF activation by lowered O2 availability per se; however, decreased cellular demand for ATP could prevent enhanced glycolysis and associated lactate buildup despite enhanced glycolytic pathway gene expression. Alternative fates of lactate could also help to explain the apparent lack of enhanced glycolytic output. Fox et al. found that oxidation of labeled lactate in ATII cells isolated from fetal rat lungs occurred at a rate ∼20 times higher than rates measured for glucose (5), indicating that ATII cells may have considerable capacity to remove lactate intracellularly and could potentially metabolize lactate generated by other alveolar cells (i.e., ATI cells and/or fibroblasts) vs. extracellular extrusion. Other landmark studies using isolated perfused lung have demonstrated that lactate can serve as substrate for mitochondrial metabolism (4) and can be incorporated into lung lipids (29), supporting further intermediary metabolism of lactate by lung cells.
Results of qPCR assays indicated that, during hypoxia, genes coding for proteins involved in glycogenesis were upregulated, with HIFα stabilization through hypoxia or PHI leading to intracellular glycogen accumulation. Glycogenesis and glycogen storage in premature ATII cells is a critical step in preparing the developing fetal lung for breathing atmospheric air after birth: in late stages of development, glycogen stored in ATII is enzymatically degraded to form the backbone of phospholipids that constitute the lipid component of surfactant (31). In muscle cells, glycogen production is stimulated by hypoxia (26), whereas, in the developing lung, both glycogen storage and utilization have been associated with HIF2 signaling (16). Thus glycogenesis in model ATII cells during O2 limitation appears to recapitulate the physiology of premature ATII in the developing lung. Proteomic and transcriptomic data presented here show hypoxia-induced changes in expression and/or modification of enzymes involved in lipid synthesis and in intracellular trafficking/secretion, both of which could suppress surfactant secretion and impair the pulmonary surfactant system downstream of successful glycogen accumulation. The extent to which any of these processes control surfactant production and secretion by mature ATII in hypoxia remains to be defined.
That exposure to the prolyl-hydroxylase inhibitor DMOG elicited responses similar to those induced by hypoxia suggests HIF involvement. HIFs are expressed ubiquitously in mammalian tissues, and multiple HIF isoforms drive expression of different, although overlapping, sets of target genes. HIF control of many glycolytic enzymes has been attributed to the HIF1 isoform, whereas targets thought to be HIF2-specific include many involved in fatty acid storage, glycogen production, and inhibition of reactive O2 species generation. Mutual targets include genes involved in mitochondrial carbon oxidation (e.g., PDK1) and cytoskeleton structure. HIF1α is the most widely expressed of the tightly regulated α-subunits, whereas HIF2α expression varies significantly among cell types; in the mature lung, HIF1α is expressed ubiquitously in tissues exposed to hypoxia, whereas HIF2α expression is restricted specifically to the ATII cells and vascular endothelium (39). Work in the lung has shown that HIF1α can drive hypoxia-induced apoptosis in ATII cells (11, 18), whereas other studies have shown that HIF2α plays a critical role in regulating production of pulmonary surfactant (1), as well as roles in alveolar development (16) and promoting antiapoptosis pathways (38). Considerable cross-regulation between isoforms has been suggested; for example, HIF2α expression is abrogated in lung-targeted HIF1α knockouts, and HIF2α activation may be dependent on initial HIF1α signaling (15, 32).
In addition to HIFs as central components of the ATII cell response to hypoxia, our previous studies have clearly shown that hemoglobin is expressed by ATII cells and dramatically upregulated by HIF and globin-associated factors during hypoxia (7, 24). Also, globins and their regulatory factors appear to be involved in a large number of coordinated changes that occur in these cells in response to varying O2 concentrations (7). Hopefully, future studies will fully elucidate the potential roles of hemoglobin in maintaining O2 homeostasis in ATII cells, including protection against oxidative (or nitrosative) stress and possible involvement in the coordinated adaptation to hypoxia.
In summary, these findings support and extend previous observations that ATII cells resist hypoxic damage through metabolic adaptation. This work represents the first study to extensively assess ATII oxidative and glycolytic metabolic function in response to O2 limitation, and the first effort to match sensitive, functional-level measurements of metabolism with pathway changes at the transcriptional and proteomic levels. There is ever-growing interest in the role of O2 limitation in lung development and disease, and obtaining a thorough understanding of the metabolic reprogramming that accompanies alveolar hypoxia is a critical step toward explaining and treating their dysfunctional behavior.
GRANTS
This work was funded by National Heart, Lung, and Blood Institute Grant HL-085738 (J. E. Baatz).
DISCLOSURES
No conflicts of interest, financial or otherwise are declared by the authors.
AUTHOR CONTRIBUTIONS
Author contributions: R.G.L., D.A.N., and J.E.B. performed experiments; R.G.L., D.A.N., and J.E.B. analyzed data; R.G.L., D.A.N., and J.E.B. interpreted results of experiments; R.G.L., D.A.N., and J.E.B. prepared figures; R.G.L. and J.E.B. drafted manuscript; R.G.L., D.A.N., D.D.S., and J.E.B. edited and revised manuscript; R.G.L., D.A.N., D.D.S., and J.E.B. approved final version of manuscript; D.D.S. and J.E.B. conception and design of research.
Supplementary Material
REFERENCES
- 1.Compernolle V, Brusselmans K, Acker T, Hoet P, Tjwa M, Beck H, Plaisance S, Dor Y, Keshet E, Lupu F, Nemery B, Dewerchin M, Van Veldhoven P, Plate K, Moons L, Collen D, Carmeliet P. Loss of HIF-2alpha and inhibition of VEGF impair fetal lung maturation, whereas treatment with VEGF prevents fatal respiratory distress in premature mice. Nat Med 8: 702–710, 2002. [DOI] [PubMed] [Google Scholar]
- 2.Dobbs LG. Isolation and culture of alveolar type II cells. Am J Pysiol Lung Cell Mol Physiol 258: L134–L147, 1990. [DOI] [PubMed] [Google Scholar]
- 3.Dranka BP, Hill BG, Darley-Usmar VM. Mitochondrial reserve capacity in endothelial cells: The impact of nitric oxide and reactive oxygen species. Free Rad Biol Med 48: 905–914, 2010. [DOI] [PMC free article] [PubMed] [Google Scholar]
- 4.Fisher AB, Dodia C. Lactate and regulation of lung glycolytic rate. Am J Physiol Endocrinol Metab 246: E426–E429, 1984. [DOI] [PubMed] [Google Scholar]
- 5.Fox RE, Hopkins IB, Cabacungan ET, Tildon JT. The role of glutamine and other alternate substrates as energy sources in the fetal rat lung type II cell. Pediatr Res 40: 135–141, 1996. [DOI] [PubMed] [Google Scholar]
- 6.Gerencser AA, Neilson A, Choi SW, Edman U, Yadava N, Oh RJ, Ferrick DA, Nicholls DG, Brand MD. Quantitative microplate-based respirometry with correction for oxygen diffusion. Anal Chem 81: 6868–6878, 2009. [DOI] [PMC free article] [PubMed] [Google Scholar]
- 7.Grek CL, Newton DA, Spyropoulos DD, Baatz JE. Hypoxia up-regulates expression of hemoglobin in alveolar epithelial cells. Am J Respir Cell Mol Biol 44: 439–447, 2011. [DOI] [PMC free article] [PubMed] [Google Scholar]
- 8.Groenman F, Rutter M, Caniggia I, Tibboel D, Post M. Hypoxia-inducible factors in the first trimester human lung. J Histochem Cytochem 55: 355–363, 2007. [DOI] [PubMed] [Google Scholar]
- 9.Groenman FA, Rutter M, Wang J, Caniggia I, Tibboel D, Post M. Effect of chemical stabilizers of hypoxia-inducible factors on early lung development. Am J Physiol Lung Cell Mol Physiol 293: L557–L567, 2007. [DOI] [PubMed] [Google Scholar]
- 10.Gusarova GA, Trejo HE, Dada LA, Briva A, Welch LC, Hamanaka RB, Mutlu GM, Chandel NS, Prakriya M, Sznajder JI. Hypoxia leads to Na,K-ATPase downregulation via Ca(2+) release-activated Ca(2+) channels and AMPK activation. Mol Cell Biol 31: 3546–3556, 2011. [DOI] [PMC free article] [PubMed] [Google Scholar]
- 11.He XY, Shi XY, Yuan HB, Xu HT, Li YK, Zou Z. Propofol attenuates hypoxia-induced apoptosis in alveolar epithelial type II cells through down-regulating hypoxia-inducible factor-1alpha. Injury 43: 279–283, 2012. [DOI] [PubMed] [Google Scholar]
- 12.Heerlein K, Schulze A, Hotz L, Bartsch P, Mairbaurl H. Hypoxia decreases cellular ATP demand and inhibits mitochondrial respiration of a549 cells. Am J Respir Cell Mol Biol 32: 44–51, 2005. [DOI] [PubMed] [Google Scholar]
- 13.Hoffman AM, Ingenito EP. Alveolar epithelial stem and progenitor cells: emerging evidence for their role in lung regeneration. Curr Med Chem 19: 6003–6008, 2012. [DOI] [PubMed] [Google Scholar]
- 14.Hosford GE, Olson DM. Effects of hyperoxia on VEGF, its receptors, and HIF-2alpha in the newborn rat lung. Am J Pphysiol Lung Cell Mol Physiol 285: L161–L168, 2003. [DOI] [PubMed] [Google Scholar]
- 15.Hu CJ, Wang LY, Chodosh LA, Keith B, Simon MC. Differential roles of hypoxia-inducible factor 1alpha (HIF-1alpha) and HIF-2alpha in hypoxic gene regulation. Mol Cell Biol 23: 9361–9374, 2003. [DOI] [PMC free article] [PubMed] [Google Scholar]
- 16.Huang Y, Kempen MB, Munck AB, Swagemakers S, Driegen S, Mahavadi P, Meijer D, van Ijcken W, van der Spek P, Grosveld F, Gunther A, Tibboel D, Rottier RJ. Hypoxia-inducible factor 2alpha plays a critical role in the formation of alveoli and surfactant. Am J Respir Cell Mol Biol 46: 224–232, 2012. [DOI] [PubMed] [Google Scholar]
- 17.Jezek P, Plecita-Hlavata L, Smolkova K, Rossignol R. Distinctions and similarities of cell bioenergetics and the role of mitochondria in hypoxia, cancer, and embryonic development. Int J Biochem Cell Biol 42: 604–622, 2010. [DOI] [PubMed] [Google Scholar]
- 18.Krick S, Eul BG, Hanze J, Savai R, Grimminger F, Seeger W, Rose F. Role of hypoxia-inducible factor-1alpha in hypoxia-induced apoptosis of primary alveolar epithelial type II cells. Am J Respir Cell Mol Biol 32: 395–403, 2005. [DOI] [PubMed] [Google Scholar]
- 19.Lee YM, Jeong CH, Koo SY, Son MJ, Song HS, Bae SK, Raleigh JA, Chung HY, Yoo MA, Kim KW. Determination of hypoxic region by hypoxia marker in developing mouse embryos in vivo: a possible signal for vessel development. Dev Dyn 220: 175–186, 2001. [DOI] [PubMed] [Google Scholar]
- 20.Mason RJ. Biology of alveolar type II cells. Respirology Suppl 11: S12–S15, 2006. [DOI] [PubMed] [Google Scholar]
- 21.Mason RJ, Williams MC, Widdicombe JH. Fluid and electrolyte transport across monolayers of alveolar type II cells in vitro. Am Rev Respir Dis 127: S24–S28, 1983. [PubMed] [Google Scholar]
- 22.Matalon S. Mechanisms and regulation of ion transport in adult mammalian alveolar type II pneumocytes. Am J Physiol Cell Physiol 261: C727–C738, 1991. [DOI] [PubMed] [Google Scholar]
- 23.Mungai PT, Waypa GB, Jairaman A, Prakriya M, Dokic D, Ball MK, Schumacker PT. Hypoxia triggers AMPK activation through reactive oxygen species-mediated activation of calcium release-activated calcium channels. Mol Cell Biol 31: 3531–3545, 2011. [DOI] [PMC free article] [PubMed] [Google Scholar]
- 24.Newton DA, Rao KM, Dluhy RA, Baatz JE. Hemoglobin is expressed by alveolar epithelial cells. J Biol Chem 281: 5668–5676, 2006. [DOI] [PubMed] [Google Scholar]
- 25.Ouiddir A, Planes C, Fernandes I, VanHesse A, Clerici C. Hypoxia upregulates activity and expression of the glucose transporter GLUT1 in alveolar epithelial cells. Am J Respir Cell Mol Biol 21: 710–718, 1999. [DOI] [PubMed] [Google Scholar]
- 26.Pescador N, Villar D, Cifuentes D, Garcia-Rocha M, Ortiz-Barahona A, Vazquez S, Ordonez A, Cuevas Y, Saez-Morales D, Garcia-Bermejo ML, Landazuri MO, Guinovart J, del Peso L. Hypoxia promotes glycogen accumulation through hypoxia inducible factor (HIF)-mediated induction of glycogen synthase 1. PLoS One 5: e9644, 2010. [DOI] [PMC free article] [PubMed] [Google Scholar]
- 27.Planes C, Friedlander G, Loiseau A, Amiel C, Clerici C. Inhibition of Na-K-ATPase activity after prolonged hypoxia in an alveolar epithelial cell line. Am J Physiol Lung Cell Mol Physiol 271: L70–L78, 1996. [DOI] [PubMed] [Google Scholar]
- 28.Rajatapiti P, van der Horst IW, de Rooij JD, Tran MG, Maxwell PH, Tibboel D, Rottier R, de Krijger RR. Expression of hypoxia-inducible factors in normal human lung development. Pediatr Dev Pathol 11: 193–199, 2008. [DOI] [PubMed] [Google Scholar]
- 29.Rhoades RA, Shaw ME, Eskew ML, Wali S. Lactate metabolism in perfused rat lung. Am J Physiol Endocrinol Metab Gastrointest Physiol 235: E619–E623, 1978. [DOI] [PubMed] [Google Scholar]
- 30.Rice WR, Conkright JJ, Na CL, Ikegami M, Shannon JM, Weaver TE. Maintenance of the mouse type II cell phenotype in vitro. Am J Physiol Lung Cell Mol Physiol 283: L256–L264, 2002. [DOI] [PubMed] [Google Scholar]
- 31.Ridsdale R, Post M. Surfactant lipid synthesis and lamellar body formation in glycogen-laden type II cells. Am J Physiol Lung Cell Mol Physiol 287: L743–L751, 2004. [DOI] [PubMed] [Google Scholar]
- 32.Saini Y, Harkema JR, LaPres JJ. HIF1alpha is essential for normal intrauterine differentiation of alveolar epithelium and surfactant production in the newborn lung of mice. J Biol Chem 283: 33650–33657, 2008. [DOI] [PMC free article] [PubMed] [Google Scholar]
- 33.Schumacker PT. Lung cell hypoxia: role of mitochondrial reactive oxygen species signaling in triggering responses. Proc Am Thoracic Society 8: 477–484, 2011. [DOI] [PMC free article] [PubMed] [Google Scholar]
- 34.Shimoda LA, Semenza GL. HIF and the lung: role of hypoxia-inducible factors in pulmonary development and disease. Am J Respir Crit Care Med 183: 152–156, 2011. [DOI] [PMC free article] [PubMed] [Google Scholar]
- 35.Sridharan V, Guichard J, Li CY, Muise-Helmericks R, Beeson CC, Wright GL. O2-sensing signal cascade: clamping of O2 respiration, reduced ATP utilization, and inducible fumarate respiration. Am J Physiol Cell Physiol 295: C29–C37, 2008. [DOI] [PMC free article] [PubMed] [Google Scholar]
- 36.Vadivel A, Alphonse RS, Etches N, van Haaften T, Collins JJP, O'Reilly M, Eaton F, Thébaud B. Hypoxia inducible factors promotes alveolar development and regeneration. Am J Respir Cell Mol Biol 50: 96–105, 2014. [DOI] [PubMed] [Google Scholar]
- 37.Vivona ML, Matthay M, Chabaud MB, Friedlander G, Clerici C. Hypoxia reduces alveolar epithelial sodium and fluid transport in rats: reversal by beta-adrenergic agonist treatment. Am J Respir Cell Mol Biol 25: 554–561, 2001. [DOI] [PubMed] [Google Scholar]
- 38.Wagner KF, Hellberg AK, Balenger S, Depping R, Dodd OJ, Johns RA, Li D. Hypoxia-induced mitogenic factor has antiapoptotic action and is upregulated in the developing lung: coexpression with hypoxia-inducible factor-2alpha. Am J Respir Cell Mol Biol 31: 276–282, 2004. [DOI] [PubMed] [Google Scholar]
- 39.Wiesener MS, Jurgensen JS, Rosenberger C, Scholze CK, Horstrup JH, Warnecke C, Mandriota S, Bechmann I, Frei UA, Pugh CW, Ratcliffe PJ, Bachmann S, Maxwell PH, Eckardt KU. Widespread hypoxia-inducible expression of HIF-2alpha in distinct cell populations of different organs. FASEB J 17: 271–273, 2003. [DOI] [PubMed] [Google Scholar]
Associated Data
This section collects any data citations, data availability statements, or supplementary materials included in this article.