

Abstract
Adipose tissue is a highly insulin-responsive organ that contributes to metabolic regulation. Insulin resistance in the adipose tissue affects systemic lipid and glucose homeostasis. Phosphoinositide 3-kinase (PI3K) mediates downstream insulin signaling in adipose tissue, but its physiological role in vivo remains unclear. Using Cre recombinase driven by the aP2 promoter, we created mice that lack the class 1A PI3K catalytic subunit p110α or p110β specifically in the white and brown adipose tissue. The loss of p110α, not p110β, resulted in increased adiposity, glucose intolerance and liver steatosis. Mice lacking p110α in adipose tissue exhibited a decrease in energy expenditure but no change in food intake or activity compared with control animals. This low energy expenditure is a consequence of low cellular respiration in the brown adipocytes caused by a decrease in expression of key mitochondrial genes including uncoupling protein-1. These results illustrate a critical role of p110α in the regulation of energy expenditure through modulation of cellular respiration in the brown adipose tissue and suggest that compromised insulin signaling in adipose tissue might be involved in the onset of obesity.
Keywords: phosphoinositide 3-kinase, obesity, insulin, energy expenditure, brown adipose tissue
obesity is a pandemic that already affects over 10% of the world's population (3). Obesity is tightly linked to the onset of type 2 diabetes and metabolic syndrome and contributes to increased mortality rates (1, 44). Despite its high prevalence, the underlying causes of obesity are not fully understood. The leptin receptor mutant db/db mouse is a well-studied model of severe obesity, diabetes, and dyslipidemia (27); however, its relevance to the human disorder is limited, since the vast majority of obese patients do not have leptin receptor mutations (21). Insulin receptor (IR) knockout mice have provided unique insight into how insulin resistance in the liver, muscle or adipose tissue affects adiposity and glucose homeostasis. Muscle-specific IR knockout (MIRKO) mice exhibited normal glucose tolerance associated with increased adiposity, whereas mice with liver-specific ablation of the IR (LIRKO) were glucose intolerant and had normal fat mass (10, 39). The fat-specific IR knockout mouse (FIRKO) exhibited reduced adiposity and normal or improved glucose tolerance (7).
Adipose tissue is a highly insulin-responsive organ that contributes to the regulation of whole body glucose and lipid homeostasis. White adipose tissue (WAT) stores triglycerides, which are broken down to produce energy during times of caloric need. WAT also acts as an endocrine organ by secreting adipokines such as leptin, which acts in energy sensing and pubertal development (36). Brown adipose tissue (BAT) is responsible for the production of heat by nonshivering thermogenesis and is typically activated in response to cold exposure. Once thought to be present only in infants, recent studies have shown that BAT is also present and highly active in adults (17). Stimulation of the sympathetic nervous system activates β3-adrenergic receptors in BAT to increase cAMP production and upregulate expression of uncoupling protein-1 (UCP1) (11). UCP1 is crucial for BAT thermogenesis and serves to uncouple heat generation from the respiratory chain, allowing for efficient substrate oxidation and low ATP synthesis (41). UCP1 is required for nonshivering thermogenesis, as evidenced by the inability of the UCP1 knockout mouse to adapt to cold temperatures (20). The UCP1 knockout mouse became obese when housed at thermoneutrality (the temperature at which shivering is no longer required to produce heat), indicating that UCP1 regulates adiposity (22).
Phosphoinositide 3-kinase (PI3K) is activated in response to insulin treatment and plays a critical role in mediating metabolic responses to the hormone (52). Stimulation of adipose tissue with insulin increases glucose uptake and suppresses lipolysis; treatment of rat adipocytes with a nonselective PI3K inhibitor showed that PI3K activity is necessary for both of these metabolic responses (42). Adipocytes from type 2 diabetic patients showed reduced PI3K activation and diminished phosphorylation of the downstream target Akt in response to insulin treatment (46, 47). Class 1A PI3Ks are comprised of a catalytic subunit (p110α, p110β, or p110δ) bound to one of several regulatory subunits (collectively referred to as p85). A study using isoform-selective PI3K inhibitors concluded that p110α is the primary insulin-responsive PI3K isoform in 3T3-L1 adipocytes (29). To further underscore the importance of p110α, knockin mice heterozygous for a kinase-dead p110α mutant developed severe metabolic defects including hyperinsulinemia, glucose intolerance, hyperphagia, leptin resistance, increased adiposity, and blunted insulin signaling in the muscle, liver, and adipose tissue (23). While the latter study highlighted the importance of p110α in a global mutant mouse model, how p110α in the adipose tissue contributes to systemic glucose and lipid homeostasis has not been studied in a physiological model. Here, we show that adipose tissue-specific loss of p110α results in obesity and glucose intolerance. Furthermore, respiration is compromised in the p110α-null BAT due to decreased expression of Ucp1 and other key genes important for mitochondrial energy metabolism.
RESEARCH DESIGN AND METHODS
Antibodies.
The following antibodies were used: p110α, p110β, Akt phospho-Thr308, cytochrome c oxidase (COX) IV, and heat shock protein (HSP)90 from Cell Signaling Technology; p85, Akt, insulin receptor substrate (IRS)-1, IRS-2, and translocase of outer mitochondrial membrane 40 (TOM40) from Santa Cruz Biotechnology; Akt phospho-Ser473 from Epitomics; UCP1 from Abcam; and β-actin and glyceraldehyde-3-phosphate dehydrogenase (GAPDH) from Sigma-Aldrich.
Animals.
p110αflox/flox and p110βflox/flox mice (34) were crossed with aP2-Cre transgenic mice [obtained from Bruce Spiegelman (6)] to produce experimental aP2-Cre/p110αflox/flox and aP2-Cre/p110βflox/flox animals (called α−/− and β−/−, respectively) and control p110αflox/flox or p110βflox/flox mice (called α+/+ and β+/+, respectively). These mouse strains were maintained in a mixed genetic background and the control animals for each study were littermates. Age-matched mice of both sexes were studied between 4 wk and 4 mo of age. The adipose tissue depots studied herein were perigonadal WAT and interscapular BAT. The mice were maintained under temperature- and humidity-controlled conditions with a 12:12-h light-dark cycle and had free access to standard rodent chow and water. Body weights were measured weekly from 4 wk to 4 mo of age. At 4 mo of age, the mice were anesthetized with an intraperitoneal injection of ketamine-xylazine, and dual-energy X-ray absorptiometry (DEXA) scanning was performed with the Lunar PIXImus2 DEXA scanner (Faxitron X-Ray, Wheeling, IL) to determine body composition. All animal studies performed in this investigation were approved by the Stony Brook University Animal Care and Use Committee.
Histology.
WAT and BAT were collected from 4-mo-old male mice after whole body perfusion with 4% paraformaldehyde (PFA) in phosphate-buffered saline administered through the inferior vena cava. The adipose tissues were collected and fixed overnight in 4% PFA. The adipose tissues and formalin-fixed liver were dehydrated and embedded in paraffin using the Leica ASP300S Tissue Processor (Leica Biosystems, Wetzlar, Germany). Sections (5 μm) were stained with hematoxylin and eosin. Frozen liver sections (8 μm) from 4-mo-old male mice were stained with Oil red O and counterstained with hematoxylin to visualize lipids. Sections were visualized with an Olympus BX43 microscope and Cell Sens Digital Imaging Software (Olympus).
Triglyceride content.
Male mice (4 mo old) were fasted for 6 h, and the livers were removed and frozen in liquid nitrogen. Triglycerides from liver and muscle tissues were extracted and quantified using the Serum Triglyceride Determination Kit (Sigma-Aldrich) as previously described (14).
Glucose tolerance test and serum chemistry.
For glucose tolerance tests, 4-mo-old male mice were fasted for 6 h. An intraperitoneal injection of glucose (2 g/kg body wt ip) was administered, and tail blood glucose levels were measured at various times using a OneTouch UltraMini glucose monitor (LifeScan, Milpitas, CA). Blood for serum chemistry was collected by a retroorbital bleed under isoflurane anesthesia. Serum insulin was measured with an ELISA kit (Mercodia), as were serum leptin, adiponectin, fibroblast growth factor (FGF)-21 and resistin (R&D Systems). Serum triglycerides, free fatty acids, and cholesterol were measured by Ani Lytics (Gaithersburg, MD).
Preparation of isolated adipocytes.
White adipocytes were isolated according to Viswanadha and Londos (55). WAT was collected from mice anesthetized with ketamine-xylazine. White adipocytes were isolated with 3 mg/ml type I collagenase (Worthington Biomedical) in Krebs-Ringer bicarbonate solution-HEPES buffer, pH 7.4 (supplemented with 3% fatty acid-free bovine serum albumin). Adipocytes were filtered through 297-μm polypropylene mesh, washed three times in Krebs-Ringer bicarbonate-HEPES buffer, and collected for experiments. Brown adipocytes were isolated as previously described (13). Briefly, BAT was collected from mice under ketamine-xylazine anesthesia. The BAT was subjected to an initial digestion with 1 mg/ml type I collagenase in Krebs-Ringer bicarbonate-HEPES buffer, pH 7.4 (supplemented with 4% fatty acid-free bovine serum albumin). The tissue was then minced, incubated again with collagenase, washed, and filtered through 297-μm mesh before the third and final incubation with collagenase. The isolated brown adipocytes were rinsed three times with Krebs-Ringer bicarbonate-HEPES buffer and collected for experiments.
PI3K activity assay.
Pooled adipocytes isolated from WAT of 4-mo-old male and female mice were treated with 100 nM bovine insulin (Sigma-Aldrich) for various times and then homogenized in general lysis buffer [10 mM sodium pyrophosphate, 50 mM HEPES, pH 7.5, 1% Triton X-100, 50 mM NaCl, 50 mM NaF, 5 mM EDTA, 1 mM sodium orthovanadate, 1:1,000 protease inhibitor cocktail (Sigma-Aldrich), and 1 mM phenylmethanesulfonyl fluoride]. After centrifugation, aliquots of supernatant containing equal amounts of protein (measured by the Bio-Rad protein assay) were incubated overnight at 4°C with IRS-1 or IRS-2 antibody. IRS-associated PI3K was pulled down with protein A-agarose, and PI3K activity was assayed in the immunoprecipitates as previously described (4). For analysis of PI3K activity in BAT, mice fasted overnight were anesthetized with ketamine-xylazine, and the inferior vena cava was exposed by laparotomy through a midline incision. Human insulin (Novolin R, Novo Nordisk) at 1 U/kg body wt or an equal volume of saline was injected into the inferior vena cava. BAT was collected 15 min later and stored in liquid nitrogen. The tissue was homogenized in general lysis buffer, and PI3K activity was assayed as described above.
Western blotting.
Tissues were collected and immediately frozen in liquid nitrogen. Tissue samples were homogenized in general lysis buffer, and adipose tissue homogenates were further sonicated for 10 min at 4°C. After centrifugation, aliquots of supernatant containing equal amounts of protein were subjected to SDS-PAGE and immunoblotting as previously described (5). Signals were visualized using horseradish peroxidase-linked secondary antibodies and chemiluminescence reagents. Densitometry was performed using Image J (NIH) after imaging with film or using AlphaView (v. 3.4.0.0) software after imaging with the FluorChem E system (ProteinSimple, Santa Clara, CA).
Indirect calorimetry.
Metabolic gas exchange, food intake, and ambulatory activity were measured using the Comprehensive Lab Animal Monitoring System (Columbus Instruments, Columbus, OH). Four-month-old male mice were individually housed for 96 h in calorimetry cages equipped with activity monitors and with free access to food and water. Data from the final 24 h were analyzed. Energy expenditure (EE) was calculated without normalization to body weight, as per Cannon and Nedergaard, using the following equation:
where V̇co2 is the volume of CO2 produced and V̇o2 is the volume of O2 consumed (12).
Cell respiration.
Brown adipocytes were isolated as described above, except that the cells were isolated in Hank's balanced salt solution. Brown adipocytes from four mice were pooled for each experiment and resuspended in Gey's balanced salt solution (Sigma-Aldrich). The cell suspension was bubbled with 5% CO2 in air at 37°C for 15 min. The adipocytes were added to a sealed chamber with a Clark-type electrode in a final volume of 2 ml. Oxygen tension was monitored with a Yellow Springs oxymeter and recorded as a function of time with a Zip-Konnen chart recorder, as previously described (18). After baseline measurements were obtained, additional measurements were made after addition of 10 μM CL 316,243 (Sigma-Aldrich). Respiration rate was normalized to the protein expression of COX IV in the pooled adipocytes, as determined by densitometry of Western blots.
Analysis of COX activity.
COX activity was measured in the BAT from ad libitum-fed α−/− and α+/+ mice aged 2–4 mo with the Complex IV Rodent Enzyme Activity Assay kit (purchased from Mitosciences-Abcam). COX activity was assayed and quantified according the manufacturer's instructions.
Mitochondrial DNA quantification.
Total DNA was isolated from the BAT of male mice at 16–22 wk of age. Two nanograms of total DNA was used to assess mtDNA (mt-Co2; 5′-CCGTGGGGAATGTATGAGCA, 3′-CTTCGCAGGAAGGGGATGTT) normalized to nuclear DNA (Actb; 5′-ATGCCCTGAGGCTCTTTTCC, 3′-TGCTAGGAGCCAGAGCAGTA) by quantitative PCR.
Transmission electron microscopy.
Tissues were isolated after whole body perfusion (as described above) with 2% PFA and 2% glutaraldehyde in PBS. Postfixation with OsO4 and embedding were performed by the Central Microscopy Imaging Center (Stony Brook University, Stony Brook, NY). Images were captured with a FEI BioTwinG2 transmission electron microscope equipped with an AMT digital camera.
Gene expression analysis.
RNA was isolated from BAT using the RNeasy Lipid Tissue kit (Qiagen), and cDNA was synthesized with the iScript cDNA synthesis kit (Bio-Rad). Gene expression of FATP1 (Slc27a1; 5′-GATGTGCTCTATGACTGCCTG, 3′-GTGTCGCTGCTCCACGTCG); FATP4 (Slc27a4; 5′-AGCAACTGTGACCTGGAGAG, 3′-CTTCCGAGCATCCAGATAGA); mt-NADH dehydrogenase subunit 1 (mt-Nd1; 5′-AATCGCCATAGCCTTCCTAACAT, 3′-GGCGTCTGCAAATGGTTGTAA); mt-COX I (mt-COX1; 5′-CCCAATCTCTACCAGCATC, 3′-GGCTCATAGTATAGCTGGAG); cytochrome B (mt-Cytb; 5′-TATTCCTTCATGTCGGACGA, 3′-AAATGCTGTGGCTATGACTG); UCP1 (Ucp1; 5′-TCCTAGGGACCATCACCACC, 3′-GCAGGCAGACCGCTGTACA); PGC-1α (Ppargc1α; 5′-CATTTGATGCACTGACAGATGGA, 3′-CCGTCAGGCATGGAGGAA); and β-actin (Actb; 5′-TTCTTTGCAGCTCCTTCGTT, 3′-ATGGAGGGGAATACAGCCC) were analyzed with the SYBR Green PCR Kit from Qiagen. PPARγ (Pparg) gene expression was investigated using a Taqman Gene Expression Assay (Mm01184323_m1, Life Technologies) using β-actin (Actb) as a control. Pooled BAT from several male mice was used to examine changes in gene expression using the Mouse Mitochondrial Energy Metabolism RT2 Profiler PCR array (Qiagen). Relative gene expression was obtained using the ΔCT calculation.
Statistics.
Results are reported as means ± SE. Significance was determined by Student's t-test, one-way ANOVA, or Mann-Whitney rank sum (SPSS; IBM, Chicago, IL). Statistical significance was accepted when P < 0.05.
RESULTS
Loss of adipose-specific p110α causes increased adiposity.
We created a mouse strain with adipose-specific deletion of p110α using the Cre-lox system. Western blotting confirmed reduced p110α protein expression in adipocytes isolated from WAT and BAT of α−/− mice compared with α+/+ animals (Fig. 1A). By contrast, there was no difference in levels of the p110β catalytic and p85 regulatory PI3K subunits in WAT and BAT from mice of these genotypes (Fig. 1A). We also created mice with adipose-specific deletion of p110β. Western blotting confirmed the successful ablation of p110β in white and brown adipocytes of β−/− mice (Fig. 1B). No decrease in PI3K subunits was seen in the liver or skeletal muscle of α−/− or β−/− mice (Fig. 1). It was recently shown that aP2 expression is extremely low in adipose tissue macrophages compared with the adipose tissue itself; therefore, it seems unlikely that PI3K deletion in macrophages contributes to the phenotypes associated with aP2-Cre knockouts (31).
Fig. 1.
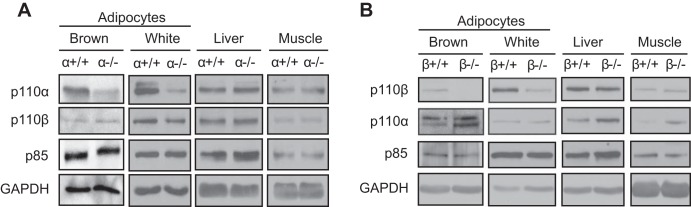
Adipose tissue-specific loss of p110α and p110β proteins. Adipocytes were isolated from gonadal white or interscapular brown fat pads of adult p110α (A) and p110β (B) knockout mice and their controls. Isolated adipocytes from several animals of each genotype were pooled and subjected to Western blotting using the indicated antibodies. Expression of PI3K subunits in the liver and gastrocnemius muscle of representative knockout and control mice is also shown. GAPDH served as a loading control.
At birth, the α−/− mice appeared normal and were indistinguishable from their control littermates. However, starting at 6 wk of age, the male α−/− mice developed a progressive increase in body mass compared with α+/+ controls (Fig. 2A). By 16 wk of age, male α−/− mice were 32% heavier than α+/+ mice when normalized to tibia length (Fig. 2B). We assessed the body composition of 4-mo-old male animals by DEXA scanning. The α−/− mice exhibited a 35% increase in fat mass compared with the α+/+ controls as well as a reduction in lean mass (Fig. 2C). Gross examination of the interscapular brown fat and epididymal white fat pads confirmed an increase in mass in both of these depots (Fig. 2D). The weight of the dissected epididymal adipose tissue from 4-mo-old male α−/− mice was significantly increased over that of α+/+ mice when normalized to body weight (α+/+, 13.1 ± 1.5 mg/g, n = 7; α−/−, 30.3 ± 3.2 mg/g, n = 7, P = 0.0003). Histological examination of the fat pads revealed enlarged white and brown adipocytes in the α−/− tissues (Fig. 2E). In contrast to the p110α knockout mice, 4-mo-old β−/− mice showed no difference in body weight/tibia length, fat mass, or lean mass compared with the β+/+ controls (Fig. 2, B and C).
Fig. 2.

Increased adiposity, liver steatosis, and glucose intolerance in male α−/− mice. (aP2-Cre/p110αflox/flox and aP2-Cre/p110βflox/flox animals are called α−/− and β−/−, respectively; control p110αflox/flox and p110βflox/flox mice are called α+/+ and β+/+, respectively.) A: weight gain of α−/− and α+/+ mice (n = 4 per group). B: body weights normalized to tibia length of 4-mo-old mice (α, n = 8 per group; β+/+, n = 8; β−/−, n = 7). C: fat mass and lean mass normalized to total body mass as measured by DEXA scan of 4-mo-old mice (α, n = 11 per group; β, n = 6 per group). D: interscapular brown (top) and epididymal white (bottom) fat pads of 4-mo-old mice. E: representative H&E-stained sections of epididymal white and interscapular brown fat pads from 4-mo-old mice. Scale bars, 100 μm. F: liver weight normalized to body weight of 4-mo-old mice (n = 5 per group). G: liver triglycerides normalized to tissue weight (n = 3). H: liver sections from α+/+ and α−/− mice stained with H&E (top) or hematoxylin and Oil red O (bottom). I and J: glucose tolerance tests on 4-mo-old α (n = 5 per group) and β (n = 6 per group) mice. *Statistical significance at P < 0.05.
In addition to increased adiposity, 4-mo-old α−/− mice exhibited an increase in liver weight to body weight ratio compared with controls (Fig. 2F). This phenotype was not present in β−/− mice (Fig. 2F). To determine whether the increased liver mass in α−/− mice was due to fat deposition, we measured liver triglyceride levels and found a significant increase in the lipid content of α−/− compared with α+/+ tissue (Fig. 2G). Increased accumulation of lipid in α−/− liver was also seen in sections stained with Oil red O (Fig. 2H). We also measured triglyceride levels in the gastrocnemius muscle of ad libitum-fed α−/− mice and controls but did not observe any differences (α+/+, 0.23 ± 0.04 μg triglycerides/μg protein; α−/−, 0.28 ± 0.04 μg triglycerides/μg protein; n = 6 per group, P < 0.05). It is possible that increased liver lipid deposition in the α−/− mice was a result of decreased lipid transport into the adipocytes. We measured the gene expression of the adipose tissue fatty acid transporters FATP1 and FATP4 in the WAT of ad libitum-fed α−/− mice and controls but did not observe any changes in expression of either transporter (FATP1: α+/+, 2.2 ± 0.3, n = 6; α−/−, 2.1 ± 0.4, n = 6; FATP4: α+/+, 3.4 ± 0.4, n = 6; α−/−, 3.9 ± 0.6, n = 6, P < 0.05).
α−/− mice are glucose intolerant. Increased adiposity in humans is often associated with insulin resistance and glucose intolerance. We performed glucose tolerance tests on 4-mo-old male α−/− and α+/+ mice and found that the α−/− mice were relatively glucose intolerant despite having high fasted insulin levels (Fig. 2I and Table 1). By contrast, glucose tolerance and fasted insulin levels were essentially the same in β−/− and β+/+ mice (Fig. 2J and Table 2).
Table 1.
Blood chemistry of α+/+ and α−/− mice
| α+/+ | α−/− | |
|---|---|---|
| Resistin, fed (ng/ml) | 18.2 ± 2.5 | 10.7 ± 1.7* |
| FGF-21, fed (pg/ml) | 110.2 ± 31.3 | 117.3 ± 19.9 |
| Leptin, fasted (ng/ml) | 1.24 ± 0.35 | 10.17 ± 2.5* |
| Adiponectin, fasted (ng/ml) | 3311 ± 857 | 3413 ± 1043 |
| Glucose, fasted for 6 h (mg/dl) | 145.6 ± 7.9 | 174 ± 10.4 |
| Insulin, fasted (ng/ml) | 0.21 ± 0.19 | 2.97 ± 0.86* |
| Triglycerides, fasted (mg/dl) | 52.4 ± 8.8 | 92 ± 9.8* |
| Cholesterol, fasted (mg/dl) | 79.6 ± 2.0 | 119.8 ± 7.5* |
| Free fatty acids, fasted (μmol/l) | 507.8 ± 48.9 | 731 ± 52.2* |
Data are means ± SE. aP2-Cre/p110αflox/flox and aP2-Cre/p110βflox/flox mice are referred to as α−/− and β−/−, respectively; control p110αflox/flox or p110βflox/flox mice are referred to as α+/+ and β+/+, respectively. Male mice 4 mo of age (n = 5–9) were fasted for 16 h unless otherwise noted.
Statistical significance at P < 0.05.
Table 2.
Blood chemistry of β+/+ and β−/− mice
| β+/+ | β−/− | |
|---|---|---|
| Leptin (ng/ml) | 1.04 ± 0.32 | 1.18 ± 0.26 |
| Adiponectin (ng/ml) | 5583 ± 588 | 5931 ± 1018 |
| Glucose, fasted for 6 h (mg/dl) | 177.6 ± 24.3 | 157.5 ± 13.8 |
| Insulin (ng/ml) | 0.06 ± 0.04 | 0.04 ± 0.02 |
Data are means ± SE. Male mice 4 mo of age (n = 4–7) were fasted for 16 h unless otherwise noted. Statistical significance at P < 0.05.
Similar to other mouse models of obesity (25), fasted α−/− mice had increased serum levels of triglycerides, cholesterol, and free fatty acids compared with controls (Table 1). In addition, leptin was increased in the α−/− mice, reflective of their higher fat mass (Table 1). Serum resistin levels were lower in α−/− mice than in the controls, potentially reflecting a compensatory response of the adipose tissue to hyperglycemia (Table 1). No change was observed in serum adiponectin or FGF-21 (Table 1). The serum adipokine levels measured in β+/+ and β−/− mice were statistically indistinguishable (Table 2).
Insulin activation of PI3K in α−/− adipose tissue.
Studies utilizing 3T3-L1 cells treated with PI3K inhibitors have suggested that p110α is the primary insulin-responsive PI3K in adipocytes (29). To determine the effect of p110α ablation on insulin signaling in bonafide adipocytes, we isolated white adipocytes from perigonadal fat pads of α+/+ and α−/− mice, stimulated them with insulin in vitro, and measured the activation of PI3K and Akt. The absence of p110α resulted in a dramatic decrease in insulin-stimulated PI3K activity associated with IRS-1 (Fig. 3A). Insulin-induced phosphorylation of Akt Thr308 (a site controlled by PI3K via PDK1) was also attenuated in the α−/− adipocytes, especially after 30 min of insulin treatment (Fig. 3B). Phosphorylation of Akt Ser473 (an mTORC2 site) was decreased to a lesser extent in cells lacking p110α (Fig. 3B). These results confirm that p110α plays an important role in insulin-stimulated PI3K/Akt signaling in WAT.
Fig. 3.

Reduced insulin activation of PI3K/Akt signaling in adipose tissue of α−/− mice. A and B: white adipocytes isolated from perigonadal fat pads of 11 α−/− or 5 α+/+ mice were pooled and treated for the indicated times with 100 nM insulin. Cells were then used for (A) measurement of PI3K activity in IRS-1 immunoprecipitates and (B) Western blot analysis and densitometry of the bands normalized against total Akt to determine the activation of Akt. C and D: mice were injected with saline or 1 U/kg insulin through the inferior vena cava. BAT was collected 15 min later and used to measure (C) PI3K activity in IRS-1 immunoprecipitates and (D and E) Akt phosphorylation examined in BAT, liver, and muscle tissues by Western blotting.
In a second experiment, PI3K/Akt activation was evaluated in BAT that was harvested from mice injected with saline or insulin. Insulin strongly increased IRS-1-associated PI3K activity in BAT of α+/+ mice, but this response was blunted in p110α-null tissue (Fig. 3C). We also saw a marked suppression of Akt Thr308 phosphorylation in BAT of α−/− mice following insulin injection, whereas phosphorylation of Akt Ser473 was not affected (Fig. 3D). Liver and muscle harvested from the same animals showed that Akt phosphorylation was also decreased in these α−/− tissues following insulin stimulation (Fig. 3E).
α−/− mice have decreased energy expenditure.
Obesity is a result of increased caloric consumption or decreased energy expenditure. α−/− mice consumed the same amount of food as α+/+ controls over a 24-h period (Fig. 4A). α−/− mice also exhibited the same ambulatory activity as their lean controls (Fig. 4B). These results suggested that there must be a difference in the ability of α−/− mice to utilize energy. To test this possibility, we measured energy expenditure using indirect calorimetry. α−/− mice exhibited decreased oxygen consumption (Fig. 4C) and reduced energy expenditure (Fig. 4D) compared with their α+/+ controls. In other words, the α−/− mice have a positive energy balance that contributes to their increase in adiposity. A decrease in oxygen consumption is reflected by an increase in the respiratory exchange ratio (RER), which is calculated as the ratio of carbon dioxide produced to the amount of oxygen consumed and indicates which fuel is being metabolized to produce energy (19). The RER of α−/− mice was significantly higher than that of α+/+ animals during parts of the night and day (Fig. 4E), signifying a decrease in usage of fat as an energy source that might further contribute to the obese phenotype.
Fig. 4.

Decreased energy expenditure in α−/− mice. Whole body metabolic measurements of 4-mo-old male α+/+ (n = 12) and α−/− (n = 10) mice were collected over a 24-h period using the Comprehensive Lab Animal Monitoring System. A: total food intake. B: ambulatory activity. C: volume of oxygen consumed (V̇o2) normalized to body weight was significantly decreased in the α−/− mice compared with controls throughout the 24-h period. D: energy expenditure calculated from the V̇o2 before normalization to body weight. E: respiratory exchange ratio (RER) measured as the ratio of the volume of CO2 produced and the volume of O2 consumed was significantly higher in the α−/− mice during the day. *Statistical significance determined by Student's t-test (food intake, activity, and energy expenditure) P < 0.05, or by one-way ANOVA (V̇o2 and RER analysis) P < 0.05.
Reduced respiration in BAT of α−/− mice.
BAT is a major regulator of energy expenditure and can greatly affect adiposity. We therefore tested whether BAT metabolism is dysregulated in α−/− mice. Brown adipocytes were isolated from adult α−/− mice and age-matched controls, and cell respiration was measured before and after addition of the β3-adrenergic agonist CL 316,243. α−/− brown adipocytes had a significantly lower basal respiration rate than α+/+ cells and a significantly lower respiratory response after the administration of the β3-adrenergic agonist (Fig. 5A). However, the fold change of respiration in response to CL 316,243 was unchanged between the α−/− and α+/+ adipocytes (α+/+, 1.97 ± 0.49; α−/−, 1.88 ± 0.21), suggesting that the β3-adrenergic response is intact but overall respiration is impaired. We normalized the respiration rate to protein expression of COX IV (Fig. 5A, right). Further examination of the α−/− BAT revealed that COX activity was decreased compared with control BAT (Fig. 5B). Gene expression analysis of the α−/− BAT confirmed significantly decreased gene expression of COX subunit I (mt-Co1) and cytochrome b (mt-Cytb) but no change in expression of NADH dehydrogenase subunit 1 (mt-Nd1) compared with the BAT of the control mice (Fig. 5C).
Fig. 5.

Impaired respiration in α−/− brown adipocytes. A: V̇o2 rate (OCR) in isolated brown adipocytes before and after stimulation with CL 316,243. Values were normalized to the expression of cytochrome c oxidase (COX) IV protein (right). *Significance was determined by Mann-Whitney rank sum test (P < 0.05). B: COX activity in BAT of α−/− and α+/+ mice (n = 5 per group). C: BAT mitochondrial RNA expression (mt-Nd1, mt-Cytb, mt-Co10 normalized to Actb; n = 6 per group). *Statistical significance determined by Student's t-test P < 0.05.
Reduced respiration in the α−/− BAT could have been caused by a decrease in the amount of mitochondria in the α−/− BAT. However, we did not detect a decrease in protein expression of the mitochondrial markers COX IV or TOM40 in α−/− BAT compared with the controls (Fig. 6A). The relative amount of mitochondrial DNA was unchanged, indicating that mitochondrial number was unaffected in the α−/− BAT (Fig. 6B). Electron microscopy revealed no obvious difference in the morphology of mitochondria from α−/− and α+/+ BAT (Fig. 6C). Taken together, these results indicate that the lower respiration in the α−/− BAT is contributed to by decreased COX expression and activity but not due to lower numbers of mitochondria.
Fig. 6.

Mitochondrial number is unchanged in α−/− brown adipose tissue (BAT). A: Western blot of mitochondrial proteins in BAT from 3 mice of each genotype. Heat shock protein (HSP)90 serves as a loading control. TOM40, translocase of outer mitochondrial membrane 40. B: DNA was isolated from BAT, and quantitative PCR was used to determine the amount of a mitochondrial gene (mt-Co2) relative to a nuclear gene (Actb; n = 4 per group). C: transmission electron microscopy of mitochondria in BAT. Scale bars, 500 nm.
To further explore how ablation of p110α in the BAT changes mitochondrial efficiency, we used a quantitative real-time PCR array to profile key genes involved in mitochondrial energy metabolism. The array identified many genes that were downregulated in the α−/− BAT compared with the control (Fig. 7A and Table 3). The genes with the largest decrease were Ucp1 and two subunits of the cytochrome c complex, Cox6b2 and Cox8c (Table 3). Because of the essential role of UCP1 in the regulation of BAT thermogenesis and its ability to affect mitochondrial respiration, we analyzed the expression of UCP1 by qRT-PCR and Western blotting. Both of these methods confirmed a significant decrease in UCP1 expression in the BAT of α−/− mice compared with the control (Fig. 7, B and C). Further analysis of the α−/− BAT also revealed a decrease in gene expression of peroxisome proliferator-activated receptor-γ (Pparg) and peroxisome proliferator-activated receptor-γ coactivator 1α (Ppargc1a), both of which are involved in activating the thermogenic program (Fig. 7B). These results suggest that reduced respiration of α−/− BAT is caused by a decrease in expression of genes important for mitochondrial function.
Fig. 7.
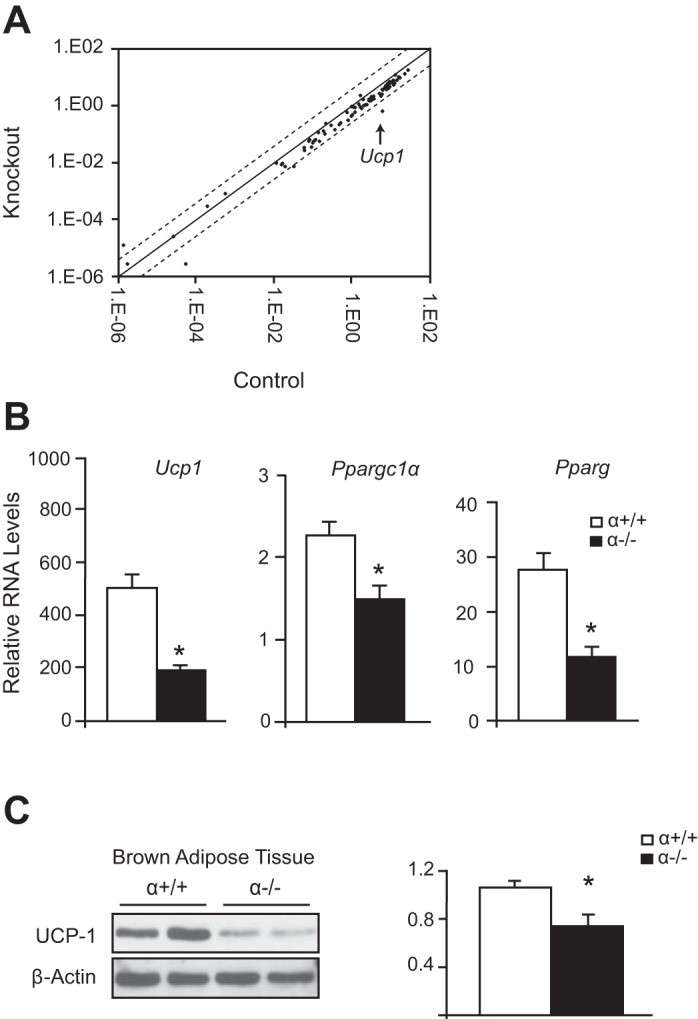
Altered gene expression in BAT of α−/− mice. A: microarray analysis of mitochondrial-specific and associated gene expression in pooled brown adipocytes of α+/+ and α−/− mice (3 per group). Dashed lines represent 4-fold change. B: mRNA expression of thermogenic genes (Ucp1, Ppargc1α, Pparg) normalized to Actb (n = 6 per group). C: Western blot (left) showing expression of UCP1 in BAT of α+/+ and α−/− mice. Western blots were quantified (right) by normalizing UCP1 to the loading control (n = 5 per group). *Statistical significance determined by Student's t-test, P < 0.05.
Table 3.
Mitochondrial-associated gene expression in BAT of α−/− and α+/+ mice
| Gene Symbol | Fold Change | Gene Symbol | Fold Change | Gene Symbol | Fold Change |
|---|---|---|---|---|---|
| Cox8c | −18.08 | Cox8a | −1.91 | Ndufa6 | −1.54 |
| Ucp1 | −9.11 | Sdhd | −1.88 | Cox6a1 | −1.51 |
| Cox6b2 | −4.14 | Cox5a | −1.85 | Cox6c | −1.49 |
| Cox6a2 | −2.50 | Sdhb | −1.83 | Ndufb5 | −1.48 |
| Lhpp | −2.49 | Ndufa11 | −1.82 | Ndufs6 | −1.47 |
| Oxa1l | −2.47 | Ndufv2 | −1.80 | Ndufa8 | −1.47 |
| Ppa1 | −2.46 | Ndufs2 | −1.77 | Ndufa3 | −1.42 |
| Atp5c1 | −2.46 | Ndufb8 | −1.76 | Cox4i1 | −1.41 |
| Ppa2 | −2.42 | Atp5b | −1.75 | Ndufs5 | −1.36 |
| Atp5o | −2.25 | Sdhc | −1.75 | Ndufb2 | −1.34 |
| Ndufs3 | −2.15 | Ndufab1 | −1.74 | Uqcr11 | −1.32 |
| Atp5 g2 | −2.14 | Ndufa5 | −1.73 | Atp6v0a2 | −1.29 |
| Ndufb10 | −2.13 | Ndufv1 | −1.73 | Ndufc1 | −1.28 |
| Cox7b | −2.12 | Atp6v1c2 | −1.72 | Atp5 g3 | −1.26 |
| Cox11 | −2.12 | Ndufs4 | −1.72 | Bcs1l | −1.23 |
| Ndufs7 | −2.11 | Atp5j2 | −1.71 | Ndufb7 | −1.23 |
| Uqcrh | −2.07 | Atp5f1 | −1.69 | Atp5 g1 | −1.13 |
| Atp5d | −2.04 | Cox5b | −1.67 | Atp5 h | −1.12 |
| Ndufb4 | −2.04 | Sdha | −1.67 | Atp4b | −1.11 |
| Uqcrc2 | −2.03 | Ndufa4 | −1.67 | Uqcrc1 | −1.07 |
| Ndufb6 | −2.00 | Ndufb9 | −1.65 | Uqcrq | −1.05 |
| Ndufc2 | −2.00 | Cox4i2 | −1.65 | Atp4a | 1.05 |
| Ndufa2 | −1.98 | Ndufb3 | −1.61 | Uqcrfs1 | 1.16 |
| Ndufs1 | −1.96 | Ndufa7 | −1.61 | Atp5j | 1.45 |
| Ndufs8 | −1.96 | Ndufa1 | −1.61 | Atp6v0d2 | 1.56 |
| Cox7a2l | −1.93 | Ndufa10 | −1.57 | Cox7a2 | 1.63 |
| Atp5a1 | −1.92 | Cox6b1 | −1.56 | Atp6v1 g3 | 1.75 |
| Cyc1 | −1.91 | Ndufv3 | −1.55 | Atp6v1e2 | 10.14 |
Fold Change is expressed as α−/− ÷ α+/+.
DISCUSSION
Skeletal muscle, liver, and adipose tissue are major insulin-responsive tissues that control glucose and lipid homeostasis. Although the role of PI3K in the liver and muscle has been examined using genetically modified mice (14, 28, 35, 50), to our knowledge this is the first study that characterizes an adipose tissue-specific PI3K knockout mouse. We show that ablation of p110α in WAT and BAT causes obesity, fatty liver, and glucose intolerance. Our data suggest that obesity arises, at least in part, from low UCP1 expression and impaired respiration in the BAT, which contribute to lower overall energy expenditure of α−/− animals. Since activity and food intake are the same in α−/− and control mice, this creates a positive energy balance permissive for increased lipid storage. In contrast to p110α, ablation of p110β in adipose tissue did not cause a gross metabolic phenotype indicating that p110α is a crucial catalytic subunit of PI3K function in the adipose tissue.
The insulin-induced phosphorylation of Akt in α−/− adipocytes might be mediated by p110β, the remaining insulin-responsive catalytic isoform of PI3K. Production of PIP3 by p110β alone might not be enough to sustain long-term Akt activation. Another possibility is that loss of p110α affects Akt-regulating phosphatases. PTEN dephosphorylates PIP3 to downregulate Akt activity (54). PHLLP dephosphorylates Akt Ser473, while phosphorylation of Akt Thr308 is negatively regulated by PP2A (24, 30). Changes in these phosphatase activities as a result of reduced p110α activity might cause the altered kinetics of Akt phosphorylation in insulin-treated α−/− white adipocytes.
The phenotypes seen in our α−/− mice are similar to those seen in a mouse model of transgenic toxigene BAT ablation. Mice lacking BAT developed obesity, hyperglycemia, hyperinsulinemia, hypertriglyceridemia, and hypercholesterolemia (33). As with our α−/− mice, increased adiposity of young BAT-deficient mice was linked to a decrease in oxygen consumption with no change in food intake. However, by 8 wk of age BAT-ablated animals developed hyperphagia, which further contributed to their obesity (33). Our 4-mo-old α−/− animals did not display hyperphagia even though they had high serum leptin levels, suggesting that they have leptin resistance.
The respiration defect in BAT from the UCP1 knockout mice was substantially different from that of α−/− mice (37). Brown adipocytes from our α−/− mice showed decreased respiration at basal conditions and in response to acute adrenergic stimulation. By contrast, the basal respiration rate was not affected in brown adipocytes from UCP1 knockout mice, but the acute adrenergic response was greatly reduced (37). We believe that the changes seen in the α−/− BAT cannot be fully accounted for by decreased UCP1 expression. The α−/− BAT also had decreased expression of the majority of mitochondrial energy metabolism genes, including a strong reduction in mitochondrial and nuclear transcribed COX subunits that can explain the decreased cytochrome c oxidase activity. COX is an important regulatory enzyme in the electron transport chain, and reduced COX activity is commonly seen in cases of mitochondrial dysfunction (51). Reduced gene expression of the transcription regulators PGC-1α and PPARγ might contribute to suppression of the mitochondrial metabolic program. PGC-1α is known to interact with PPARγ and to regulate mitochondrial respiration through changes in gene expression (45). While the majority of the genes in the array were downregulated in α−/− BAT, we also observed a 10-fold increase in expression of Atp6v1e2 (ATPase lysosomal V1 subunit E2). Whether increased expression of this lysosomal ATPase contributes to the reduction in cellular respiration is unclear.
It is well established that insulin resistance strongly correlates with impaired mitochondrial function. Patients with type 2 diabetes or morbid obesity exhibited a decrease in mitochondrial respiration and mitochondrial gene expression (8, 40, 43, 49). Adipocytes from type 2 diabetic db/db mice showed depressed cell respiration stemming from a reduction in mitochondrial proteins and low UCP1 expression (15, 48). Experiments on immortalized brown adipocytes showed that long-term insulin treatment upregulated UCP1 via a pathway that required IRS-1 signaling to PI3K and Akt (53). Furthermore, UCP1 expression in IRS-1-null adipocytes was increased in the absence of insulin upon retroviral expression of PPARγ. It is possible that low PPARγ and reduced insulin activation of PI3K associated with IRS-1 in α−/− BAT are responsible for low expression of UCP1 and other genes involved in mitochondrial energy metabolism. PI3K may also positively regulate cellular respiration in a manner independent of changes in gene expression through Akt-dependent phosphorylation of mitochondrial proteins (32), and these events are expected to be suppressed in α−/− BAT.
Some of the phenotypes of our p110α and p110β knockout mice are similar to those of whole body kinase-dead PI3K knockin mice (16, 23). The global p110β kinase-dead mouse exhibited no change in adipose tissue mass and developed signs of mild insulin resistance with age, whereas global p110α kinase-dead heterozygous mice developed increased adiposity and glucose intolerance. The similarities between the global p110α kinase-dead mouse and our adipose-specific p110α-null mice suggest that the main site of action of p110α in regulating carbohydrate and fat metabolism might be the adipose tissue. While we believe that the adipose tissue is the primary target of aP2-Cre mediated deletion of p110α we cannot exclude the possibility that p110α expression is affected in other tissues expressing the aP2 promoter. However, whole body kinase-dead p110α heterozygous mice were hyperphagic with high serum leptin levels, strongly suggesting leptin resistance (23). Interestingly, our α−/− mice showed no decrease in food intake despite a 10-fold higher serum leptin level compared with controls, indicating that loss of adipose-specific p110α might confer a loss of central leptin responsiveness. Recent studies have demonstrated that cross-talk between the insulin and leptin signaling pathways in the hypothalamus contributes to the regulation of energy homeostasis (38, 56, 57). It was demonstrated by Al-Qassab et al. that mice lacking p110β in the POMC neurons were unable to attenuate food intake despite high serum leptin due to decreased hypothalamic response to leptin and insulin (2). It is possible that elevated glucose levels and hyperinsulinemia interfere with the ability of high serum leptin to control feeding behavior in our α−/− mice.
It is interesting that the FIRKO mouse and our α−/− animals, which were both produced to model insulin resistance in fat, display opposite phenotypes. FIRKO mice had low fat mass, normal or improved glucose tolerance, decreased serum triglycerides and fasted insulin, and normal serum free fatty acids and cholesterol compared with controls (7). In addition, UCP1 expression was unchanged or increased in BAT of FIRKO mice (7). Several explanations could account for the differences between these two models. First, distinct compensatory mechanisms might occur during development in each model. Second, the IR might activate targets other than p110α, so complete abrogation of IR signaling results in a gene expression pattern different from that caused by the loss of p110α alone. Third, p110α might be activated by multiple signaling inputs in BAT and not just IR signaling. Finally, it should be noted that both the IR and PI3K catalytic subunits have kinase-independent functions that are lost in knockout models but presumably still operate in insulin resistance (9, 26).
Our results show that reduced p110α signaling in adipocytes causes profound effects on basal BAT respiration and produces a whole body phenotype similar to that seen in metabolic syndrome. A better understanding of how p110α regulates BAT function may provide insight into the pathogenesis and treatment of this disorder.
GRANTS
This study was funded in part by grants from the Department of Veterans Affairs Merit Review Program and the National Institutes of Health (DK-62722 and CA-136754).
DISCLOSURES
No conflicts of interest, financial or otherwise, are declared by the author(s).
AUTHOR CONTRIBUTIONS
Author contributions: V.L.N., K.G.D., L.M.B., and R.Z.L. conception and design of research; V.L.N., Y.-P.J., K.G.D., and L.M.B. performed experiments; V.L.N. and K.G.D. analyzed data; V.L.N., Y.-P.J., K.G.D., and L.M.B. interpreted results of experiments; V.L.N. prepared figures; V.L.N. and R.Z.L. drafted manuscript; V.L.N., L.M.B., and R.Z.L. edited and revised manuscript; V.L.N., L.M.B., and R.Z.L. approved final version of manuscript.
REFERENCES
- 1.Adams KF, Schatzkin A, Harris TB, Kipnis V, Mouw T, Ballard-Barbash R, Hollenbeck A, Leitzmann MF. Overweight, obesity, and mortality in a large prospective cohort of persons 50 to 71 years old. N Engl J Med 355: 763–778, 2006 [DOI] [PubMed] [Google Scholar]
- 2.Al-Qassab H, Smith MA, Irvine EE, Guillermet-Guibert J, Claret M, Choudhury AI, Selman C, Piipari K, Clements M, Lingard S, Chandarana K, Bell JD, Barsh GS, Smith AJ, Batterham RL, Ashford ML, Vanhaesebroeck B, Withers DJ. Dominant role of the p110beta isoform of PI3K over p110alpha in energy homeostasis regulation by POMC and AgRP neurons. Cell Metab 10: 343–354, 2009 [DOI] [PMC free article] [PubMed] [Google Scholar]
- 3.Alwan A. Global Status Report On Noncommunicable Diseases. World Health Organization, 2010 [Google Scholar]
- 4.Ballou LM, Cross ME, Huang S, McReynolds EM, Zhang BX, Lin RZ. Differential regulation of the phosphatidylinositol 3-kinase/Akt and p70 S6 kinase pathways by the alpha(1A)-adrenergic receptor in rat-1 fibroblasts. J Biol Chem 275: 4803–4809, 2000 [DOI] [PubMed] [Google Scholar]
- 5.Ballou LM, Tian PY, Lin HY, Jiang YP, Lin RZ. Dual regulation of glycogen synthase kinase-3beta by the alpha1A-adrenergic receptor. J Biol Chem 276: 40910–40916, 2001 [DOI] [PubMed] [Google Scholar]
- 6.Barlow C, Schroeder M, Lekstrom-Himes J, Kylefjord H, Deng CX, Wynshaw-Boris A, Spiegelman BM, Xanthopoulos KG. Targeted expression of Cre recombinase to adipose tissue of transgenic mice directs adipose-specific excision of loxP-flanked gene segments. Nucleic Acids Res 25: 2543–2545, 1997 [DOI] [PMC free article] [PubMed] [Google Scholar]
- 7.Bluher M, Michael MD, Peroni OD, Ueki K, Carter N, Kahn BB, Kahn CR. Adipose tissue selective insulin receptor knockout protects against obesity and obesity-related glucose intolerance. Dev Cell 3: 25–38, 2002 [DOI] [PubMed] [Google Scholar]
- 8.Bogacka I, Ukropcova B, McNeil M, Gimble JM, Smith SR. Structural and functional consequences of mitochondrial biogenesis in human adipocytes in vitro. J Clin Endocrinol Metab 90: 6650–6656, 2005 [DOI] [PubMed] [Google Scholar]
- 9.Boucher J, Tseng YH, Kahn CR. Insulin and insulin-like growth factor-1 receptors act as ligand-specific amplitude modulators of a common pathway regulating gene transcription. J Biol Chem 285: 17235–17245, 2010 [DOI] [PMC free article] [PubMed] [Google Scholar]
- 10.Bruning JC, Michael MD, Winnay JN, Hayashi T, Horsch D, Accili D, Goodyear LJ, Kahn CR. A muscle-specific insulin receptor knockout exhibits features of the metabolic syndrome of NIDDM without altering glucose tolerance. Mol Cell 2: 559–569, 1998 [DOI] [PubMed] [Google Scholar]
- 11.Cannon B, Nedergaard J. Brown adipose tissue: function and physiological significance. Physiol Rev 84: 277–359, 2004 [DOI] [PubMed] [Google Scholar]
- 12.Cannon B, Nedergaard J. Nonshivering thermogenesis and its adequate measurement in metabolic studies. J Exp Biol 214: 242–253, 2011 [DOI] [PubMed] [Google Scholar]
- 13.Cannon B, Nedergaard J. Studies of thermogenesis and mitochondrial function in adipose tissues. Methods Mol Biol 456: 109–121, 2008 [DOI] [PubMed] [Google Scholar]
- 14.Chattopadhyay M, Selinger ES, Ballou LM, Lin RZ. Ablation of PI3K p110-alpha prevents high-fat diet-induced liver steatosis. Diabetes 60: 1483–1492, 2011 [DOI] [PMC free article] [PubMed] [Google Scholar]
- 15.Choo HJ, Kim JH, Kwon OB, Lee CS, Mun JY, Han SS, Yoon YS, Yoon G, Choi KM, Ko YG. Mitochondria are impaired in the adipocytes of type 2 diabetic mice. Diabetologia 49: 784–791, 2006 [DOI] [PubMed] [Google Scholar]
- 16.Ciraolo E, Iezzi M, Marone R, Marengo S, Curcio C, Costa C, Azzolino O, Gonella C, Rubinetto C, Wu H, Dastru W, Martin EL, Silengo L, Altruda F, Turco E, Lanzetti L, Musiani P, Ruckle T, Rommel C, Backer JM, Forni G, Wymann MP, Hirsch E. Phosphoinositide 3-kinase p110beta activity: key role in metabolism and mammary gland cancer but not development. Sci Signaling 1: ra3, 2008 [DOI] [PMC free article] [PubMed] [Google Scholar]
- 17.Cypess AM, Lehman S, Williams G, Tal I, Rodman D, Goldfine AB, Kuo FC, Palmer EL, Tseng YH, Doria A, Kolodny GM, Kahn CR. Identification and importance of brown adipose tissue in adult humans. N Engl J Med 360: 1509–1517, 2009 [DOI] [PMC free article] [PubMed] [Google Scholar]
- 18.Dickman KG, Hempson SJ, Anderson J, Lippe S, Zhao L, Burakoff R, Shaw RD. Rotavirus alters paracellular permeability and energy metabolism in Caco-2 cells. Am J Physiol Gastrointest Liver Physiol 279: G757–G766, 2000 [DOI] [PubMed] [Google Scholar]
- 19.Elia M, Livesey G. Energy expenditure and fuel selection in biological systems: the theory and practice of calculations based on indirect calorimetry and tracer methods. World Rev Nutr Diet 70: 68–131, 1992 [DOI] [PubMed] [Google Scholar]
- 20.Enerback S, Jacobsson A, Simpson EM, Guerra C, Yamashita H, Harper ME, Kozak LP. Mice lacking mitochondrial uncoupling protein are cold-sensitive but not obese. Nature 387: 90–94, 1997 [DOI] [PubMed] [Google Scholar]
- 21.Farooqi IS, Wangensteen T, Collins S, Kimber W, Matarese G, Keogh JM, Lank E, Bottomley B, Lopez-Fernandez J, Ferraz-Amaro I, Dattani MT, Ercan O, Myhre AG, Retterstol L, Stanhope R, Edge JA, McKenzie S, Lessan N, Ghodsi M, De Rosa V, Perna F, Fontana S, Barroso I, Undlien DE, O'Rahilly S. Clinical and molecular genetic spectrum of congenital deficiency of the leptin receptor. N Engl J Med 356: 237–247, 2007 [DOI] [PMC free article] [PubMed] [Google Scholar]
- 22.Feldmann HM, Golozoubova V, Cannon B, Nedergaard J. UCP1 ablation induces obesity and abolishes diet-induced thermogenesis in mice exempt from thermal stress by living at thermoneutrality. Cell Metab 9: 203–209, 2009 [DOI] [PubMed] [Google Scholar]
- 23.Foukas LC, Claret M, Pearce W, Okkenhaug K, Meek S, Peskett E, Sancho S, Smith AJ, Withers DJ, Vanhaesebroeck B. Critical role for the p110alpha phosphoinositide-3-OH kinase in growth and metabolic regulation. Nature 441: 366–370, 2006 [DOI] [PubMed] [Google Scholar]
- 24.Gao T, Furnari F, Newton AC. PHLPP: a phosphatase that directly dephosphorylates Akt, promotes apoptosis, and suppresses tumor growth. Mol Cell 18: 13–24, 2005 [DOI] [PubMed] [Google Scholar]
- 25.Ge FX, Zhou SL, Hu CG, Lobdell H, Berk PD. Insulin- and leptin-regulated fatty acid uptake plays a key causal role in hepatic steatosis in mice with intact leptin signaling but not in ob/ob or db/db mice. Am J Physiol Gastrointest Liver Physiol 299: G855–G866, 2010 [DOI] [PMC free article] [PubMed] [Google Scholar]
- 26.Hirsch E, Braccini L, Ciraolo E, Morello F, Perino A. Twice upon a time: PI3K's secret double life exposed. Trends Biochem Sci 34: 244–248, 2009 [DOI] [PubMed] [Google Scholar]
- 27.Hummel KP, Dickie MM, Coleman DL. Diabetes, a new mutation in the mouse. Science 153: 1127–1128, 1966 [DOI] [PubMed] [Google Scholar]
- 28.Jia S, Liu Z, Zhang S, Liu P, Zhang L, Lee SH, Zhang J, Signoretti S, Loda M, Roberts TM, Zhao JJ. Essential roles of PI(3)K-p110beta in cell growth, metabolism and tumorigenesis. Nature 454: 776–779, 2008 [DOI] [PMC free article] [PubMed] [Google Scholar]
- 29.Knight ZA, Gonzalez B, Feldman ME, Zunder ER, Goldenberg DD, Williams O, Loewith R, Stokoe D, Balla A, Toth B, Balla T, Weiss WA, Williams RL, Shokat KM. A pharmacological map of the PI3-K family defines a role for p110alpha in insulin signaling. Cell 125: 733–747, 2006 [DOI] [PMC free article] [PubMed] [Google Scholar]
- 30.Kuo YC, Huang KY, Yang CH, Yang YS, Lee WY, Chiang CW. Regulation of phosphorylation of Thr-308 of Akt, cell proliferation, and survival by the B55alpha regulatory subunit targeting of the protein phosphatase 2A holoenzyme to Akt. J Biol Chem 283: 1882–1892, 2008 [DOI] [PubMed] [Google Scholar]
- 31.Lee KY, Russell SJ, Ussar S, Boucher J, Vernochet C, Mori MA, Smyth G, Rourk M, Cederquist C, Rosen ED, Kahn BB, Kahn CR. Lessons on conditional gene targeting in mouse adipose tissue. Diabetes 62: 864–874, 2013 [DOI] [PMC free article] [PubMed] [Google Scholar]
- 32.Li C, Li Y, He L, Agarwal AR, Zeng N, Cadenas E, Stiles BL. PI3K/AKT signaling regulates bioenergetics in immortalized hepatocytes. Free Radic Biol Med 60: 29–40, 2013 [DOI] [PMC free article] [PubMed] [Google Scholar]
- 33.Lowell BB, VSS, Hamann A, Lawitts JA, Himms-Hagen J, Boyer BB, Kozak LP, Flier JS. Development of obesity in transgenic mice after genetic ablation of brown adipose tissue. Nature 366: 740–742, 1993 [DOI] [PubMed] [Google Scholar]
- 34.Lu Z, Jiang YP, Wang W, Xu XH, Mathias RT, Entcheva E, Ballou LM, Cohen IS, Lin RZ. Loss of cardiac phosphoinositide 3-kinase p110 alpha results in contractile dysfunction. Circulation 120: 318–325, 2009 [DOI] [PMC free article] [PubMed] [Google Scholar]
- 35.Luo J, Sobkiw CL, Hirshman MF, Logsdon MN, Li TQ, Goodyear LJ, Cantley LC. Loss of class IA PI3K signaling in muscle leads to impaired muscle growth, insulin response, and hyperlipidemia. Cell Metab 3: 355–366, 2006 [DOI] [PubMed] [Google Scholar]
- 36.Margetic S, Gazzola C, Pegg GG, Hill RA. Leptin: a review of its peripheral actions and interactions. Int J Obes 26: 1407–1433, 2002 [DOI] [PubMed] [Google Scholar]
- 37.Matthias A, Ohlson KB, Fredriksson JM, Jacobsson A, Nedergaard J, Cannon B. Thermogenic responses in brown fat cells are fully UCP1-dependent. UCP2 or UCP3 do not substitute for UCP1 in adrenergically or fatty scid-induced thermogenesis. J Biol Chem 275: 25073–25081, 2000 [DOI] [PubMed] [Google Scholar]
- 38.Metlakunta AS, Sahu M, Sahu A. Hypothalamic phosphatidylinositol 3-kinase pathway of leptin signaling is impaired during the development of diet-induced obesity in FVB/N mice. Endocrinology 149: 1121–1128, 2008 [DOI] [PMC free article] [PubMed] [Google Scholar]
- 39.Michael MD, Kulkarni RN, Postic C, Previs SF, Shulman GI, Magnuson MA, Kahn CR. Loss of insulin signaling in hepatocytes leads to severe insulin resistance and progressive hepatic dysfunction. Mol Cell 6: 87–97, 2000 [PubMed] [Google Scholar]
- 40.Mootha VK, Lindgren CM, Eriksson KF, Subramanian A, Sihag S, Lehar J, Puigserver P, Carlsson E, Ridderstrale M, Laurila E, Houstis N, Daly MJ, Patterson N, Mesirov JP, Golub TR, Tamayo P, Spiegelman B, Lander ES, Hirschhorn JN, Altshuler D, Groop LC. PGC-1alpha-responsive genes involved in oxidative phosphorylation are coordinately downregulated in human diabetes. Nat Genet 34: 267–273, 2003 [DOI] [PubMed] [Google Scholar]
- 41.Nicholls DG, Bernson VS, Heaton GM. The identification of the component in the inner membrane of brown adipose tissue mitochondria responsible for regulating energy dissipation. Experientia Supplementum 32: 89–93, 1978 [DOI] [PubMed] [Google Scholar]
- 42.Okada T, Kawano Y, Sakakibara T, Hazeki O, Ui M. Essential role of phosphatidylinositol 3-kinase in insulin-induced glucose transport and antilipolysis in rat adipocytes. Studies with a selective inhibitor wortmannin. J Biol Chem 269: 3568–3573, 1994 [PubMed] [Google Scholar]
- 43.Patti ME, Butte AJ, Crunkhorn S, Cusi K, Berria R, Kashyap S, Miyazaki Y, Kohane I, Costello M, Saccone R, Landaker EJ, Goldfine AB, Mun E, DeFronzo R, Finlayson J, Kahn CR, Mandarino LJ. Coordinated reduction of genes of oxidative metabolism in humans with insulin resistance and diabetes: Potential role of PGC1 and NRF1. Proc Natl Acad Sci USA 100: 8466–8471, 2003 [DOI] [PMC free article] [PubMed] [Google Scholar]
- 44.Pischon T, Boeing H, Hoffmann K, Bergmann M, Schulze MB, Overvad K, van der Schouw YT, Spencer E, Moons KG, Tjonneland A, Halkjaer J, Jensen MK, Stegger J, Clavel-Chapelon F, Boutron-Ruault MC, Chajes V, Linseisen J, Kaaks R, Trichopoulou A, Trichopoulos D, Bamia C, Sieri S, Palli D, Tumino R, Vineis P, Panico S, Peeters PH, May AM, Bueno-de-Mesquita HB, van Duijnhoven FJ, Hallmans G, Weinehall L, Manjer J, Hedblad B, Lund E, Agudo A, Arriola L, Barricarte A, Navarro C, Martinez C, Quiros JR, Key T, Bingham S, Khaw KT, Boffetta P, Jenab M, Ferrari P, Riboli E. General and abdominal adiposity and risk of death in Europe. N Engl J Med 359: 2105–2120, 2008 [DOI] [PubMed] [Google Scholar]
- 45.Puigserver P, Spiegelman BM. Peroxisome proliferator-activated receptor-gamma coactivator 1 alpha (PGC-1 alpha): transcriptional coactivator and metabolic regulator. Endocr Rev 24: 78–90, 2003 [DOI] [PubMed] [Google Scholar]
- 46.Rondinone CM, Carvalho E, Wesslau C, Smith UP. Impaired glucose transport and protein kinase B activation by insulin, but not okadaic acid, in adipocytes from subjects with Type II diabetes mellitus. Diabetologia 42: 819–825, 1999 [DOI] [PubMed] [Google Scholar]
- 47.Rondinone CM, Wang LM, Lonnroth P, Wesslau C, Pierce JH, Smith U. Insulin receptor substrate (IRS) 1 is reduced and IRS-2 is the main docking protein for phosphatidylinositol 3-kinase in adipocytes from subjects with non-insulin-dependent diabetes mellitus. Proc Natl Acad Sci USA 94: 4171–4175, 1997 [DOI] [PMC free article] [PubMed] [Google Scholar]
- 48.Rong JX, Qiu Y, Hansen MK, Zhu L, Zhang V, Xie M, Okamoto Y, Mattie MD, Higashiyama H, Asano S, Strum JC, Ryan TE. Adipose mitochondrial biogenesis is suppressed in db/db and high-fat diet-fed mice and improved by rosiglitazone. Diabetes 56: 1751–1760, 2007 [DOI] [PubMed] [Google Scholar]
- 49.Semple RK, Crowley VC, Sewter CP, Laudes M, Christodoulides C, Considine RV, Vidal-Puig A, O'Rahilly S. Expression of the thermogenic nuclear hormone receptor coactivator PGC-1alpha is reduced in the adipose tissue of morbidly obese subjects. Int J Obes Rel Metab Dis 28: 176–179, 2004 [DOI] [PubMed] [Google Scholar]
- 50.Sopasakis VR, Liu P, Suzuki R, Kondo T, Winnay J, Tran TT, Asano T, Smyth G, Sajan MP, Farese RV, Kahn CR, Zhao JJ. Specific roles of the p110alpha isoform of phosphatidylinsositol 3-kinase in hepatic insulin signaling and metabolic regulation. Cell Metab 11: 220–230, 2010 [DOI] [PMC free article] [PubMed] [Google Scholar]
- 51.Srinivasan S, Avadhani NG. Cytochrome c oxidase dysfunction in oxidative stress. Free Radic Biol Med 53: 1252–1263, 2012 [DOI] [PMC free article] [PubMed] [Google Scholar]
- 52.Taniguchi CM, Emanuelli B, Kahn CR. Critical nodes in signalling pathways: insights into insulin action. Nat Rev Mol Cell Biol 7: 85–96, 2006 [DOI] [PubMed] [Google Scholar]
- 53.Valverde AM, Arribas M, Mur C, Navarro P, Pons S, Cassard-Doulcier AM, Kahn CR, Benito M. Insulin-induced up-regulated uncoupling protein-1 expression is mediated by insulin receptor substrate 1 through the phosphatidylinositol 3-kinase/Akt signaling pathway in fetal brown adipocytes. J Biol Chem 278: 10221–10231, 2003 [DOI] [PubMed] [Google Scholar]
- 54.Vanhaesebroeck B, Leevers SJ, Ahmadi K, Timms J, Katso R, Driscoll PC, Woscholski R, Parker PJ, Waterfield MD. Synthesis and function of 3-phosphorylated inositol lipids. Annu Rev Biochem 70: 535–602, 2001 [DOI] [PubMed] [Google Scholar]
- 55.Viswanadha S, Londos C. Determination of lipolysis in isolated primary adipocytes. Methods Mol Biol 456: 299–306, 2008 [DOI] [PubMed] [Google Scholar]
- 56.Williams KW, Sohn JW, Donato J, Jr, Lee CE, Zhao JJ, Elmquist JK, Elias CF. The acute effects of leptin require PI3K signaling in the hypothalamic ventral premammillary nucleus. J Neurosci 31: 13147–13156, 2011 [DOI] [PMC free article] [PubMed] [Google Scholar]
- 57.Xu Y, Hill JW, Fukuda M, Gautron L, Sohn JW, Kim KW, Lee CE, Choi MJ, Lauzon DA, Dhillon H, Lowell BB, Zigman JM, Zhao JJ, Elmquist JK. PI3K signaling in the ventromedial hypothalamic nucleus is required for normal energy homeostasis. Cell Metab 12: 88–95, 2010 [DOI] [PMC free article] [PubMed] [Google Scholar]