Abstract
Aims/Introduction
To evaluate whether hemoglobin A1c (HbA1c) levels are affected by hemoglobin level and gender.
Materials and Methods
A cross‐sectional analysis was carried out in a sample of 87,284 non‐diabetic Koreans without anemia who participated in comprehensive health check‐ups between January and December 2009 at the Kangbuk Samsung Hospital Total Healthcare Center in Seoul, Korea. We categorized men and women separately according to fasting plasma glucose and hemoglobin level to carry out the analysis.
Results
HbA1c increased steadily with increasing fasting plasma glucose level. Both men and women with lower hemoglobin had significantly higher HbA1c at a given fasting glucose level, and this result was consistent across the fasting glucose quintiles within the non‐diabetic range. Women had a lower mean hemoglobin value compared with men, and women had higher HbA1c levels at a given fasting glucose level consistently across the fasting glucose deciles. There was also a gender‐specific association between age and HbA1c (P < 0.001 for interaction).
Conclusions
HbA1c values were affected by hemoglobin level and gender in non‐anemic Koreans. Thus, hemoglobin level and gender should be considered in the diagnosis of diabetes using HbA1c.
Keywords: Gender, Hemoglobin, Hemoglobin A1c
Introduction
Hemoglobin A1 (HbA1c) is the gold‐standard measure for the assessment of glycemic control, and has recently been recommended for use in the diagnosis of diabetes1. Because of the long lifespan of erythrocytes, HbA1c levels reflect average glycemia over a long‐term period of time (2–3 months). However, HbA1c measurements have several limitations, and interpretation of HbA1c levels can be problematic2.
Plasma glucose molecules can attach to the hemoglobin in erythrocytes through non‐enzymatic glycation, which results in a small hemoglobin variant of HbA1c2. Any conditions that affect hemoglobin features, erythrocyte turnover and hemoglobin glycation could influence HbA1c values independent of glycemia2. Thus, the relationship between mean glycemia and the HbA1c value might not be the same in all people5. The HbA1c result is calculated as the ratio of glycated hemoglobin to total hemoglobin6, suggesting that the hemoglobin level could affect HbA1c test results independently of glycemia. However, the association between hemoglobin levels and HbA1c results had not been investigated. Here we examined the relationship between HbA1c and hemoglobin levels in non‐diabetic and non‐anemic Koreans. In addition, we compared the HbA1c level between men and women because of the well‐known difference in hemoglobin level between genders7.
Materials and Methods
Participants
More than 80,000 people undergo comprehensive health check‐ups each year at the Kangbuk Samsung Hospital Total Healthcare Center, Seoul, Korea. Most seek medical check‐ups either on their own initiative or because their employers cover the cost of medical check‐ups for employees and their families. All anthropometric data, laboratory tests, results of radiological images and coded answers to self‐report questionnaires were stored in electronic medical records8. Initial data were obtained from 97,972 participants aged over 20 years‐of‐age who participated in comprehensive health check‐ups between January and December 2009. Among these participants, 10,688 were excluded for the following reasons: (i) anemia with hemoglobin level <13.5 g/dL in men (n = 999) and <11.5 g/dL in women (n = 3,370); (ii) above reference range of hemoglobin with >17.5 g/dL in men (n = 683) and >16 g/dL in women (n = 23); (iii) self‐reported diabetes (n = 3,648), fasting plasma glucose concentration ≥126 mg/dL (n = 2,876), or HbA1c ≥6.5% (n = 3,339); (iv) chronic kidney disease with creatinine ≥1.5 mg/dL (n = 310); and (v) absence of HbA1c data (n = 34). After applying the above exclusion criteria, the total number of participants eligible for the study was 87,284 (52,360 men and 34,924 women).
Measurements
Blood samples were collected from the antecubital vein after an overnight fast. Fasting blood glucose was measured using Bayer Reagent Packs on an automated chemistry analyzer (Advia 1650™ Autoanalyzer; Bayer Diagnostics, Leverkusen, Germany). The blood glucose concentration was determined using the hexokinase method. HbA1c determination was based on the turbidimetric inhibition immunoassay using a Cobas Integra 800 automatic analyzer (Roche Diagnostics, Rotkreuz, Switzerland) with a reference value range of 4.4–6.4%. HbA1c measurements were standardized to the reference method aligned with the Diabetes Control and Complication Trial (DCCT) and the National Glycohemoglobin Standardization Program (NGSP) standards. The intra‐assay coefficient of variation (CV) was 2.3% and interassay CV was 2.4%, both of which are within the NGSP acceptable range. Anthropometric and other biochemical variables were measured as described previously8. All of the laboratory tests were carried out at the same laboratory. Hemoglobin was measured using a flow cytometry and semiconductor diode laser systems on a fully‐automated hematology analyzer (Sysmex XE‐2100; Sysmex Cooperation, Kobe, Japan).
The present study was exempted from the requirement of informed consent by the institutional review board, because researchers only accessed the database for analytical purposes, and personal information was not accessed. The study was approved by the institutional review board at Kangbuk Samsung Hospital.
Study Design and Statistical Analysis
We categorized men and women separately according to fasting plasma glucose level into quintiles and hemoglobin level into tertiles (≤12.7 g/dL [mean ± standard deviation 12.3 ± 0.3 g/dL], 12.8–13.5 g/dL [13.1 ± 0.2 g/dL] and ≥13.6 g/dL [14.1± 0.4 g/dL] in women, and ≤15.1 g/dL [14.6 ± 0.4 g/dL], 15.2–15.8 g/dL [15.5 ± 0.2 g/dL] and ≥15.9 g/dL [16.4 ± 0.4 g/dL] in men). HbA1c levels were analyzed by fasting plasma glucose and by hemoglobin. Differences in HbA1c by fasting plasma glucose and hemoglobin were estimated by a two‐way analysis of variance (anova) using a general linear model (GLM) procedure with adjustment for age. Post‐hoc comparisons between hemoglobin tertiles were carried out by Tukey's test. In addition, we categorized participants by hemoglobin levels into deciles, and evaluated the relationship between HbA1c and hemoglobin level using a GLM procedure with adjustment for age and fasting glucose. Multiple linear regression analyses between HbA1c and other variables including age, fasting plasma glucose, and hemoglobin were also carried out for men or women. Secondary analyses were carried out to assess the difference in HbA1c between men and women. After we recategorized fasting plasma glucose level into deciles, differences in HbA1c by fasting plasma glucose and gender was estimated by two‐way anova using a GLM procedure with adjustment for age. Finally, we categorized participants according to age into groups of 5 years, and evaluated whether there was a gender‐specific association between age and HbA1c level with adjustment for hemoglobin and fasting glucose level. The effects of age and gender on HbA1c were estimated by two‐way anova using a GLM procedure. An unpaired t‐test was used to analyze statistical differences in the characteristics of the study participants between men and women. Statistical data analysis was carried out using the spss program (version 18.0; SPSS, Chicago, IL, USA). All of the reported P‐values are two‐tailed, and the statistical significance was set at a P < 0.05.
Results
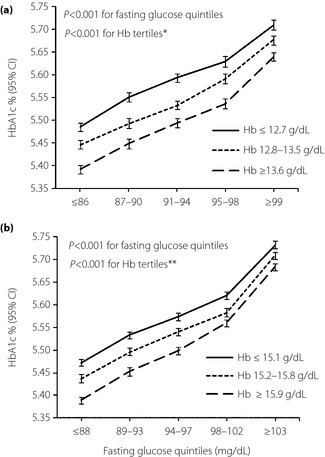
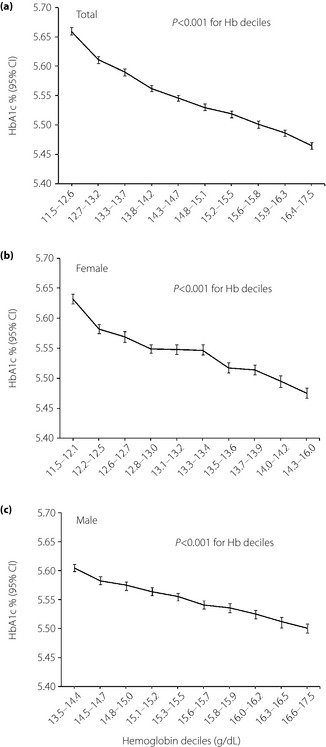
Clinical characteristics of participants are shown in Table 1. The mean age and body mass index of participants was 42 years and 24.5 kg/m2, respectively. A fasting glucose‐stratified comparison of HbA1c between hemoglobin tertiles is shown in Figure 1. HbA1c increased steadily with increasing fasting plasma glucose level. Multiple linear regression analysis for HbA1c also showed a positive association between fasting plasma glucose and HbA1c (β = 0.012, P < 0.001 in both men and women; Table 2). Participants with lower hemoglobin had significantly higher HbA1c at a given fasting glucose level in both men and women, and this result was consistent across the fasting glucose quintiles (Figure 1). Furthermore, HbA1c decreased steadily with increasing hemoglobin level (Figure 2). Multiple linear regression analysis for HbA1c also showed a negative correlation between hemoglobin level and HbA1c value (β = −0.040, P < 0.001 in men; β = −0.053, P < 0.001 in women; Table 2).
Table 1. Clinical characteristics of study participants by gender.
| Male | Female | P‐value* | Total | |
|---|---|---|---|---|
| n | 52,360 (60.2%) | 34,924 (39.8%) | 87,284 | |
| Age (years) | 42.1 ± 8.1 | 42.2 ± 9.0 | 0.8 | 42.1 ± 8.5 |
| Fasting glucose (mg/dL) | 95.4 ± 8.9 | 92.1 ± 8.1 | <0.001 | 94.1 ± 8.7 |
| HbA1c (%) | 5.55 ± 0.26 | 5.54 ± 0.27 | <0.001 | 5.55 ± 0.27 |
| Hb (g/dL) | 15.5 ± 0.8 | 13.2 ± 0.8 | <0.001 | 14.5 ± 1.37 |
| Body mass index (kg/m2) | 24.4 ± 2.8 | 22.2 ± 3.0 | <0.001 | 23.4 ± 3.1 |
| Systolic BP (mmHg) | 116.1 ± 11.4 | 111.0 ± 12.6 | <0.001 | 114.0 ± 12.1 |
| LDL‐C (mg/dL) | 118.6 ± 27.4 | 106.8 ± 29.0 | <0.001 | 113.9 ± 29.7 |
| HDL‐C (mg/dL) | 51.8 ± 11.0 | 61.8 ± 13.5 | <0.001 | 55.8 ± 13.0 |
| Triglyceride (mg/dL) | 146.6 ± 91.3 | 94.2 ± 54.2 | <0.001 | 125.3 ± 82.2 |
| Total cholesterol (mg/dL) | 199.3 ± 33.0 | 191.5 ± 33.1 | <0.001 | 196.1 ± 33.2 |
Data are n (%) or means ± standard deviation. *Estimated by unpaired t‐test. BP, blood pressure; Hb, hemoglobin; HbA1c, hemoglobin A1c; HDL‐C, high‐density lipoprotein cholesterol; HOMA‐IR, homeostasis model assessment of insulin resistance; LDL, low density lipoprotein‐cholesterol.
Figure 1.

Glucose‐stratified comparison of hemoglobin A1c (HbA1c) between hemoglobin tertiles in (a) women (b) men. Adjusted for age. *,**P < 0.001 (Tukey's post‐hoc analysis of two way anova) between all three different combinations of hemoglobin (Hb) groups in women and men, respectively. CI, confidence interval.
Table 2. Multiple linear regression analyses for hemoglobin A1c.
| Independent variable | Men | Women | All* | |||
|---|---|---|---|---|---|---|
| β† | P | β† | P | β† | P | |
| Intercept | 4.948 | <0.001 | 5.049 | <0.001 | 4.937 | <0.001 |
| Age | 0.003 | <0.001 | 0.005 | <0.001 | 0.004 | <0.001 |
| Fasting glucose (mg/dL) | 0.012 | <0.001 | 0.012 | <0.001 | 0.012 | <0.001 |
| Hemoglobin (g/dL) | −0.04 | <0.001 | −0.053 | <0.001 | −0.044 | <0.001 |
| Sex (men/women) | – | – | – | – | 0.068 | <0.001 |
*A total of 19% of the variance of hemoglobin A1c (HbA1c) was explained by the variables in the model (total R2 = 0.187). †The regression coefficient B reflects the estimated difference in HbA1c level as a result of one unit increase in the independent variable.
Figure 2.

Relationship between hemoglobin A1c (HbA1c) and hemoglobin deciles. (a) Adjusted for age, sex and fasting glucose. (b,c) Adjusted for age and fasting glucose. CI, confidence interval.
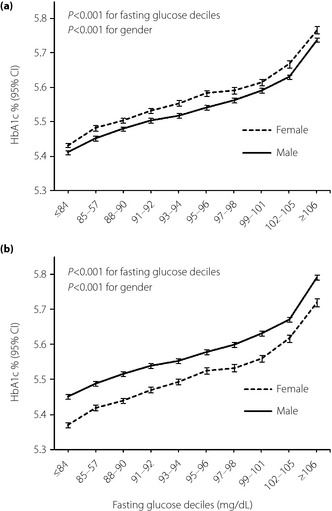
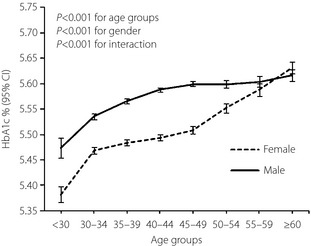
Women had a lower mean hemoglobin value compared with men (13.2 g/dL vs 15.5 g/dL; Table 1). When we compared HbA1c between genders for a given fasting glucose level, women had higher HbA1c levels consistently across the fasting glucose deciles (Figure 3a). However, after adjustment for hemoglobin level, the estimated HbA1c was lower in women than in men consistently across fasting glucose deciles (Figure 3b). HbA1c level was also analyzed by age and gender (Figure 4). We found that estimated HbA1c increased with age in both men and women after adjustment for hemoglobin and fasting glucose. We also detected a gender‐specific association between age and HbA1c (P < 0.001 for interaction), and the gap in HbA1c between genders narrowed in age groups older than 50–54 years.
Figure 3.

Fasting glucose‐stratified comparison of hemoglobin A1c (HbA1c) between genders. (a) Adjusted for age. (b) Adjusted for age and hemoglobin. CI, confidence interval.
Figure 4.

Mean hemoglobin A1c (HbA1c) by gender and age categories. Adjusted for fasting glucose and hemoglobin. CI, confidence interval.
Discussion
We found that HbA1c values are affected by hemoglobin levels. The HbA1c value at a given fasting plasma glucose level differed according to hemoglobin level in both men and women. Participants with lower hemoglobin had higher HbA1c at the same fasting glucose level, and this finding was consistent across the non‐diabetic range of fasting plasma glucose. The HbA1c level increased by approximately 0.1%, coinciding with a decrease of 2 g/dL in the hemoglobin level at the same fasting glucose level in participants without anemia. The present results suggest that within the non‐diabetic glycemic range, hemoglobin level is associated with HbA1c value independent of glycemia.
In the present study, women had higher values of HbA1c compared with men at similar fasting blood glucose levels. Mean red blood cell mass and hemoglobin levels are known to be lower in women than in men7, although the reason for this difference has never been clearly explained. Likewise, we found that the mean level of hemoglobin was 2.3 g/dL lower in women than in men. This inverse relationship between HbA1c and hemoglobin level is also found in other populations. In addition, ethnic differences in HbA1c have been reported for many years, showing that HbA1c levels in African–American samples are higher than in individuals of European descent at similar blood glucose levels5. Although most studies suggested that there could be population and ethnic differences in red blood cell turnover and intra‐ or extracellular environment, as well as genetic variation in hemoglobin glycation, the underlying reasons for ethnic differences in HbA1c are not fully understood2. Considering our findings of an association between hemoglobin and HbA1c level, it is noteworthy that African–Americans were consistently found to have lower hemoglobin levels than did whites in many studies12. This difference in hemoglobin remained significant after controlling for iron deficiency, thalassemia and sickle cell traits that are more common in African–Americans12. Taken together, the population with lower hemoglobin had higher HbA1c at the same level of glycemia5, supporting our assumption that the HbA1c value is associated with hemoglobin level independently of glycemia.
Even after adjustment for hemoglobin level, estimated HbA1c was consistently lower in women than in men across different levels of fasting glucose. This finding showed not only that hemoglobin level might affect the HbA1c value independently of glycemia, but also that HbA1c might be affected by gender itself independently of the hemoglobin level. It is possible that menstruation contributed to the gender difference of HbA1c, independently of hemoglobin level16. Despite their normal range of hemoglobin, menstruating women have a more rapid erythrocyte turnover17, and increased reticulocyte production will reduce the age of the average erythrocyte and lower HbA1c. Sex hormones might also contribute to this gender difference. Our comparisons of HbA1c levels according to age and gender supports these assumptions. After adjustment for hemoglobin and fasting glucose, the gender gap in HbA1c narrowed in the peri‐ and postmenopausal age group. Our finding that HbA1c increased with age in both men and women is also supported by previous studies18.
Anemia is a well‐known confounder that influences HbA1c values. Hemolytic anemia decreases HbA1c levels because of increased production of younger red blood cells, which contain hemoglobin with less exposure to ambient glycemia. Conversely, aplastic anemia, which increases the average age of circulating erythrocytes, leads to an increase in the concentration of HbA1c independent of glycemia2. In the present study, participants with anemia were excluded and hemoglobin levels were within the normal range in all participants. Thus, the observed differences in hemoglobin were not as a result of anemia.
A limitation of the present study was that we had only fasting glucose data. Fasting plasma glucose does not reflect mean glucose. Not all individuals with the same or similar level of fasting plasma glucose are at the same glycemic status. Thus, further studies should include other measurements, such as a meal tolerance test or continuous glucose monitoring. Nevertheless, the large sample size and consistent results of the present study strengthen our findings.
Individuals with lower hemoglobin without anemia had higher HbA1c at the same fasting glucose level within the non‐diabetic range. Women had higher values of HbA1c compared with men at similar fasting glucose levels, and this difference in HbA1c is thought to be attributed to lower hemoglobin levels in women. However, after adjustment for hemoglobin level, HbA1c remained consistently lower in women compared with men. This finding showed not only that hemoglobin level might affect HbA1c values independently of glycemia, but also that gender itself might affect HbA1c independently of hemoglobin levels.
In conclusion, HbA1c values are affected by both hemoglobin level and gender in non‐anemic Koreans. We suggest that hemoglobin level and gender should be considered in the diagnosis of diabetes using HbA1c.
Acknowledgements
This work was supported by the Dong‐A University research fund. The funding source had no role in the oversight or design of the study, in the analysis or interpretation of the data or in the decision to submit the manuscript for publication. All authors do not have any conflict of interest to report
J Diabetes Invest 2014; 5: 60–65
References
- 1.American Diabetes Association . Standards of medical care in diabetes–2010. Diabetes Care 2010; 33(Suppl 1): S11–S61 [DOI] [PMC free article] [PubMed] [Google Scholar]
- 2.Dagogo‐Jack S. Pitfalls in the use of HbA(c) as a diagnostic test: the ethnic conundrum. Nat Rev Endocrinol 2010; 6: 589–593 [DOI] [PubMed] [Google Scholar]
- 3.Saudek CD, Herman WH, Sacks DB, et al A new look at screening and diagnosing diabetes mellitus. J Clin Endocrinol Metab 2008; 93: 2447–2453 [DOI] [PubMed] [Google Scholar]
- 4.Cohen RM, Franco RS, Khera PK, et al Red cell life span heterogeneity in hematologically normal people is sufficient to alter HbA1c. Blood 2008; 112: 4284–4291 [DOI] [PMC free article] [PubMed] [Google Scholar]
- 5.Herman WH, Cohen RM. Racial and ethnic differences in the relationship between HbA1c and blood glucose: implications for the diagnosis of diabetes. J Clin Endocrinol Metab 2012; 97: 1067–1072 [DOI] [PMC free article] [PubMed] [Google Scholar]
- 6.Groche D, Hoeno W, Hoss G, et al Standardization of two immunological HbA1c routine assays according to the new IFCC reference method. Clin Lab 2003; 49: 657–661 [PubMed] [Google Scholar]
- 7.Pan WH, Habicht JP. The non‐iron‐deficiency‐related difference in hemoglobin concentration distribution between blacks and whites and between men and women. Am J Epidemiol 1991; 134: 1410–1416 [DOI] [PubMed] [Google Scholar]
- 8.Bae JC, Rhee EJ, Lee WY, et al Optimal range of HbA1c for the prediction of future diabetes: a 4‐year longitudinal study. Diabetes Res Clin Pract 2011; 93: 255–259 [DOI] [PubMed] [Google Scholar]
- 9.Saaddine JB, Fagot‐Campagna A, Rolka D, et al Distribution of HbA(1c) levels for children and young adults in the US: Third National Health and Nutrition Examination Survey. Diabetes Care 2002; 25: 1326–1330 [DOI] [PubMed] [Google Scholar]
- 10.Herman WH, Dungan KM, Wolffenbuttel BH, et al Racial and ethnic differences in mean plasma glucose, hemoglobin A1c, and 1,5‐anhydroglucitol in over 2000 patients with type 2 diabetes. J Clin Endocrinol Metab 2009; 94: 1689–1694 [DOI] [PubMed] [Google Scholar]
- 11.Ziemer DC, Kolm P, Weintraub WS, et al Glucose‐independent, black‐white differences in hemoglobin A1c levels: a cross‐sectional analysis of 2 studies. Ann Intern Med 2010; 152: 770–777 [DOI] [PubMed] [Google Scholar]
- 12.Beutler E, West C. Hematologic differences between African‐Americans and whites: the roles of iron deficiency and alpha‐thalassemia on hemoglobin levels and mean corpuscular volume. Blood 2005; 106: 740–745 [DOI] [PMC free article] [PubMed] [Google Scholar]
- 13.Perry GS, Byers T, Yip R, et al Iron nutrition does not account for the hemoglobin differences between blacks and whites. J Nutr 1992; 122: 1417–1424 [DOI] [PubMed] [Google Scholar]
- 14.Reed WW, Diehl LF. Leukopenia, neutropenia, and reduced hemoglobin levels in healthy American blacks. Arch Intern Med 1991; 151: 501–505 [PubMed] [Google Scholar]
- 15.Johnson‐Spear MA, Yip R. Hemoglobin difference between black and white women with comparable iron status: justification for race‐specific anemia criteria. Am J Clin Nutr 1994; 60: 117–121 [DOI] [PubMed] [Google Scholar]
- 16.Pani LN, Korenda L, Meigs JB, et al Effect of aging on A1C levels in individuals without diabetes: evidence from the Framingham Offspring Study and the National Health and Nutrition Examination Survey 2001‐2004. Diabetes Care 2008; 31: 1991–1996 [DOI] [PMC free article] [PubMed] [Google Scholar]
- 17.Behan KJ. Cessation of menstruation improves the correlation of FPG to hemoglobin A1c in Caucasian women. Clin Lab Sci 2006; 19: 225–230 [PubMed] [Google Scholar]
- 18.Hashimoto Y, Futamura A, Ikushima M. Effect of aging on HbA1c in a working male Japanese population. Diabetes Care 1995; 18: 1337–1340 [DOI] [PubMed] [Google Scholar]
- 19.Ravikumar P, Bhansali A, Walia R, et al Alterations in HbA(1c) with advancing age in subjects with normal glucose tolerance: Chandigarh Urban Diabetes Study (CUDS). Diabet Med 2011; 28: 590–594 [DOI] [PubMed] [Google Scholar]
- 20.Yates AP, Laing I. Age‐related increase in haemoglobin A1c and fasting plasma glucose is accompanied by a decrease in beta cell function without change in insulin sensitivity: evidence from a cross‐sectional study of hospital personnel. Diabet Med 2002; 19: 254–258 [DOI] [PubMed] [Google Scholar]


