Abstract
Here we introduce a form of chromatography that can be imposed on the membrane of a living cell. A cell–cell signaling interaction is reconstituted in a hybrid live cell-supported membrane junction. The chromatographic material consists of a hexagonally ordered array of gold nanoparticles (nanodot array), which is fabricated onto the underlying substrate. While individual membrane components move freely throughout the array, the movement of larger assemblies is impeded if they exceed the physical dimensions of the array. This tactile approach to probing membrane structures in living cells reveals organizational aspects of the membrane environment unobservable by other techniques.
Keywords: Membrane, cluster chromatography, T cell receptor, nanodot array
Cell membranes exist in a highly organized liquid state. The dynamic assembly of proteins and lipids into functional supramolecular structures within the membrane plays a foundational role in many signaling systems.1 Although these facts are well-accepted at a general level, the physical properties of membrane substructures along with the details of how spatial organization is tied to function remain enigmatic. This is largely the result of substantial limitations to the application of optical microscopy at length scales below the ∼250 nm diffraction limit. Fluorescence-based super-resolution,2−4 tracking,5 and time correlation techniques6,7 are beginning to probe smaller length scales. Even so, imaging alone may never be sufficient to fully reveal the dynamic physical nature of cell membranes. Supported membranes embedded with nanodot arrays,8 which we apply here to probe T cell receptor (TCR) microclusters9−12 in T cell membranes, represent a tactile approach to probing membrane structures in living cells. They reveal information that is distinct from optical methods and can expose physical aspects of the membrane environment unobservable by other techniques.
Cellular signal transduction often involves assembly of molecules into organized structures on the cell membrane.1,13,14 The TCR microcluster, which is the functional module for antigen recognition by T cells, is a prototypical example. Similar assemblies are emerging in other juxtacrine signaling systems, such as the Eph receptor tyrosine kinases.15−17 These signaling clusters occupy a size regime of tens to a few hundred nanometers and thus typically lurk below the diffraction limit of conventional optical microscopy. As such, direct information about their physical characteristics is limited.
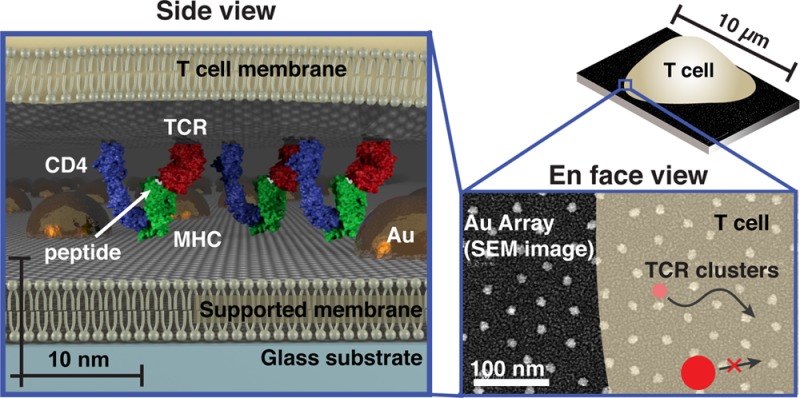
Supported membranes functionalized with intercellular adhesion molecule-1 (ICAM-1) and peptide-loaded major histocompatibility complex (pMHC) proteins can effectively replace the antigen-presenting cell (APC) to form a hybrid immunological synapse with a living T cell.18 As TCR on the T cell engage their antigen pMHC ligands on the supported membrane, they assemble into signaling microclusters,9−12 which indirect estimates suggest range in size from 70 to 500 nm9,19 (Supplementary Table S1). Within a matter of seconds after formation, the TCR microclusters become coupled to actin retrograde flow and are centripetally transported to the center of the junction to form the classical immunological synapse.11,20,21 Physical structures, such as patterns of metal lines or arrays of gold nanodots (described here), can be fabricated onto the underlying substrate to define geometric restrictions on molecular transport in the supported membrane.8,22 These substrate-imposed constraints are selectively transmitted to the living cell through receptor–ligand interactions to induce what we refer to as a spatial mutation.17,23,24 In the case of the nanodot array, TCR cluster transport is impeded if the clusters are too large to percolate between individual nanoparticles in the array (Figure 1).
Figure 1.
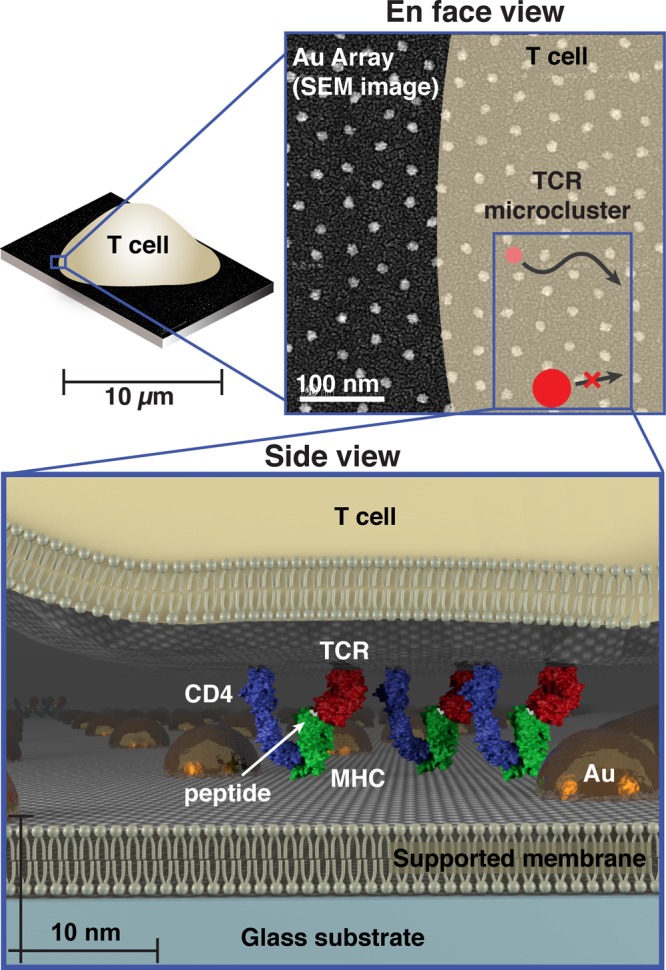
Schematic of cell membrane chromatography on nanodot arrays. (Top) Scanning electron micrograph of an array with 40 nm spacing superimposed with a schematic of a T cell outline and TCR signaling microclusters. TCR microclusters smaller than the spacing exhibit no restriction in centripetal transport, while the transport of larger microclusters is impeded. (Bottom) 3D scale schematic of a T cell interaction with a functionalized supported membrane containing an embedded nanodot array. TCR (red) on the live cell interacting with pMHC (green) molecules is illustrated. Intermembrane spacing between the T cell and supported membrane within TCR microclusters is much closer than elsewhere in the cell. Other TCR microcluster proteins, such as CD4 (blue), may also interact with the nanodot array. These specific interactions allow the array to probe physical properties within the living T cell membrane.
Most applications of the supported membrane spatial mutation to date have relied on electron-beam lithography to pattern the substrate.17,20,23−35 While this fabrication method can achieve the necessary spatial resolution (tens of nanometers) for cellular experiments, it is prohibitively slow and expensive for many applications. Here we employ a relatively straightforward method of block copolymer nanolithography to produce ordered arrays of gold nanoparticles (5–10 nm diameter) with highly controlled (relative standard deviation <20%) interparticle spacings ranging from 40 to 180 nm (Supplementary Figures S1 and S2).8,25−28 Interparticle spacings are controlled by the deposition and the specific polymers used in the gold micelle solution (Supplementary Table S2). Nanodot arrays can be readily fabricated over cm2 areas, and supported membranes subsequently assembled on the substrate exhibit free mobility (D ∼ 1 μm2/s)8,200 throughout the array (Supplementary Figure S3).
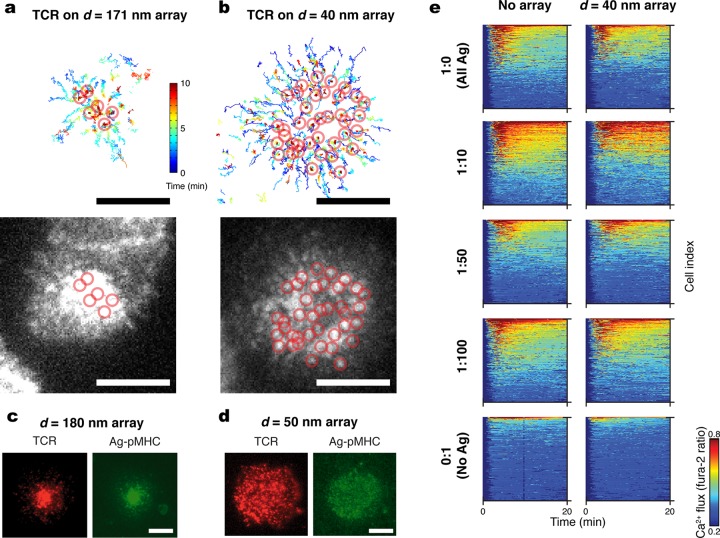
Nanodot arrays differentially restrict long-range transport of TCR microclusters as a function of the interparticle spacing within the array. TCR on primary AND T cells were labeled with a fluorescent anti-TCR H57 fab fragment, which does not interfere with pMHC-TCR binding.9 As TCR engage pMHC loaded with activating agonist peptide moth cytochrome C (MCC; ANERADLIAYLKQATK) in the supported membrane, signaling clusters form, and their movement was tracked on live cells by total internal reflection fluorescence (TIRF) microscopy (Figure 2a and b). On a 171 nm spaced array with an average agonist pMHC density of 80 molecules/μm2 (Supplementary Figure 4), most TCR clusters successfully percolate through the array. The final positions of continuously tracked clusters are circled on both the track plot (top) and final frame (bottom) in Figure 2a. On a 40 nm array with the same agonist pMHC density, clusters exhibit some centripetal transport but most become trapped while still in peripheral positions (Figure 2b). In general, agonist pMHC is observed to colocalize with TCR, irrespective of whether they are freely moving or trapped (Figure 2c, d and Supplementary Figure S5). Leukocyte function associated antigen-1 (LFA-1) bound to ICAM-1 can still form a ring pattern, as is characteristic in a mature immunological synapse (Supplementary Figure S6). This suggests that LFA-1:ICAM-1 complexes are less affected by the physical constraints imposed by the nanodot arrays. In addition to the larger lateral size of TCR microclusters, as compared with LFA-1:ICAM-1 clusters,29 the closer apposition of the two cell membranes dictated by the short length of the pMHC:TCR complex30−32 is likely to also contribute (see, for example, Figure 1).
Figure 2.
Signaling cluster chromatography of live T cell membranes. (Top a,b) Individual trajectories of TCR microclusters in cells interacting with supported membranes containing nanodot arrays of (a) 171 nm or (b) 40 nm spacing. Color bar represents elapsed time (0–10 min). Open circles indicate final positions. (Bottom a,b) TIRF images of the cells after 10 min. (c, d) Epifluorescence images of TCR (red) on cells interacting with pMHC (green) presented on a SLB studded with 180 nm spacing (c) or 50 nm spaced (d) arrays. (e) Intracellular Ca2+ flux for cells presented with varying ratios of agonist (ag) to null peptide presented by pMHC on SLBs with or without the nanodot array; nanodot arrays do not interfere with T cell triggering. Scale bars: 5 μm.
Although the 40 nm spaced nanodot array impedes long-range transport of TCR clusters, no significant interference with signaling function was observed (Supplementary Discussion 1). To quantitatively characterize the antigen specific triggering of T cells, we monitor intracellular Ca2+ flux using a Fura-2 dye reporter24 while titrating the ratio of agonist peptide to a null peptide (T102E) at constant total pMHC density (80 molecules/μm2). Null peptide-pMHC alone does not induce TCR triggering. The Ca2+ concentration (colorimetric scale) is plotted for each cell (y-axis) as a function of time (x-axis) (Supplementary Figure S7) for at least 350 cells per condition in Figure 2e. Agonist–null ratios from 1:0 to 1:100 all lead to comparable Ca2+ response in T cells on or off the arrays. When no agonist peptide is present, essentially no Ca2+ response is observed in either case.
T cells can respond to fewer than 10 individual agonist peptides.24,33,201 However, morphological characterization of the immunological synapse and TCR signaling cluster phenomena is often performed at agonist pMHC densities in the range of 2000–15000 per cell.10,18 Little is known about how the physical properties of TCR signaling clusters scale with antigen density or even if stable TCR clusters exist at the lowest level of antigens that can lead to T cell triggering.11,24 This is especially important given that, under most physiological conditions, antigen is present on cell surfaces at extremely low levels. Here we apply the nanodot array chromatographic strategy to probe the physical properties of TCR signaling clusters as a function of antigen density.
To ensure homogeneous distribution of monomeric pMHC on the supported membrane, proteins are tethered via polyhistidine linkage to nickel-chelating lipids within a background of 1,2-dioleoylphosphotidylcholine (DOPC) lipids.202 This strategy does not lead to preclustering, as is clearly indicated by direct single molecule imaging of peptide-labeled pMHC complexes in supported membranes (Figure 3 and Supplementary Figure S8). We note that GPI-linked pMHC, which was used in a number of earlier studies,23,35,34 has been shown to exhibit self-clustering tendencies in supported membranes11,24 (Supplementary Discussion 2).
Figure 3.
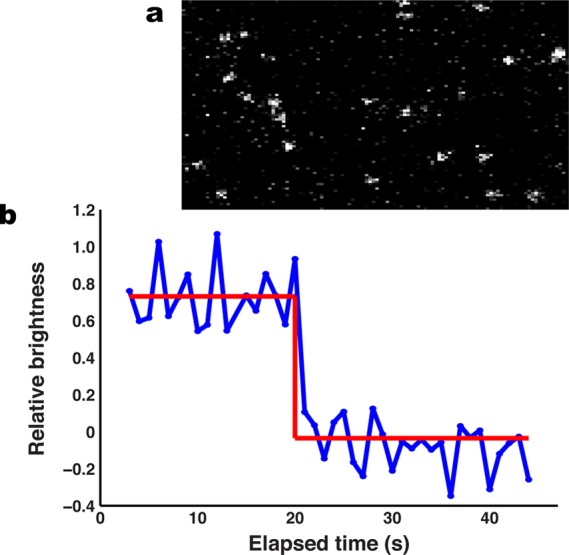
MHC linked via Ni-NTA lipids to the supported membrane are not preclustered. (a) TIRF image of a bilayer presenting MHC loaded with Atto647N-labeled MCC(C). (b) Collection of single molecule traces for individual pMHC molecules. The red line denotes intensity levels detected using a Bayesian change point technique7 and a Bayes Factor of 25. Data were collected at 17.5 ms intervals. Discrete single-step photobleaching observed for all molecules indicates that the pMHC exists ∼100% as a monomer.
The relative frustration of TCR cluster transport induced by the nanodot array can be quantified using a radial profile analysis as depicted in Figure 4. The measured TCR density is converted into a normalized radial probability distribution. We compute the variance, σ2, of the symmetrized probability distribution to provide a scalar measure of the degree of frustration (Methods in the Supporting Information). In an uninhibited immunological synapse, the radial transport of TCR toward the geometric center of the junction leads to low variance while a completely frustrated system exhibits high variance. This analysis allows comparison of cells as well as analysis of cell–cell variation within an ensemble unbiased by labeling efficiency or cell size.
Figure 4.
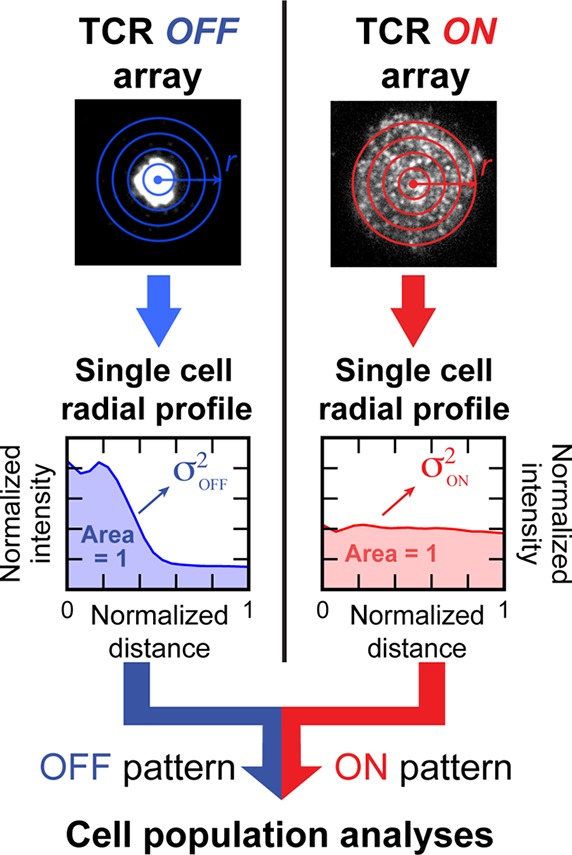
Schematic of the quantitative analysis method. Normalized radial intensity profile of the TCR image (radial probability distribution for TCR) for each cell off or on the array in the same sample. Variance of the distribution, which corresponds with the degree to which TCR transport is frustrated, was calculated for each profile generated. Population level analyses are performed thereafter.
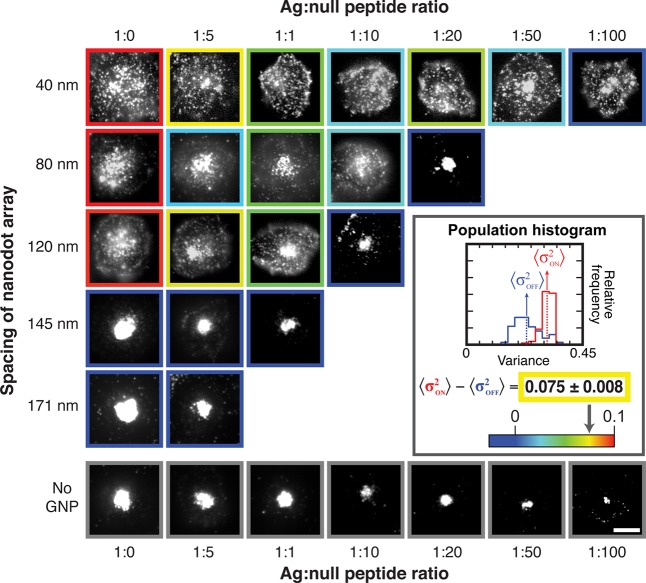
Results from a two-dimensional titration experiment in which antigen density and nanodot array spacing are independently varied are illustrated in Figure 5. As before, the total pMHC density is fixed at ∼80 molecules/μm2, and the ratio of agonist to null peptide is titrated. Five different nanodot array spacings, ranging from 40 to 171 nm, as well as unpatterned membranes were examined, and a minimum of 39 cells was analyzed for each combination of conditions. Representative images with color-coded borders corresponding to population average data (see inset and Supplementary Figure S9) are depicted in matrix layout in Figure 5. As antigen is titrated to lower densities, the TCR clusters are able to percolate through progressively smaller nanodot arrays. Appreciable TCR transport was observed even on the 40 nm spaced arrays at agonist–null peptide ratios of 1:50 and below. These data reveal that the effective size of TCR signaling clusters varies continuously with antigen density and that functional signaling clusters readily percolate through 40 nm spaced arrays at low antigen density.
Figure 5.
TCR microcluster chromatography with the titration of nanodot spacing and ag–null peptide ratios. Cells are fixed 20 min after contact with the SLB according to the indicated conditions, and epifluorescent images of TCR are shown. (Inset) The distribution of variance was plotted in a histogram for the cell population. The degree of TCR cluster centripetal transport is quantified as the difference between the population variance on and off the array, and the calculated value is represented as the colored borders around each TCR image.
Structural studies of TCR and CD4 simultaneously bound to pMHC suggest that the lateral size of this complex in the T cell membrane is ∼10 nm in diameter.36 Additionally, TCR–pMHC complexes require relatively close apposition of the two membranes.30 Thus, the ∼10 nm high nanodots may sterically interact with other proteins associated with the TCR signaling cluster (see the scale schematic in Figure 1). As such, the physical footprint of the TCR cluster in the T cell membrane, more so than just the bound pMHC ligands in the supported membrane, is likely to define the effective cluster size as determined by percolation through the nanodot array. In support of this conclusion, we note observations of distinctly different behavior in a juxtacrine signaling system (ephrinA1–EphA2) that has a larger intercellular spacing (∼21 nm,38Supplementary Figure S10). In a hybrid live cell supported membrane junction, ephrinA1–EphA2 form signaling clusters that exhibit lateral transport in a manner reminiscent of TCR signaling clusters.17,25,42 However, transport of EphA2 clusters is not impeded by the nanodot array, even when the clusters are visibly larger than the array spacing.25 The EphA2 clusters appear to be able to pass over the nanodot array. Only when some of the ephrinA1 ligand is directly affixed to the gold nanodots is any impedance imposed on the EphA2 clusters.
If TCR complexes within a cluster are assumed to pack in a rough lattice with a 10 nm unit cell, a cluster with ∼10 TCR would have a diameter of ∼30 nm and might therefore be expected to percolate through the array. The useable space between nanoparticles in the array is less than the interparticle spacing (e.g., ∼30 nm for the 40 nm array, accounting for the nanoparticle size itself). Nanodot array chromatography does not necessarily provide a direct caliper for the size of the TCR cluster since other properties, such as the dynamics of the TCR cluster, are naturally convolved with the percolation measurement. Nevertheless, this type of ambiguity is inherent to essentially all forms of size chromatography without significantly reducing their utility.
Collective consideration of results from the experiments described here reveals the physical nature of the TCR signaling cluster to be distinctly dependent on the amount of antigen encountered by the cell. At high antigen densities, they reach sizes that exhibit difficulty percolating through supported membrane-embedded nanodot arrays with interparticle spacings as large as 120 nm. At lower antigen densities, but still well above the threshold for triggering intracellular Ca2+ flux, TCR clusters can move through nanodot arrays with interparticle spacings as small as 30 nm. At these lower antigen densities, TCR clusters appear to be small (<10 TCR), flexible, or dynamic. This observation necessitates a reconsideration of the concept of a TCR signaling cluster to account for such antigen-dependent variability. Downstream signaling reactions within the TCR cluster must either be independent of these physical properties or perhaps regulated by them. The supported membrane-embedded nanodot array platform provides a physical means to both probe and manipulate membrane assemblies, such as the TCR signaling cluster, while they are functioning in the membrane of a living cell.
Acknowledgments
We thank Dr. Rafal Pielak, Dr. Alexander Smoligovets, Jenny Lin, and Dr. Aiwei Tian for technical assistance and discussion. Research reported in this publication was supported by the National Institute of Allergy and Infectious Diseases (NIAID), Award Number PO1 AI091580. The content is solely the responsibility of the authors and does not necessarily represent the official views of the National Institutes of Health. N.F. was supported in part by a National Science Foundation (NSF) predoctoral fellowship. T.L. was supported, in part, by a postdoc fellowship from the Deutsche Forschungsgemeinschaft (DFG).
Glossary
Abbreviations
- TCR
T cell receptor
- LFA-1
leukocyte function associated antigen-1
- ICAM-1
intercellular adhesion molecule-1
- pMHC
peptide-loaded major histocompatibility complex
- APC
antigen-presenting cell
- RICM
reflection interference contrast microscopy
- TIRF
total internal reflection fluorescence
Supporting Information Available
Details on the materials and methods, additional discussion on TCR microcluster size, and analyses of the nanodot array spacing, supported membrane fluidity, nonclustered state of pMHC prior to TCR binding, and cluster chromatography data. This material is available free of charge via the Internet at http://pubs.acs.org.
Author Present Address
Y.Y.: Department of Chemistry, Indiana University, Bloomington, Indiana 47405, United States.
Author Present Address
T.L.: Department für Physik and CeNS, Ludwig-Maximilians-Universität München, München, Germany.
Author Contributions
N.G.C., H.K., and E.Y.L. contributed equally to this work.
The authors declare no competing financial interest.
Funding Statement
National Institutes of Health, United States
Supplementary Material
References
- Groves J. T.; Kuriyan J. Nat. Struct. Mol. Biol. 2010, 17, 659–665. [DOI] [PMC free article] [PubMed] [Google Scholar]
- Betzig E.; Patterson G. H.; Sougrat R.; Lindwasser O. W.; Olenych S.; Bonifacino J. S.; Davidson M. W.; Lippincott-Schwartz J.; Hess H. F. Science 2006, 313, 1642–1645. [DOI] [PubMed] [Google Scholar]
- Rust M. J.; Bates M.; Zhuang X. Nat. Methods 2006, 3, 793–796. [DOI] [PMC free article] [PubMed] [Google Scholar]
- Hell S. W.; Wichmann J. Opt. Lett. 1994, 19, 780–782. [DOI] [PubMed] [Google Scholar]
- Kusumi A.; Shirai Y. M.; Koyama-Honda I.; Suzuki K. G. N.; Fujiwara T. K. FEBS Lett. 2010, 584, 1814–1823. [DOI] [PubMed] [Google Scholar]
- Lasserre R.; Guo X.-J.; Conchonaud F.; Hamon Y.; Hawchar O.; Bernard A.-M.; Soudja S. M.; Lenne P.-F.; Rigneault H.; Olive D.; Bismuth G.; Nunès J. A.; Payrastre B.; Marguet D.; He H.-T. Nat. Chem. Biol. 2008, 4, 538–547. [DOI] [PubMed] [Google Scholar]
- Slaughter B. D.; Schwartz J. W.; Li R. Proc. Natl. Acad. Sci. 2007, 104, 20320–20325. [DOI] [PMC free article] [PubMed] [Google Scholar]
- Lohmüller T.; Triffo S.; O’Donoghue G. P.; Xu Q.; Coyle M. P.; Groves J. T. Nano Lett. 2011, 11, 4912–4918. [DOI] [PMC free article] [PubMed] [Google Scholar]
- Campi G.; Varma R.; Dustin M. L. J. Exp. Med. 2005, 202, 1031–1036. [DOI] [PMC free article] [PubMed] [Google Scholar]
- Yokosuka T.; Sakata-Sogawa K.; Kobayashi W.; Hiroshima M.; Hashimoto-Tane A.; Tokunaga M.; Dustin M. L.; Saito T. Nat. Immunol. 2005, 6, 1253–1262. [DOI] [PubMed] [Google Scholar]
- Dustin M. L.; Groves J. T. Annu. Rev. Biophys. 2012, 41, 543–556. [DOI] [PMC free article] [PubMed] [Google Scholar]
- Schamel W. W. A.; Alarcón B. Immunol. Rev. 2013, 251, 13–20. [DOI] [PubMed] [Google Scholar]
- Shi Y.; Massagué J. Cell 2003, 113, 685–700. [DOI] [PubMed] [Google Scholar]
- Cho W. Sci. STKE 2006, 2006, pe7–pe7. [DOI] [PubMed] [Google Scholar]
- Janes P. W.; Griesshaber B.; Atapattu L.; Nievergall E.; Hii L. L.; Mensinga A.; Chheang C.; Day B. W.; Boyd A. W.; Bastiaens P. I.; Jorgensen C.; Pawson T.; Lackmann M. J. Cell Biol. 2011, 195, 1033–1045. [DOI] [PMC free article] [PubMed] [Google Scholar]
- Seiradake E.; Harlos K.; Sutton G.; Aricescu A. R.; Jones E. Y. Nat. Struct. Mol. Biol. 2010, 17, 398–402. [DOI] [PMC free article] [PubMed] [Google Scholar]
- Salaita K.; Nair P. M.; Petit R. S.; Neve R. M.; Das D.; Gray J. W.; Groves J. T. Science 2010, 327, 1380–1385. [DOI] [PMC free article] [PubMed] [Google Scholar]
- Grakoui A.; Bromley S. K.; Sumen C.; Davis M. M.; Shaw A. S.; Allen P. M.; Dustin M. L. Science 1999, 285, 221–227. [PubMed] [Google Scholar]
- Lillemeier B. F.; Mortelmaier M. A.; Forstner M. B.; Huppa J. B.; Groves J. T.; Davis M. M. Nat. Immunol. 2010, 11, 90–96. [DOI] [PMC free article] [PubMed] [Google Scholar]
- Manz B. N.; Groves J. T. Nat. Rev. Mol. Cell Biol. 2010, 11, 342–352. [DOI] [PMC free article] [PubMed] [Google Scholar]
- Yu Y.; Fay N. C.; Smoligovets A. A.; Wu H.-J.; Groves J. T. PLoS ONE 2012, 7, e30704. [DOI] [PMC free article] [PubMed] [Google Scholar]
- Groves J. T.; Ulman N.; Boxer S. G. Science 1997, 275, 651–653. [DOI] [PubMed] [Google Scholar]
- Mossman K. D.; Campi G.; Groves J. T.; Dustin M. L. Science 2005, 310, 1191–1193. [DOI] [PubMed] [Google Scholar]
- Manz B. N.; Jackson B. L.; Petit R. S.; Dustin M. L.; Groves J. Proc. Natl. Acad. Sci. 2011, 108, 9089–9094. [DOI] [PMC free article] [PubMed] [Google Scholar]
- DeMond A. L.; Mossman K. D.; Starr T.; Dustin M. L.; Groves J. T. Biophys. J. 2008, 94, 3286–3292. [DOI] [PMC free article] [PubMed] [Google Scholar]
- Lohmüller T.; Xu Q.; Groves J. T. Nano Lett. 2013, 13, 3059–3064. [DOI] [PMC free article] [PubMed] [Google Scholar]
- Deeg J.; Axmann M.; Matic J.; Liapis A.; Depoil D.; Afrose J.; Curado S.; Dustin M. L.; Spatz J. P. Nano Lett. 2013, 13, 5619–5626. [DOI] [PMC free article] [PubMed] [Google Scholar]
- Matic J.; Deeg J.; Scheffold A.; Goldstein I.; Spatz J. P. Nano Lett. 2013, 13, 5090–5097. [DOI] [PMC free article] [PubMed] [Google Scholar]
- Delcassian D.; Depoil D.; Rudnicka D.; Liu M.; Davis D. M.; Dustin M. L.; Dunlop I. E. Nano Lett. 2013, 13, 5608–5614. [DOI] [PMC free article] [PubMed] [Google Scholar]
- Lin W.-C.; Yu C.-H.; Triffo S.; Groves J. T. In Current Protocols in Chemical Biology; Arkin A. P., Mahal L., Romesberg F., Shah K., Shamu C., Thomas C., Eds.; John Wiley & Sons, Inc.: Hoboken, NJ, USA, 2010. [Google Scholar]
- Hartman N. C.; Nye J. A.; Groves J. T. Proc. Natl. Acad. Sci. 2009, 106, 12729–12734. [DOI] [PMC free article] [PubMed] [Google Scholar]
- Choudhuri K.; Wiseman D.; Brown M. H.; Gould K.; van der Merwe P. A. Nature 2005, 436, 578–582. [DOI] [PubMed] [Google Scholar]
- Newell E. W.; Ely L. K.; Kruse A. C.; Reay P. A.; Rodriguez S. N.; Lin A. E.; Kuhns M. S.; Garcia K. C.; Davis M. M. J. Immunol. 2011, 186, 5823–5832. [DOI] [PMC free article] [PubMed] [Google Scholar]
- James J. R.; Vale R. D. Nature 2012, 487, 64–69. [DOI] [PMC free article] [PubMed] [Google Scholar]
- Irvine D. J.; Purbhoo M. A.; Krogsgaard M.; Davis M. M. Nature 2002, 419, 845–849. [DOI] [PubMed] [Google Scholar]
- O’Donoghue G. P.; Pielak R. M.; Smoligovets A. A.; Lin J. J.; Groves J. T. eLife 2013, . [DOI] [PMC free article] [PubMed] [Google Scholar]
- Nye J. A.; Groves J. T. Langmuir 2008, 24, 4145–4149. [DOI] [PubMed] [Google Scholar]
- Varma R.; Campi G.; Yokosuka T.; Saito T.; Dustin M. L. Immunity 2006, 25, 117–127. [DOI] [PMC free article] [PubMed] [Google Scholar]
- Yin Y.; Wang X. X.; Mariuzza R. A. Proc. Natl. Acad. Sci. 2012, 109, 5405–5410. [DOI] [PMC free article] [PubMed] [Google Scholar]
- Himanen J. P.; Yermekbayeva L.; Janes P. W.; Walker J. R.; Xu K.; Atapattu L.; Rajashankar K. R.; Mensinga A.; Lackmann M.; Nikolov D. B.; Dhe-Paganon S. Proc. Natl. Acad. Sci. 2010, 107, 10860–10865. [DOI] [PMC free article] [PubMed] [Google Scholar]
- Xu Q.; Lin W.-C.; Petit R. S.; Groves J. T. Biophys. J. 2011, 101, 2731–2739. [DOI] [PMC free article] [PubMed] [Google Scholar]
Associated Data
This section collects any data citations, data availability statements, or supplementary materials included in this article.


