

Abstract
Objectives. We evaluated capacity built and outcomes achieved from September 1, 2009, to December 31, 2011, by 51 health departments (HDs) funded through the American Recovery and Reinvestment Act (ARRA) for health care–associated infection (HAI) program development.
Methods. We defined capacity for HAI prevention at HDs by 25 indicators of activity in 6 categories: staffing, partnerships, training, technical assistance, surveillance, and prevention. We assessed state-level infection outcomes by modeling quarterly standardized infection ratios (SIRs) for device- and procedure-associated infections with longitudinal regression models.
Results. With ARRA funds, HDs created 188 HAI-related positions and supported 1042 training programs, 53 surveillance data validation projects, and 60 prevention collaboratives. All states demonstrated significant declines in central line–associated bloodstream and surgical site infections. States that implemented ARRA-funded catheter-associated urinary tract infection prevention collaboratives showed significantly greater SIR reductions over time than states that did not (P = .02).
Conclusions. ARRA–HAI funding substantially improved HD capacity to reduce HAIs not targeted by other national efforts, suggesting that HDs can play a critical role in addressing emerging or neglected HAIs.
Health care–associated infections (HAIs) are an increasingly recognized cause of preventable morbidity and mortality.1,2 Since 2008, the Department of Health and Human Services (DHHS) has committed substantial resources toward prevention of HAIs. This commitment resulted in the DHHS Action Plan to Prevent HAIs, which identified key strategies to achieve and sustain progress in protecting patients from infections.3 Funding to health departments to carry out this plan came from the American Recovery and Reinvestment Act (ARRA) of 2009. The Epidemiology and Laboratory Capacity Program of the Centers for Disease Control and Prevention (CDC) distributed these funds, granting approximately $35.8 million for state-level capacity building for HAI prevention programs (ARRA–HAI) to 51 health departments in 49 states, the District of Columbia, and Puerto Rico.4
The DHHS Action Plan emphasized aligning and coordinating HAI stakeholder efforts, promoting standardized metrics for HAI surveillance, and targeting reduction of device-associated, procedure-associated, and multidrug-resistant HAIs. The goal of ARRA–HAI funding was to enhance the role of state and territorial health departments in executing the Action Plan goals through allocation of funds in 3 domains: infrastructure, surveillance, and prevention. The CDC reviewed applications and distributed funds competitively. Health departments applied for a total of $66 230 990 and received $35 800 000 in Epidemiology and Laboratory Capacity funding; all health departments that applied received some funding. The average award was $210 000 for the 17 health departments that received funding only for infrastructure, $630 000 for the 12 health departments that received funding for 2 of the 3 domains, and $1.1 million for the 22 health departments that received funding for all 3 domains. Most health departments with little to no engagement in HAI activities at the time applications were filed (July 2009) received funds only for infrastructure. Conversely, health departments with more active HAI programs applied to enhance existing infrastructure in addition to proposing surveillance and prevention activities (Figure 1).
FIGURE 1—
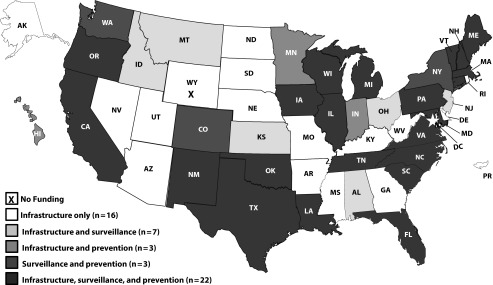
Distribution of American Recovery and Reinvestment Act funding to 51 state and territorial health departments among infrastructure, surveillance, and prevention funding domains, 2009–2011.
The CDC developed a conceptual program model that guided the evaluation and served as the basis for expectations related to health department performance.5 Health departments awarded funding for infrastructure (n = 48) were expected to dedicate staff time to HAI activities, promote strategic partnerships through regular assembly of a multidisciplinary advisory group of HAI stakeholders, and provide training and technical assistance to health care facilities regarding HAIs. Those awarded funding for surveillance (n = 31) were expected to enhance the quality of HAI surveillance through the National Healthcare Safety Network (NHSN) Surveillance System and to work toward active use of NHSN data to inform decision-making and motivate prevention. The 28 health departments awarded funds for prevention collaborative implementation were expected to lead or support multifacility prevention initiatives targeting HAI reductions through systematic implementation of evidence-based practices, data feedback, and culture change strategies.6
We assessed capacity built (i.e., breadth of engagement in key HAI activities) and outcomes achieved (i.e., statewide HAI reductions) from September 1, 2009, to December 31, 2011, by the 51 health departments that received ARRA–HAI funding. The purpose of a systematic evaluation was to enhance accountability for federal dollars spent, assist states in monitoring progress, and inform future planning for state HAI programs. We determined health department capacity at baseline and at the end of the ARRA funding period. We aimed to (1) describe capacity enhancements achieved with ARRA–HAI funding, (2) examine the role of baseline capacity and size of funding award in predicting capacity enhancements achieved with ARRA–HAI funding, and (3) assess whether states with health departments that funded infection-specific prevention collaboratives achieved greater HAI reductions during the ARRA funding period than states that did not.
METHODS
We organized capacity enhancements achieved by health departments with ARRA–HAI funds by activity and ascribed them measurable indicators of progress. Each indicator contributed 1 point to a 25-point capacity enhancement score (Appendix A, available as a supplement to this article at http://www.ajph.org). The 6 activity categories were staffing (5 points), strategic partnerships (3 points), training (4 points), technical assistance (4 points), data quality and use (5 points), and prevention collaborative support (4 points). Most indicators were dichotomous (0 or 1), and we grouped indicators with continuous values by quartile and then scaled them to 1 point (e.g., 0.25 points for the lowest quartile, 0.5 points for the second quartile, etc.). Data sources included a structured questionnaire completed by the HAI coordinator at each health department at the end of the funding period and quarterly progress reports. Of the 25 indicators, 10 related most closely to the goals specified for infrastructure, 8 to surveillance goals, and 7 to prevention goals.
Because health departments could conceivably engage in activities across all 3 funding domains regardless of funding status, we evaluated all 51 health departments on the same 25-point scale for capacity enhancement. To assess differences in health department capacity improvements by type of funding distributed, we conducted an analysis of variance to test statistical differences in the mean ARRA–HAI capacity score for health departments funded for infrastructure only versus those funded in 2 of the 3 domains versus those funded in all 3 domains.
Baseline Capacity and Funding
To retrospectively quantify baseline capacity for each health department, we reviewed, abstracted, and coded funding applications. Applications included background, needs, and scope of HAI activities. Two abstractors reviewed the project narratives for each application. The abstractors, who were trained with abstraction protocols and supervised through regular team meetings, extracted any text related to program capacity, categorized text into broad predetermined categories, and entered text into a database. The evaluation team—comprising a behavioral scientist, an epidemiologist, a program evaluator, a physician economist, and a public health graduate student—qualitatively coded the database and constructed a standardized database of variables describing baseline capacity. Two members of the evaluation team read each abstracted section and ascribed codes to characterize baseline capacity. We resolved discrepancies between the 2 reviewers in the coding of free text by consensus of the entire evaluation team. We constructed the baseline capacity score from 12 indicators and 5 activity categories: staffing, strategic partnerships, training, data quality and use, and prevention collaborative support (Appendix B, available as a supplement to this article at http://www.ajph.org). We abstracted funding allocation amounts from CDC program administration databases.
We used multivariable linear regression models to examine whether baseline capacity and funding award amount predicted capacity enhancement after the ARRA–HAI period. We assessed ARRA–HAI capacity enhancement (25-point scale) immediately after the end of the funding period, modeled as a continuous variable. We entered baseline capacity and ARRA funding amounts into the model as categorical variables, with the lowest quartile as the reference group (Table 1). We built separate models to assess the independent effects of baseline capacity and ARRA funding award amount on infrastructure enhancements (10-point scale), surveillance enhancements (8-point scale) and prevention enhancements (7-point scale).
TABLE 1—
Health Department Capacity Enhancement Scores After American Recovery and Reinvestment Act Funding, Stratified by Baseline Composite Quartile and Funding Award Quartile, 2011
| Overall Capacity Enhancement Scorea |
Infrastructure Capacity Enhancement Scoreb |
Surveillance Capacity Enhancement Scorec |
Prevention Capacity Enhancement Scored |
|||||
| Variable | Mean (SD) | P | Mean (SD) | P | Mean (SD) | P | Mean (SD) | P |
| Baseline capacity score | ||||||||
| Quartile 1 (n = 13; Ref) | 13.54 (5.01) | 7.07 (1.43) | 3.08 (2.40) | 3.38 (2.75) | ||||
| Quartile 2 (n = 12) | 15.33 (5.31) | .6 | 6.83 (1.33) | .3 | 4.83 (2.37) | .09 | 3.67 (3.03) | > .999 |
| Quartile 3 (n = 14) | 17.91 (5.38) | .06 | 8.05 (0.89) | .04 | 5.29 (2.64) | .03 | 4.57 (2.77) | .6 |
| Quartile 4 (n = 12) | 20.48 (2.29) | .02 | 7.40 (0.97) | .9 | 7.33 (0.65) | < .001 | 5.75 (1.36) | .4 |
| ARRA funding amount, $ | ||||||||
| < 250 000 (n = 18; Ref) | 12.35 (5.05) | 6.74 (1.41) | 2.94 (2.36) | 2.67 (2.57) | ||||
| 250 000–750 000 (n = 13) | 16.75 (3.63) | .001 | 7.60 (1.05) | .01 | 5.15 (2.23) | .002 | 4.00 (2.94) | .1 |
| 750 001–1 250 000 (n = 13) | 20.06 (2.55) | < .001 | 7.52 (0.97) | .17 | 6.77 (1.42) | < .001 | 5.77 (1.30) | .005 |
| > 1 250 000 (n = 7) | 22.25 (1.62) | < .001 | 8.25 (0.79) | .006 | 7.42 (0.79) | < .001 | 6.57 (0.79) | .002 |
Note. ARRA = American Recovery and Reinvestment Act. P values derived from a multivariable regression model.
Range = 1–25.
Range = 1–10.
Range = 1–8.
Range = 1–7.
Changes in Standardized Infection Ratios
To quantify changes in device- and procedure-associated HAIs over the ARRA funding period, we calculated quarterly standardized infection ratios (SIRs) for central line–associated bloodstream infections (CLABSIs), catheter-associated urinary tract infections (CAUTIs), and surgical site infections (SSIs) with NHSN data. Using the SIR metric allows for a single measure of infection that is risk adjusted for location (for CLABSIs and CAUTIs) and for procedure-specific risks (for SSIs). The SIR is the ratio of observed infections to the number expected according to rates from a national reference period. Detailed methods for calculating the SIR are described elsewhere.7 Because we determined the SIRs for CLABSIs and SSIs according to the 2006 to 2008 national reference period, we calculated SIRs for every quarter from September 2009 to December 2011. Because the national reference period for CAUTIs was 2009, quarterly SIRs could be calculated for January 2010 through December 2011.
For each infection target, we calculated quarterly SIRs by pooling the expected and observed number of infections (1) across all states that implemented an infection-specific ARRA-funded collaborative and (2) across all states without an ARRA-funded collaborative for that particular infection target. For CLABSIs, CAUTIs, and SSIs, we modeled quarterly SIR trends and compared them through weighted linear regression. We used an interaction term to statistically assess differences in SIR trends between states with and without ARRA-funded prevention collaboratives. Finally, we ran robust mixed models allowing for a random intercept by state, which allowed states to assume distinct (rather than pooled) baseline SIRs; we reported results for both standard and random-intercept models. We also conducted sensitivity analyses adjusted for the impact of state reporting mandates, which theoretically could have an impact on SIR trends. We conducted all analyses with SAS version 9.2 (SAS Institute Inc, Cary, NC).
RESULTS
At baseline, 6 (11.8%) of the 51 health departments had a dedicated staff member to oversee HAI prevention work (an HAI coordinator), 22 (43.1%) had at least 1 staff member with some time dedicated to HAI work, 30 (58.8%) had assembled a committee to advise on HAI-related issues, and 10 (19.6%) had a state HAI plan in place (Appendix B). By the end of the ARRA–HAI funding period, all health departments had hired, designated, or retained an HAI coordinator, all had assembled HAI advisory groups, and all had written and submitted to DHHS a state plan for preventing HAIs in alignment with national HAI reduction goals (Appendix A). Nationally, health departments created a total of 188 new HAI-related positions.
Forty-six (91.2%) health departments used ARRA funds to conduct or support training on general infection control, infection-specific prevention (e.g., CLABSI, CAUTI, SSI, Clostridium difficile infection), and NHSN surveillance. A total of 1042 training events were attended by 12 260 representatives from hospitals, 5049 from long-term care, 1178 from ambulatory–outpatient centers, 1139 from state health departments, and 2342 from other settings, such as local health departments or other partner organizations. The majority (62.7%) of state health departments experienced some delay in hiring HAI coordinators; 25% of states had at least 6 months without a coordinator during the 28-month ARRA funding period (Appendix A).
In aggregate, health departments conducted 53 unique ARRA-funded validation studies for CLABSI (n = 24), SSI (n = 13), CAUTI (n = 5), methicillin resistant Staphylococcus aureus (n = 5), C. difficile (n = 4), and other infections (n = 2) reported to NHSN. At baseline, 33 (64.5%) health departments reported that prevention collaboratives were or had been active in the state, but health departments in only 2 states (3.9%) directly supported or were actively involved in prevention collaborative work. With ARRA–HAI funding, health departments led or supported 60 prevention collaboratives; of these collaboratives, 39 (65.0%) were reported to have been initiated with ARRA funds and 21 (35.0%) were expanded or enhanced with ARRA funds.
Capacity Enhancement
Post-ARRA scores for HAI capacity enhancement, calculated in early 2012 to coincide with the end of the ARRA–HAI funding period (December 31, 2011), ranged from 5 to 23 points on the 25-point scale. For health departments receiving infrastructure-only funding (n = 17), the mean score was 11.50 (SE = 4.370); for those receiving funding in 2 of the 3 domains (n = 12), the average capacity indicator score was 17.19 (SE = 3.69), and for those receiving funding in the infrastructure, surveillance, and prevention domains (n = 22), the average score was 20.67 (SE = 2.43). The differences in mean scores among these 3 groups were statistically significant (analysis of variance, P < .001).
Health departments with higher baseline capacity scores had higher overall ARRA–HAI capacity enhancement scores (Table 1). The correlation between baseline capacity quartile and funding quartile was significant (P = .001) but low enough (r2 = 0.196) to include both variables simultaneously in adjusted linear regression analyses to assess the independent impact of each variable. In multivariate models, both baseline capacity and funding award amount showed statistically significant relationships with ARRA–HAI capacity enhancements. In separate regression models examining ARRA capacity enhancements for each domain, funding award amount was statistically significantly associated with higher ARRA capacity scores for infrastructure, surveillance, and prevention. In these models, however, baseline capacity was a statistically significant predictor in the surveillance domain only.
Changes in Standardized Infection Ratios
Health department grantees used ARRA–HAI funds to initiate, enhance, or expand 16 CLABSI collaboratives, 11 CAUTI collaboratives, and 12 SSI collaboratives. SIRs for CLABSIs decreased significantly for the 13 states where health departments used ARRA–HAI funds for implementation of CLABSI collaboratives (P < .001) as well as those that did not use ARRA–HAI funds for CLABSI collaboratives (P < .001), and we detected no statistically significant difference in the rate of decrease over time (P = .1; Figure 2). Throughout the ARRA funding period, SSIs significantly declined (P = .01 for the 12 states where health departments implemented ARRA-funded SSI collaboratives; P < .001 for other states), with no difference in the rate of SSI decline between these 2 groups (P = .8). For CAUTIs, we observed a statistically significant decrease in SIRs over time for the 8 states where health departments implemented ARRA-funded CAUTI collaboratives (P = .02) but no decrease for the other states (P = .78); changes over time in SIRs were statistically significantly different for these 2 groups (P = .02).
FIGURE 2—

Observed (points) and model-predicted (lines) SIRs for (a) central line-associated bloodstream infections (CLABSI), (b) surgical site infections (SSI), and (c) catheter-associated urinary tract infections (CAUTI).
Note. ARRA = American Recovery and Reinvestment Act; SIR = standardized infection ratio.
The findings held when we used mixed models with random intercepts for states. In addition, findings held when we added a dichotomous term for state mandatory reporting to each of the infection-specific models. The P values for the models’ interaction terms, which quantified the differences in trends over time for these mixed models, were 0.08, 0.79, and 0.03 for CLABSIs, SSIs, and CAUTIs, respectively.
DISCUSSION
With ARRA–HAI funding, state and territorial health departments were able to enhance HAI-specific staffing, training, technical assistance, data quality and use, and support for prevention collaboratives. Our analysis of NHSN-generated SIRs for device- and procedure-associated infections throughout the ARRA funding period demonstrated that CLABSIs and SSIs decreased for all states, regardless of ARRA-funded CLABSI or SSI collaborative implementation. States where health departments implemented ARRA-funded CAUTI prevention collaboratives experienced a statistically significantly greater decrease in SIRs for CAUTIs over time than states without such collaboratives. This difference was likely a result of states having flexibility to set their own infection targets and to prioritize HAIs that had not been the focus of other prevention campaigns or collaboratives.
Prior to dissemination of ARRA funds, only 2 states had active CAUTI collaboratives or campaigns. Many states, however were actively participating in the Comprehensive Unit-Based Safety Program (CUSP)–CLABSI initiative. Other states reported that facilities were participating in SSI reduction campaigns, such as the World Health Organization’s Safe Surgery Saves Lives campaign. Nonsignificant differences for CLABSI and SSI trends related to prevention funding might reflect an abundance of national and regional prevention efforts, not related to ARRA, that targeted these infections during this same period.
State and territorial health department support of HAI prevention collaboratives was a key goal for the ARRA–HAI funding because of the growing evidence base for dramatic and sustained HAI reductions resulting from prevention collaboratives that emphasize health system change through surveillance, data feedback, systematic implementation of prevention measures, and intra- and interfacility collaboration.8–12 Health departments, particularly those that access NHSN data and use it to prioritize prevention collaborative activities, are uniquely positioned to assess and address HAI prevention.
Health departments receiving the smallest funding awards (for infrastructure only) averaged 11.50 on the post-ARRA capacity enhancement score, even though only 10 of the 25 indicators contributing to the score fell exclusively into the infrastructure-funding domain, suggesting that, on average, these health departments demonstrated capacity improvements beyond what was expected by expanding surveillance and prevention activities as well. These findings are important because they suggest that funding health departments with little existing infrastructure can still result in capacity enhancements. Whether these enhancements can be maintained beyond the ARRA period in health departments with little baseline infrastructure, however, remains in question.
Although health departments that received small awards demonstrated improvements, those that received larger awards had statistically significantly greater capacity enhancements across all funding domains, even after adjustment for baseline capacity. Having higher baseline capacity, however, was only significantly predictive of surveillance-related ARRA–HAI capacity enhancement, indicating that building robust NHSN surveillance at health departments is facilitated by existing infrastructure. This finding is important because it suggests that sustained infrastructure can be critical to maintaining and improving HAI surveillance at state and territorial health departments. Centralizing NHSN surveillance activities, including validation to enhance credibility of data, at state health departments is especially critical in states where health care facilities are required by law to submit HAI data to NHSN for public reporting.1,13 By contrast, capacity enhancements in the infrastructure and prevention domains were relatively unaffected by baseline capacity; this was likely because the ability to enhance infrastructure- and prevention-related capacity relied more on coordination, partnerships, and relationship building than on existing infrastructure.
These improvements in capacity allowed state health departments to assume a more prominent role in patient safety. For example, in the recent fungal meningitis outbreak, prompt responses from health departments were reported to be “invaluable in identifying and responding to the outbreak, and determining the cause resulting in product recall only eight days after initial notification, saving lives and limiting the number of patients administered the contaminated injections” in recent congressional testimony.14(panel III, p7) In Tennessee, 6 members of the HAI team were funded through Epidemiology and Laboratory Capacity funds, which were distributed through ARRA and subsequently through the Affordable Care Act; these staff members had the expertise to ask relevant questions, conduct on-site visits, create standardized investigation forms, and enter and analyze the data swiftly to determine the cause of the outbreak and who was at highest risk of getting sick.14 Aside from outbreak response, these staff members also reviewed NHSN surveillance data and coordinated prevention collaboratives with partners, facilitating patient safety efforts across the state.
Although barriers and facilitators need to be studied in greater detail, our findings revealed that the majority of health departments experienced either a delay in hiring an HAI coordinator or coordinator turnover throughout the ARRA funding period. The temporary nature of the ARRA funding, as well as the funding cycles that have followed, suggests that staff maintenance and turnover are likely to be a continuous challenge to these programs, especially as staffing levels at state and local health departments suffer from local budget restrictions.15 For capacity to be maintained over time, each health department must have the ability to restructure systems and roles strategically to optimize organizational performance in HAI prevention.
Limitations
HAI coordinators at health departments self-reported much of the data on activities, and thus capacity. To lessen potential measurement errors or inflation in self-reports, we asked CDC public health analysts who have ongoing contact with each state to review data and follow up on incomplete or unlikely responses. The ARRA–HAI funding was dispersed during a time of significant national and local attention to the burden of preventable HAIs. Therefore, distinguishing changes that occurred directly as a result of the ARRA–HAI funding from changes that occurred independently of ARRA funding was difficult. To mitigate this, we used metrics specifically based on ARRA–HAI programmatic requirements and integrated them into the evaluation framework.
Inability to parse out the independent impact of ARRA funding versus other potential influences was also a limitation. Other national initiatives (such as CLABSI–CUSP) operated throughout the ARRA funding period; in addition, some states used HAI prevention funding to enhance existing CLABSI–CUSP collaboratives. Changes within the states likely were synergistic, with increased attention to HAIs motivating providers to become more actively involved in programs that states were able to offer because of the ARRA funding. Because many of the states funded for HAI prevention also had laws requiring HAI reporting to health departments or the public, it is possible that the relationship between ARRA prevention funding and infection-specific SIR trends was confounded by the presence of a mandate. Several recent studies, however, suggest that public reporting mandates have no discernible effect on HAI trends16–18; these findings suggest that public reporting mandates may not be as much of a confounding influence on ARRA funding status as previously thought. Similarly, a 2012 study published in the New England Journal of Medicine showed that Centers for Medicare and Medicaid Services payment incentives did not affect HAI trends.19 State-level reporting mandates and Centers for Medicare and Medicaid Services reporting incentives should be, in theory, associated with decreasing HAIs, but this association is not manifest in the literature.
Conclusions
The ARRA–HAI program resulted in increased capacity for HAI surveillance and prevention across all 51 state and territorial health departments that received funding. Statistically significant decreases in CLABSIs and SSIs occurred in all states, and states that implemented ARRA-funded CAUTI collaboratives saw significantly greater declines in CAUTIs than did other states. The ARRA funding initiative is a new direction in HAI prevention that focuses on HAIs as a public health problem and supports the development of public health infrastructure at the state level. This will become even more important as HAI prevention efforts expand to settings beyond acute care hospitals and to efforts involving pathogens that require a coordinated prevention approach between many facilities (e.g., C. difficile and carbapenem-resistant Enterobacteriaceae).
Our evaluation highlights the effectiveness of targeted funding to state health departments for HAI prevention work in improving patient safety and public health infrastructure across the nation. For more information on state-level ARRA- and Affordable Care Act–funded HAI initiatives, please visit http://www.cdc.gov/HAI/state-based/index.html.
Acknowledgments
We thank the state-based healthcare-associated infection prevention public health advisors (Ramona Bennett, Susan Fuller, Laura McCallister, Jason Snow, Wendy Vance, Joni Young, and Kim Zimmerman) for their valuable contributions throughout the development of this evaluation and drafting of this article. We also thank Deanna Stewart and Carolyn Chi for their assistance with data abstraction.
Note. The findings and conclusions in this report are those of the authors and do not necessarily represent the official position of the CDC or the Agency for Toxic Substances and Disease Registry.
Human Participant Protection
No protocol approval was required because no primary data collection was conducted; data from state health departments were collected and summarized as part of routine public health technical assistance.
References
- 1.Cardo D, Dennehy PH, Halverson P et al. HAI Elimination White Paper Writing Group. Moving toward elimination of healthcare-associated infections: a call to action. Infect Control Hosp Epidemiol. 2010;31(11):1101–1105. doi: 10.1086/656912. [DOI] [PubMed] [Google Scholar]
- 2.Frieden TR. Maximizing infection prevention in the next decade: defining the unacceptable. Infect Control Hosp Epidemiol. 2010;31(suppl 1):S1–S3. doi: 10.1086/656002. [DOI] [PubMed] [Google Scholar]
- 3. Department of Health and Human Services. Action plan to prevent healthcare-associated infections. Available at: http://www.hhs.gov/ash/initiatives/hai/actionplan/hhs_hai_action_plan_final_06222009.pdf. Accessed May 26, 2012.
- 4. Centers for Disease Control and Prevention. Healthcare-associated Infections: Recovery Act. Available at: http://www.cdc.gov/HAI/recoveryact/index.html. Accessed May 26, 2012.
- 5.McCormick K, Sinkowitz-Cochran R, Woodard T, Bennett R, Snow J, Vance W, Young J, Zimmerman K, Srinivasan A, Ellingson K. The effect of Recovery Act funding for healthcare-associated infections on state health department’s infrastructure and NHSN reporting. Poster presented at: IDWeek; October 17–21, 2012; San Diego, CA. [Google Scholar]
- 6. Centers for Disease Control and Prevention. Collaboration primer: establishing HAI prevention collaboratives. Available at: http://www.cdc.gov/hai/toolkits/collaborationPrimer.html. Accessed June 29, 2012.
- 7. Centers for Disease Control and Prevention. National and state healthcare-associated infections standardized infection ratio report. Available at: http://www.cdc.gov/hai/national-sir-jan-dec-2010/methods.html. Accessed June 29, 2012.
- 8.Centers for Disease Control and Prevention. Reduction in central line-associated bloodstream infections among patients in intensive care units—Pennsylvania, April 2001–March 2005. MMWR Morb Mortal Wkly Rep. 2005;54(40):1013–1016. [PubMed] [Google Scholar]
- 9.Pronovost P, Needham D, Berenholtz S et al. An intervention to decrease catheter-related bloodstream infections in the ICU. N Engl J Med. 2006;355(26):2725–2732. doi: 10.1056/NEJMoa061115. [DOI] [PubMed] [Google Scholar]
- 10.DePalo VA, McNicoll L, Cornell M, Rocha JM, Adams L, Pronovost PJ. The Rhode Island ICU collaborative: a model for reducing central line-associated bloodstream infection and ventilator-associated pneumonia statewide. Qual Saf Health Care. 2010;19(6):555–561. doi: 10.1136/qshc.2009.038265. [DOI] [PubMed] [Google Scholar]
- 11.Jain R, Kralovic SM, Evans ME et al. Veterans Affairs initiative to prevent methicillin-resistant Staphylococcus aureus infections. N Engl J Med. 2011;364(15):1419–1430. doi: 10.1056/NEJMoa1007474. [DOI] [PubMed] [Google Scholar]
- 12.Lipitz-Snyderman A, Steinwachs D, Needham DM, Colantuoni E, Morlock LL, Pronovost PJ. Impact of a statewide intensive care unit quality improvement initiative on hospital mortality and length of stay: retrospective comparative analysis. BMJ. 2011;342:d219. doi: 10.1136/bmj.d219. [DOI] [PMC free article] [PubMed] [Google Scholar]
- 13. Centers for Disease Control and Prevention. Eliminating healthcare associated infections: state policy options. Available at: http://www.cdc.gov/hai/pdfs/toolkits/toolkit-HAI-POLICY-FINAL_01-2012.pdf. Accessed June 29, 2012.
- 14. Pharmacy Compounding: Implications of the 2012 Meningitis Outbreak: Hearings Before the HELP Committee of the Senate Health, Education, Labor and Pensions Committee, 112th Cong, 2nd sess (2012) (testimony of Dr Marion Kainer)
- 15.Centers for Disease Control and Prevention. The epidemiology workforce in state and local health departments—United States, 2010. MMWR Morb Mortal Wkly Rep. 2012;61(12):205–208. [PubMed] [Google Scholar]
- 16.Linkin DR, Fishman NO, Shea JA, Yang W, Cary MS, Lautenbach E. Public reporting of hospital-acquired infections is not associated with improved processes or outcomes. Infect Control Hosp Epidemiol. 2013;34(8):844–846. doi: 10.1086/671279. [DOI] [PMC free article] [PubMed] [Google Scholar]
- 17.Pakyz AL, Edmond MB. Influence of state laws mandating reporting of healthcare-associated infections: the case of central line-associated bloodstream infections. Infect Control Hosp Epidemiol. 2013;34(8):780–784. doi: 10.1086/671280. [DOI] [PubMed] [Google Scholar]
- 18.Ellingson K, McCormick K, Jernigan J, Edwards J, Fridkin S. A comparison of central line-associated bloodstream infections in states with mandatory versus voluntary reporting through the National Healthcare Safety Network. Oral presentation at: IDWeek; October 17–21, 2012; San Diego, CA. [Google Scholar]
- 19.Lee GM, Kleinman K, Soumerai SB et al. Effect of nonpayment for preventable infections in US hospitals. N Engl J Med. 2012;367(15):1428–1437. doi: 10.1056/NEJMsa1202419. [DOI] [PubMed] [Google Scholar]