Abstract
WaterMap and MM-GB/SA scoring methods were applied to an extensive congeneric series of small-molecule SRC inhibitors with high-quality enzyme data and well characterized binding modes to compare the performance of these scoring methods in this data set and to provide insight into the relative strengths of each method. Only minor conformational changes in SRC bound with representative DFG-in class of inhibitors were demonstrated in previous studies; thus, the protein flexibility that normally presents a challenge to pose and potency predictions was minimized in this model system. While WaterMap correctly recognized major trends in the SAR of this series, MM-GB/SA performed better in ranking the relative ligand affinities. The different scoring methods were further analyzed to determine which aspects of series SAR were more amenable to MM-GB/SA than WaterMap scoring.
Keywords: WaterMap, MM-GB/SA, SRC tyrosine kinase, free energy of binding
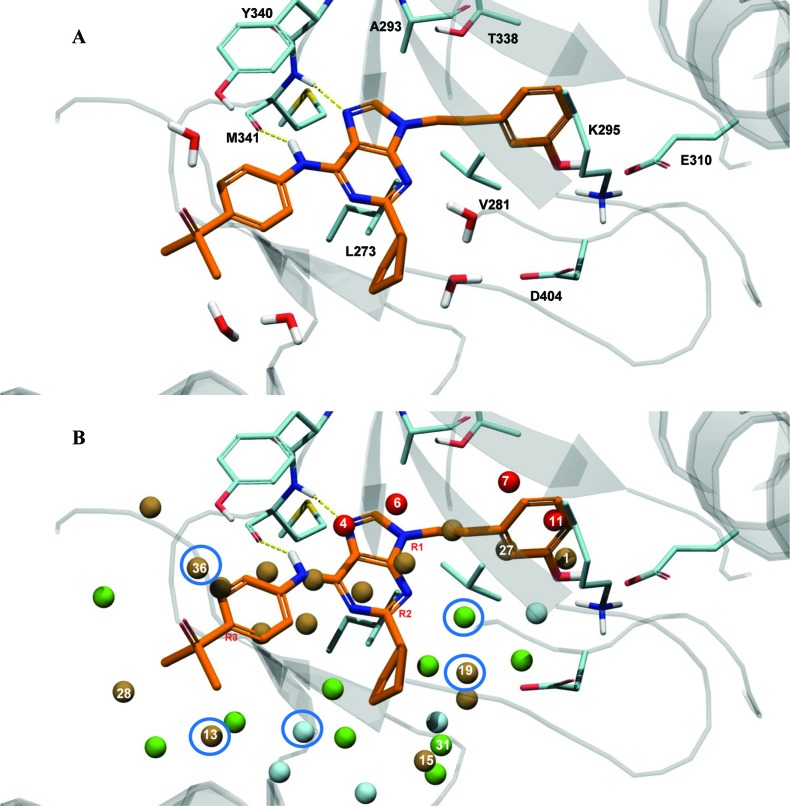
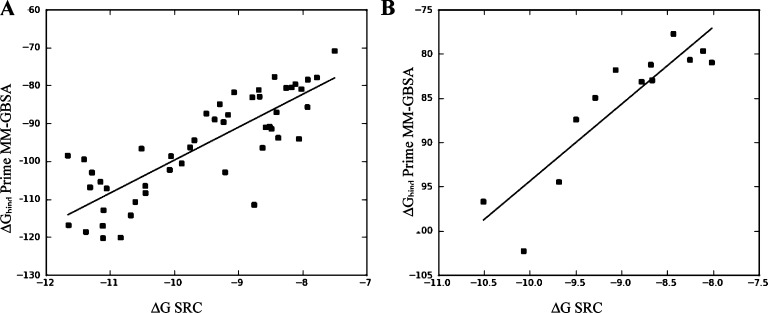
Computational prediction of compound potency has for some time been integrated into the lead optimization cycle at pharmaceutical companies. The promise of robust scoring methods is to maximize potency of lead compounds while reducing the number of molecules synthesized. However, obtaining a predictive model even for series with information-rich SAR can be challenging. Many scoring methods, and in particular molecular-mechanics based MM-GB/SA and MM-PB/SA scoring, have been evaluated for their ability to predict relative binding affinities for compounds in congeneric series.1−3 The use of MM-GB/SA as a scoring function is well documented and was shown to be superior to scoring with Glide XP in some cases.1 Scoring large data sets with WaterMap4 is relatively new, and its predictive ability has so far been most extensively validated for filling hydrophobic enclosures with appropriately placed substituents.5,6 WaterMap describes the energetics associated with displacing water in the protein active site by the ligand upon binding by filling the cavity of the protein with explicit water molecules and approximating the desolvation energy as the sum of the energies of hydration sites displaced by the ligand.4,5 In this work, WaterMap and Prime MM-GB/SA7 were applied to a congeneric series of SRC kinase inhibitors, with the goal of assessing WaterMap performance as a scoring function by comparing it to MM-GB/SA scoring. Recently, Robinson et al. published a study of kinase selectivity using WaterMap, where they report good correlation between water location and observed selectivity of ligands for selected tyrosine kinases.8 The goal of our study is to evaluate whether the displacement of high energy waters found in the SRC binding site is sufficient for relative ranking of the ligand activities in a congeneric series or whether other factors, such as the protein–ligand interactions, play a significant role for this data set and must therefore be explicitly considered to obtain predictive scoring. At ARIAD, we have accumulated significant data in a lead series of SRC tyrosine kinase inhibitors.9−11 SRC kinase is a prototypical member of the kinase family, whose abnormal activity is associated with osteoporosis12−14 and cancer metastasis.15,16 The development of small-molecule SRC inhibitors, targeted to block the ATP-binding site and regulate SRC activity, remains an area of active research, and it has been shown that inhibition of SRC activity correlates to reduction of disease progression in some cancers.17 As SRC continues to be a target of interest, the investigation of scoring functions to rank small-molecule inhibitors of this and other tyrosine kinases also remains relevant. Structurally, SRC kinase can adopt DFG-in active, DFG-in with a helix-C twist, and DFG-out inactive conformations, as observed in other tyrosine kinases where active-to-inactive conformational conversions are determining factors of inhibitor binding.18 The compounds studied here bind to SRC in the active DFG-in conformation, with only modest conformational SRC flexibility. The binding site of SRC in complex with purine-based inhibitor AP23464 is illustrated in Figure 1A.9 The purine template is bound at the hinge, with one hydrogen bond between the backbone nitrogen of M341 and N7 of the purine, and a second hydrogen bond between the carbonyl oxygen of M341 and the aniline nitrogen of AP23464. The 3-hydroxyphenethyl N9 substituent is extended into the kinase selectivity pocket, forming key interactions with the residues of that pocket. The aromatic ring forms stacking interactions with K295, M314, I336 (not shown), and T338; the hydroxyl group forms a hydrogen bond with E310 and D404. The purine C6 substituent, an aromatic phosphine oxide, extends into the solvent. Finally, the cyclopentyl purine C2 substituent extends into the ribose pocket and makes hydrophobic contacts with surrounding residues. During lead optimization in a SRC kinase inhibitor program, an extensive series of trisubstituted purines with substitutions at the N9 (R1), C2 (R2), and C6 (R3) positions of the purine template was synthesized and tested for SRC kinase activity. The data set used for the present study consists of 49 neutral compounds whose activities span more than 3 orders of magnitude, from subnanomolar to micromolar range (Table 1 and Table S1 of the Supporting Information). The compounds were docked into the X-ray crystal structure of SRC (PDB: 2BDJ) using Glide XP19 as described in the experimental procedures in the Supporting Information. WaterMap and MM-GB/SA scoring protocols were applied to obtain predicted free energies of binding. For MM-GB/SA scoring, a good correlation between the experimental and predicted free energies of binding was obtained, with an r2 of 0.68 and the predictive index (PI) of 0.81 (Figure 2A). PI is a metric of rank ordering of compounds, with 1 corresponding to perfect ranking and 0 signifying random prediction.20 For comparison, Glide XP scoring of this data set yielded a poor correlation (r2 = 0.34, and PI = 0.59; plot not shown).
Figure 1.
(A) AP23464 in the binding site of SRC (PDB: 2BDJ) with crystallographic waters shown. (B) WaterMap of 2BDJ. High energy, unstable waters (red and brown) are located in the hydrophobic pocket and at the hinge binding site. Moderately unstable (green) waters are located in the proximity of the ligand, and stable (cyan) waters are for the part further away from the ligand. The attachment sites R1, R2, and R3 are labeled in red. The five crystallographic water positions were also identified by WaterMap (circled in blue: distance between experimental and computed water was 1.2 Å or less).
Table 1. Representative Compounds from the SRC Data Set (IC50 values reported in nM)a.
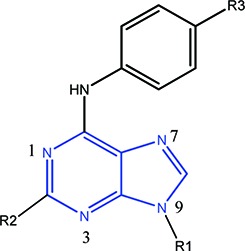
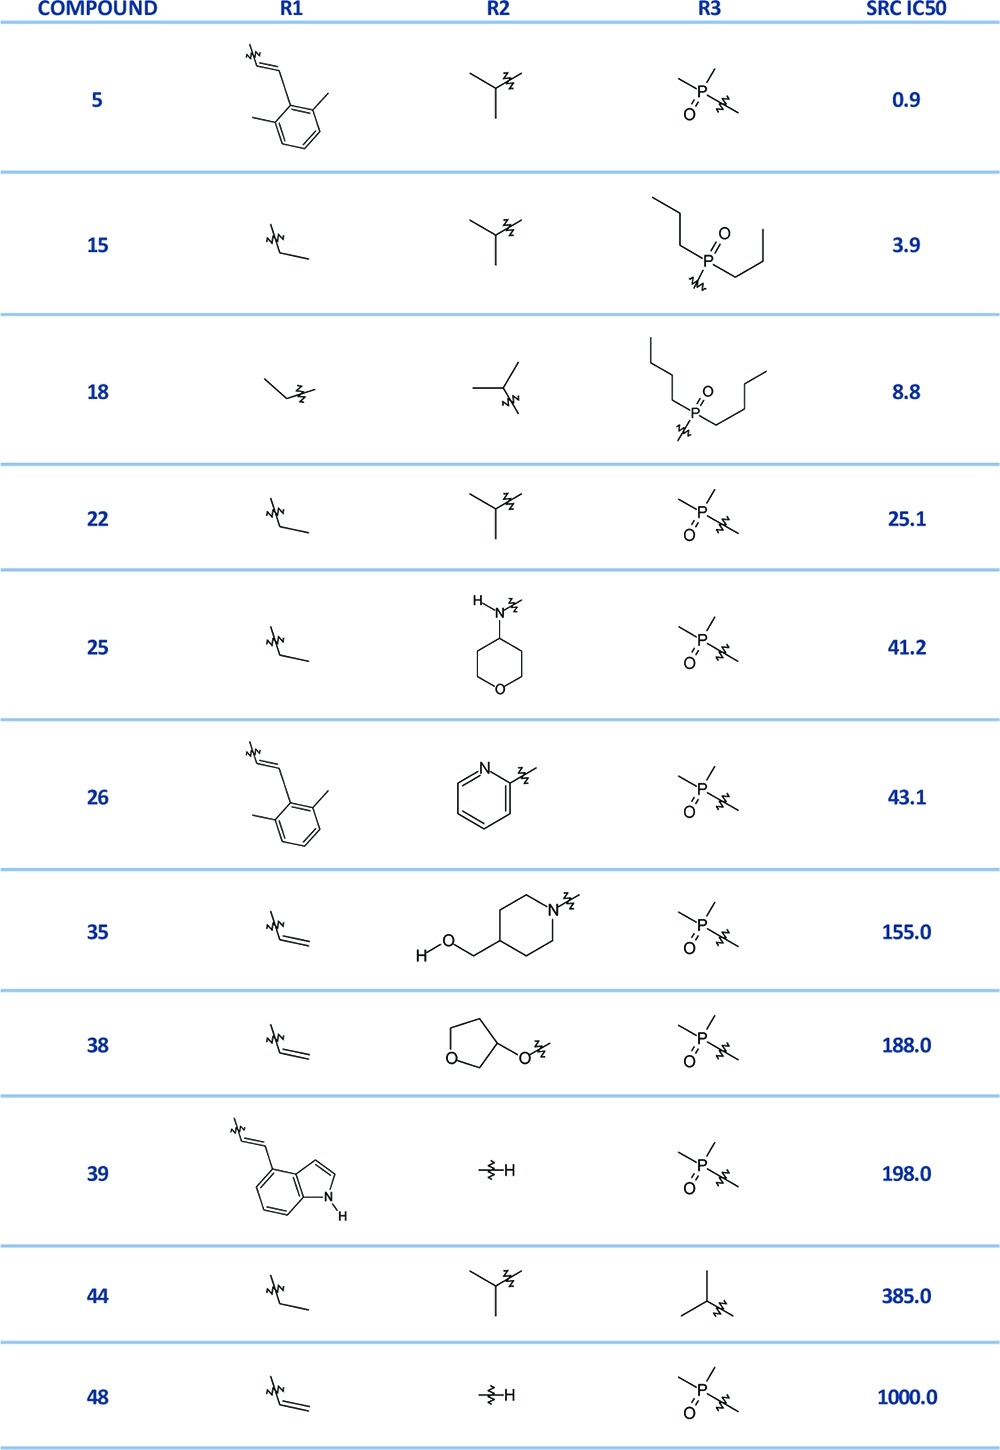
The complete data set is shown in Table S1 of the Supporting Information.
Figure 2.
(A) Experimental vs computed ΔGbind values (MM-GB/SA) for the complete data set (r2 = 0.68, PI = 0.81). (B) Experimental vs computed ΔGbind values (MM-GB/SA) for the R3 substituents (r2 = 0.80, PI = 0.94).
The evaluation of the WaterMap prediction begins with the analysis of the hydration regions in the active site (Figure 1B). As previously described,8 the SRC kinase binding site contains several high-energy hydration regions, with highest-energy waters located at the hinge and the hydrophobic pocket. WaterMap places 36 hydration sites in the protein cavity. Twenty one of the sites, colored in brown and red in the figure, are unstable (ΔG > 1.0 kcal/mol), meaning that their displacement by the ligand should result in a net gain in the binding free energy. Of those, 4 are very high-energy sites, with ΔG > 3.5 kcal/mol relative to bulk water (shown in red). Ten waters (green) are moderately unstable (0 < ΔG < 1.0 kcal/mol), and the remaining 5 (cyan) are stable (ΔG < 0 kcal/mol), with one molecule particularly stable (ΔG = −3.5 kcal/mol). It is interesting to note that the computed hydration sites overlap with five crystallographic waters observed within 5 Å of the ligand in the crystal structure. This visual analysis of the WaterMap provides an indication of where the most significant gain in potency may be achieved. Three high energy water molecules are found in the vicinity of the R1 position. The hydroxyphenethyl ring of AP23464 displaces one of the high energy, buried waters (w11, ΔG = 6.6 kcal/mol) and partially displaces two more (w7, ΔG = 4.3 kcal/mol, and w27, ΔG = 2.6 kcal/mol). Several of the high energy waters are associated with the hinge region of the kinase and have been previously reported.8 These waters are consistently displaced by the purine template of the inhibitors in our data set, and their contribution to the computed free energy of binding can therefore be assumed to remain constant. In the ribose pocket (R2 position), only one unstable water molecule (w19, ΔG = 2.9 kcal/mol) is observed. Finally, at the solvent front (corresponding to the R3 position), several waters are found, with the free energy in the range from 1.5 to 2.5 kcal/mol. Thus, WaterMap predicted that the largest gain in potency may be achieved by displacing water molecules in the selectivity pocket of the enzyme and making appropriate R1 substitutions.
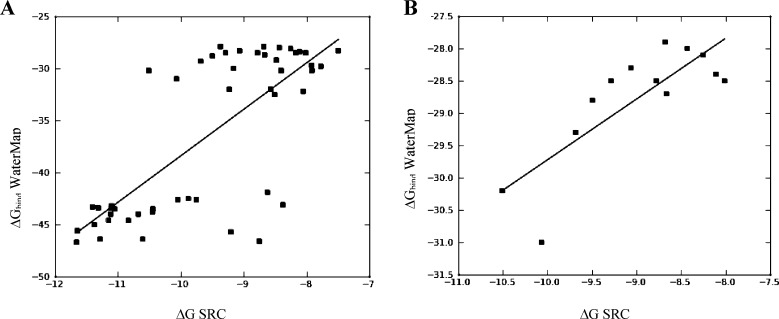
The 49 docked ligands were scored with the WaterMap scoring function and the computed binding free energy (ΔGbind) values plotted against the experimental binding affinities (ΔG, approximated from IC50 values) (Figure 3A). Instead of a linear correlation, the plot revealed a prominent splitting of the data set into two groups separated by a gap in computed free energy values (ΔΔG) of at least 9.4 kcal/mol. Examination of the compounds in each group reveals that those with bulky aromatic R1 substituents are scored as more active than compounds with smaller substituents (ethyl or methyl). This finding is consistent with the observation that the largest energetic contribution to overall binding energy comes from interactions in the hydrophobic pocket. The R1-substituted compounds are clustered in the lower half of the graph. Of those, the most active compounds (measured IC50 values under 5 nM) were predicted correctly and are clustered in the lower left-hand quadrant of the graph. Similarly, compounds that are least active (upper right-hand quadrant, measured IC50 values greater than 200 nM) were predicted correctly. Compounds in the middle range of activity (between 5 nM and 200 nM) are predicted incorrectly, with compounds bearing aromatic R1 substituents always scoring significantly better. For example, 39 and 35 have measured IC50 values in the same range (198 nM and 155 nM); however, the difference in predicted free energy values between these two compounds (ΔΔG) is 11.0 kcal/mol. Compound 35, lacking an extended hydrophobic substituent, is scored as much less active than 39. In another example, compounds 5 and 26 have measured IC50 values of 0.9 and 43 nM, respectively; both carry a 2,5-dimethyl phenethyl at the R1 position. However, 26 is predicted to be more potent than 5 by 2.3 kcal/mol. In summary, WaterMap scoring is dominated by the influence of the R1 substituent in the hydrophobic pocket. (Note, however, that the high values of r2 = 0.55 and PI = 0.72 indicate that the best and worst compounds were correctly predicted). To investigate this observation further, we evaluated a subgroup of compounds with varying R1 (and constant R2 and R3), to detect any correlation with the activity of the R1 group alone. No meaningful correlation between the WaterMap predicted ΔGbind and experimental ΔG was detected.
Figure 3.
(A) Experimental vs computed ΔGbind (WaterMap) for the complete data set (r2 = 0.55, PI = 0.72). (B) Experimental vs computed ΔGbind (WaterMap) for the R3 substituents (r2 = 0.65, PI = 0.76).
The next question we posed was whether WaterMap can recognize the more subtle SAR trends in the data when we remove the distorting influence of the R1 group. We considered two subgroups of compounds, one with R1 and another with R2 modifications only (keeping the remaining two substituents constant). In the case of R2 (ribose pocket), no meaningful correlation could be obtained. There might be several factors responsible for this lack of correlation. First, a degree of complexity is added by the flexible nature of the substituents in the ribose pocket. The uncertainty in the binding pose resulting from this flexibility means that a small conformational modification may have a drastic effect on the resulting ΔG. The energy differences predicted by WaterMap in this pocket can be largely attributed to displacement of one water molecule, w19, which contributes ΔG of 2.85 kcal/mol. Additional energy can be gained by displacing w31 (0.8 kcal/mol) and w15 (1.1 kcal/mol). This means that if a side chain conformation favored by the docking pose does not entirely displace the high-energy water, the free energy gain cannot be accurately estimated by WaterMap. Additionally, parts of the ribose pocket are solvent exposed. The energetic estimation at the solvent front is difficult and remains an area of active methodology development. Finally, a good prediction was obtained for the set of compounds with substituents at the R3 position (Figure 3B), with WaterMap (r2 = 0.65 and PI of 0.76). MM-GB/SA once again yielded an even better correlation, r2 = 0.83 and PI = 0.93 (Figure 2B). The reason for the improved correlation in this series is that w28, w13, and w36 are located at the solvent front and, in this case, the top scoring conformations of the docked ligands enabled the displacement of the high-energy waters. To appreciate the complexity that this data set presents for WaterMap scoring, we examine the experimental SAR trends. Modifications at each of the three positions R1, R2, and R3 affect the potency to varying degrees. The largest increase in potency is attained by addition of a hydrophobic substituent at R1 (selectivity pocket). The most active, subnanomolar compounds carry a hydrophobic R1 substituent. The loss of the R1 substituent results in at least a 10-fold decrease in potency. To illustrate, compound 22 has a methyl substituent at the N9 position, and a measured IC50 of 25.1 nM, whereas 5, extending into the selectivity pocket with a 2,6-dimethyl phenethyl group, is almost 30-fold more active, with an IC50 value of 0.89 nM. Substituents at the R2 (ribose pocket) position present a more ambiguous SAR. Small hydrophobic groups or monocycles (e.g., 3-chloropyridine) are associated with active compounds, while larger, polar groups lead to loss of activity. Two crystallographic waters interact with the N3 of purine via a hydrogen bonding network in the vicinity of the R2 substituent (Figure 1A). We speculate that the substituents at that position may exert some influence on the strength of the hydrogen bond, which may in turn affect the binding energy. To investigate this effect, we used a single-point quantum mechanical calculation with Jaguar21 on the docked poses of compounds 35, 38, and 48. We observed that the charge of the N3 nitrogen varies depending on the R2 substituent (−0.53 for compound 48; −0.57 for compound 38, and −0.48 for compound 35), and this may contribute to the varying strength of the N3-water hydrogen bond. Finally, the SAR at the R3 position reveals a span of activities varying by a factor of 100 (compare compounds 44, bearing an isopropyl group, and 15, with a PO(n-Pr)2). The accurate estimation of the magnitude of free energy changes associated with these modifications remains challenging for various reasons which are outside of the scope of this work but have been extensively analyzed by other researchers.2 In summary, the potency in this data set is largely driven by the hydrophobic effect in the R1 pocket. The R2 and R3 substituents have a significantly smaller influence on the SAR. Furthermore, their effect appears to be driven by ligand–protein interactions, ligand conformation, and possibly water-mediated interactions—all factors which WaterMap does not account for. Overall, WaterMap correctly identified “hot” spots in the enzyme binding site of SRC. By placing the most unfavorable waters at the site of the template and the hydrophobic R1 substituent, and less unfavorable waters at the other two substitution sites, WaterMap qualitatively reflected the trend in the 2D SAR. Quantitatively, WaterMap scoring was dominated by the R1 effect. Separating the compounds into subsets, to evaluate WaterMap performance for single-site substitution, we saw some improvement. For one subset of compounds at the solvent front, WaterMap provided good ranking; however, for the second subset of compounds (ribose pocket), no correlation was achieved. At this time, researchers have reported successful application of the mixed MM-GB/SA and WaterMap scoring functions, where the combination of scoring terms is designed to compensate the known deficiencies of each method.2,22 We had attempted the combination of these functions; however, due to poor performance of WaterMap scoring on this data set, the combined WM/MM-GB/SA scoring did not demonstrate improvement over MM-GB/SA scoring. In summary, WaterMap was not an appropriate quantitative scoring tool for this data set, because hydrophobic effects alone do not explain the SAR in this series. Other factors, such as ligand–protein interactions, which are not accounted for by WaterMap, make significant contributions to the binding affinity of the inhibitors. The results from MM-GB/SA correlated better with the experimental results for these SRC inhibitors. Nonetheless, despite the challenges presented by our data set, the insights gained from WaterMap combined with the scoring ability of MM-GB/SA provide a useful picture of the structure–activity relationship in this series. Our results indicate a potential utility of combining WaterMap and MM-GB/SA for analysis of other lead optimization series.
Acknowledgments
We thank Kathryn Loving, Robert Abel, Woody Sherman, and John Dowling of Schrödinger, Inc. for helpful discussions and assistance with the Schrödinger software.
Supporting Information Available
Table of the complete data set and experimental procedures. This material is available free of charge via the Internet at http://pubs.acs.org.
Author Contributions
AK performed the molecular modeling studies, data analysis and wrote the manuscript. XZ and DD assisted with the design of the computational studies, computational and SAR data analysis and provided manuscript revisions. All authors have given approval to the final version of the manuscript.
The authors declare no competing financial interest.
Supplementary Material
References
- Guimaraes C. R.; Cardozo M. MM-GB/SA rescoring of docking poses in structure-based lead optimization. J. Chem. Inf. Model. 2008, 48, 958. [DOI] [PubMed] [Google Scholar]
- Guimaraes C. R.; Mathiowetz A. M. Addressing limitations with the MM-GB/SA scoring procedure using the WaterMap method and free energy perturbation calculations. J. Chem. Inf. Model. 2010, 50, 547. [DOI] [PubMed] [Google Scholar]
- Lyne P. D.; Lamb M. L.; Saeh J. C. Accurate Prediction of the Relative Potencies of Members of a Series of Kinase Inhibitors Using Molecular Docking and MM-GBSA Scoring. J. Med. Chem. 2006, 49, 4805. [DOI] [PubMed] [Google Scholar]
- Abel R.; Young T.; Farid R.; Berne B. J.; Friesner R. A. Role of the Active-Site Solvent in the Thermodynamics of Factor Xa Ligand Binding. J. Am. Chem. Soc. 2008, 130, 2817. [DOI] [PMC free article] [PubMed] [Google Scholar]
- Beuming T.; Farid R.; Sherman W. High-energy water sites determine peptide binding affinity and specificity of PDZ domains. Protein Sci. 2009, 18, 1609. [DOI] [PMC free article] [PubMed] [Google Scholar]
- Higgs C.; Beuming T.; Sherman W. Hydration Site Thermodynamics Explain SARs for Triazolylpurines Analogues Binding to the A2A Receptor. ACS Med. Chem. Lett. 2010, 1, 160. [DOI] [PMC free article] [PubMed] [Google Scholar]
- Prime v3.0; Schrödinger, LLC: New York, NY, 2011. [Google Scholar]
- Robinson D. D.; Sherman W.; Farid R. Understanding kinase selectivity through energetic analysis of binding site waters. Chem. Med. Chem. 2010, 5, 618. [DOI] [PubMed] [Google Scholar]
- Dalgarno D.; Stehle T.; Narula S.; Schelling P.; van Schravendijk M. R.; Adams S.; Andrade L.; Keats J.; Ram M.; Jin L.; Grossman T.; MacNeil I.; Metcalf C. 3rd; Shakespeare W.; Wang Y.; Keenan T.; Sundaramoorthi R.; Bohacek R.; Weigele M.; Sawyer T. Structural basis of Src tyrosine kinase inhibition with a new class of potent and selective trisubstituted purine-based compounds. Chem. Biol. Drug. Des. 2006, 67, 46. [DOI] [PubMed] [Google Scholar]
- Shakespeare W. C.; Wang Y.; Bohacek R.; Keenan T.; Sundaramoorthi R.; Metcalf C. 3rd; Dilauro A.; Roeloffzen S.; Liu S.; Saltmarsh J.; Paramanathan G.; Dalgarno D.; Narula S.; Pradeepan S.; van Schravendijk M. R.; Keats J.; Ram M.; Liou S.; Adams S.; Wardwell S.; Bogus J.; Iuliucci J.; Weigele M.; Xing L.; Boyce B.; Sawyer T. K. SAR of carbon-linked, 2-substituted purines: synthesis and characterization of AP23451 as a novel bone-targeted inhibitor of Src tyrosine kinase with in vivo anti-resorptive activity. Chem. Biol. Drug Des. 2008, 71, 97. [DOI] [PubMed] [Google Scholar]
- Wang Y.; Shakespeare W. C.; Huang W. S.; Sundaramoorthi R.; Lentini S.; Das S.; Liu S.; Banda G.; Wen D.; Zhu X.; Xu Q.; Keats J.; Wang F.; Wardwell S.; Ning Y.; Snodgrass J. T.; Broudy M. I.; Russian K.; Dalgarno D.; Clackson T.; Sawyer T. K. Novel N9-arenethenyl purines as potent dual Src/Abl tyrosine kinase inhibitors. Bioorg. Med. Chem. Lett. 2008, 18, 4907. [DOI] [PubMed] [Google Scholar]
- Soriano P.; Montgomery C.; Geske R.; Bradley A. Targeted disruption of the c-src proto-oncogene leads to osteopetrosis in mice. Cell 1991, 64, 693. [DOI] [PubMed] [Google Scholar]
- Marzia M.; Sims N. A.; Voit S.; Migliaccio S.; Taranta A.; Bernardini S.; Faraggiana T.; Yoneda T.; Mundy G. R.; Boyce B. F.; Baron R.; Teti A. Decreased c-Src expression enhances osteoblast differentiation and bone formation. J. Cell. Biol. 2000, 151, 311. [DOI] [PMC free article] [PubMed] [Google Scholar]
- Amling M.; Neff L.; Priemel M.; Schilling A. F.; Rueger J. M.; Baron R. Progressive increase in bone mass and development of odontomas in aging osteopetrotic c-src-deficient mice. Bone 2000, 27, 603. [DOI] [PubMed] [Google Scholar]
- Summy J. M.; Gallick G. E. Src family kinases in tumor progression and metastasis. Cancer Metastasis Rev. 2003, 22, 337. [DOI] [PubMed] [Google Scholar]
- Sawyer T. K. Cancer metastasis therapeutic targets and drug discovery: emerging small-molecule protein kinase inhibitors. Expert Opin. Invest. Drugs 2004, 13, 1. [DOI] [PubMed] [Google Scholar]
- Sen B.; Johnson F. M. Regulation of Src family kinases in human cancers. J. Signal Transduction 2011, 865819. [DOI] [PMC free article] [PubMed] [Google Scholar]
- Eck M. J.; Manley P. W. The interplay of structural information and functional studies in kinase drug design: insights from BCR-Abl. Curr. Opin. Cell Biol. 2009, 21, 288. [DOI] [PubMed] [Google Scholar]
- Glide v5.7; Schrödinger, LLC: New York, NY, 2011.
- Pearlman D. A.; Charifson P. S. Are free energy calculations useful in practice? A comparison with rapid scoring functions for the p38 MAP kinase protein system. J. Med. Chem. 2001, 44, 3417. [DOI] [PubMed] [Google Scholar]
- Jaguar v7.8; Schrödinger, LLC: New York, NY, 2011.
- Abel R.; Salam N. K.; Shelley J.; Farid R.; Friesner R. A.; Sherman W. Contribution of explicit solvent effects to the binding affinity of small-molecule inhibitors in blood coagulation factor serine proteases. Chem. Med. Chem. 2011, 6, 1049. [DOI] [PubMed] [Google Scholar]
Associated Data
This section collects any data citations, data availability statements, or supplementary materials included in this article.


