Abstract
The liver differs from other organs in that two vascular systems deliver its blood – the hepatic artery and the portal vein. However, how the two systems interact is not fully understood. We therefore studied the microvascular geometry of rat liver hepatic artery and portal vein injected with the contrast polymer Microfil®. Intact isolated rat livers were imaged by micro-CT and anatomic evidence for hepatic arteriolo-portal venular shunts occurring between hepatic artery and portal vein branches was found. Simulations were performed to rule out the possibility of the observed shunts being artifacts resulting from image blurring. In addition, in the case of specimens where only the portal vein was injected, only the portal vein was opacified, whereas in hepatic artery injections, both the hepatic artery and portal vein were opacified. We conclude that mixing of the hepatic artery and portal vein blood can occur proximal to the sinusoidal level, and that the hepatic arteriolo-portal venular shunts may function as a one-way valve-like mechanism, allowing flow only from the hepatic artery to the portal vein (and not the other way around).
Keywords: liver, modulation transfer function, partial volume effect, rat, small animal
Introduction
The liver differs from other organs by having two vessel systems which deliver blood to it, the hepatic artery and the portal vein (Sinnatamby, 2006). Early studies of the liver's dual blood supply proposed two different and contrasting hypotheses: (1) the hepatic artery and portal vein blood flows do not influence each other (Bollman et al. 1953); (2) a reciprocal and compensatory relationship exists between changes in their blood flow (Soskin et al. 1938). In 1965, a definite interrelationship between the two was identified by observing that the hepatic arterial flow increased when portal vein flow was decreased (Ternberg & Butcher, 1965). This mechanism was later termed the hepatic arterial buffer response (Lautt, 1983).
More recently, a study by Richter et al. (2001) offered not only support for the hepatic arterial buffer response but also functional evidence for the existence of shunts between the hepatic artery and portal vein. This was supported the observation that if portal vein flow was reduced to ∼10% of its normal flow immediately downstream of the tourniquet, the blood flow in the terminal venules returned to nearly 70% of its normal value. Thus, these shunts would need to occur upstream of the hepatic lobule sinusoids, allowing flow from the hepatic artery into the portal vein. This implies that these hepatic arteriolo-portal venular shunts could offer a means of communication between the two vessel systems, where reduction in portal vein flow is compensated for by the hepatic artery.
Although histology offers very high-resolution capabilities, the use of serial sectioning logistically limits our ability to identify the 3D interconnectivity of the vasculature. We therefore used micro-CT to image contrast-enhanced vasculature of intact rat livers. Micro-CT is an excellent method for studying the anatomy of the branching geometry of microvasculature by allowing high-resolution 3D images to be generated in intact specimens (Wan et al. 2000; Marxen et al. 2004; Schambach et al. 2010; Kline & Ritman, 2012). These 3D images are also more conveniently susceptible to analysis of the intact in situ vasculature.
A limitation of computed tomography imaging is that there is blurring, which, at the limits of resolution, can result in false connections between vessels lying in close proximity, or in apparent loss of vessels of less than a certain diameter. This blurring can occur due to pixelization of the X-ray projection images, resulting in partial volume effects as well as from non-linear partial volume effects, depending on the range of attenuation coefficient values along the X-ray beam illuminating a detector pixel. Penumbral blurring can also be caused by the finite size of the X-ray source focal spot, the blurring due to the thickness of the X-ray to light-converting crystals and the modulation transfer function (MTF) of the optical coupling between that crystal (or fluorescent screen) and the electronic detector array. The 3D image itself is further blurred in proportion to the voxel size. In addition to the image-related causes, the tomographic reconstruction process also contributes to the blurring. In our case the penumbral effect was minimized by placing the specimen very close to the detector array. Also, the larger the detector pixels, the greater the chances of the partial volume effect resulting from a high contrast edge (e.g. of a contrast-filled vessel lumen) that is partially within that detector pixel. The problem is that each pixel integrates the X-ray ‘intensity’ (i.e. I) rather than the ‘density’ (μ), where I = I0e−μx. Here I0 is the illuminating X-ray intensity and x is the path length of the X-ray beam through the specimen. Thus, the subsequent logarithmic transformation needed for computation of μ is corrupted. This effect becomes greater, the larger the difference in μ values (which is the case at the interface of the contrast-filled lumen and surrounding tissue) within the X-ray beam illuminating a single detector pixel.
Materials and methods
Specimen preparation
These animal studies were approved by the Institutional Animal Care and Use Committee at the Mayo Clinic in Rochester (MN, USA). Rats were anesthetized and the livers exposed by midline laparotomy. After the hepatic artery and portal vein were cannulated and flushed with heparinized saline to remove the blood and to prevent blood clotting, the rats were euthanized. Next, three different specimen preparation methods were utilized: (1) both the hepatic artery and portal vein were infused with Microfil® (a silicon polymer doped with lead) at physiological pressures (100 mmHg for hepatic artery, 20 mmHg for portal vein); (2) either the hepatic artery or the portal vein alone was injected (Murad et al., 2008) or (3) the hepatic artery was injected with Microfil®, and the portal vein was injected with barium sulfate in gelatin suspension. The injection rates were ∼ 1 cm3 min−1. The two contrast agents could be discriminated because the CT image gray scale of the Microfil® was greater than that of the barium sulfate suspension. This was confirmed by scanning a phantom composed of a syringe tube filled with Microfil® and another filled with barium in order to measure the difference in gray scale between the two contrast agents. After the contrast was allowed to set, the organ was harvested. A photograph of an isolated liver is shown in Fig. 1(A), prepared by method 1. This demonstrated the uniformity of the contrast agent distribution within the liver vascular trees. Following a micro-CT scan at 20 μm detector pixel resolution of the intact liver (Fig. 1B), individual lobes were isolated and individually potted in paraffin for subsequent scanning at a higher 5-μm detector pixel resolution. Figure 2(A) shows the caudate lobe from the same liver shown in Fig. 1. Figure 2(B) shows the maximum intensity projection image at 20 μm cubic voxel resolution, and Fig. 2(C) a subvolume of that same specimen scanned at 5 μm cubic voxel resolution.
Figure 1.
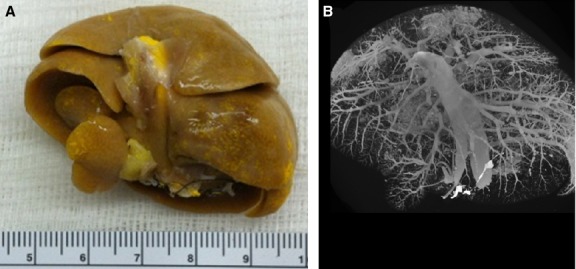
Overview of specimen preparation and subsequent micro-CT scanning. (A) Photograph of a rat liver after injection of yellow Microfil® contrast polymer into the hepatic vasculature. The scale bar is in cm. (B) Rat liver scanned in its entirety (20 μm cubic voxels).
Figure 2.
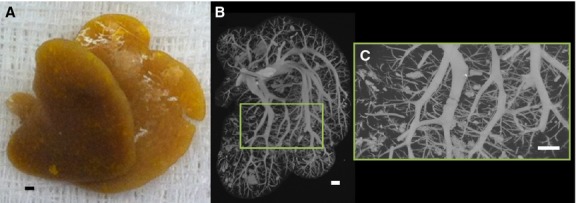
(A) Photograph of only the caudate lobe after injection of yellow Microfil® contrast polymer into the hepatic vasculature. (B) Caudate lobe scanned in its entirety at 20 μm cubic voxel size. (C) Subvolume of caudate lobe scanned at high-resolution (5 μm cubic voxels). Scale bars: 1 mm.
Micro-CT imaging
In this study we utilized image data from our in-house micro-CT scanners (Jorgensen et al. 1998). All micro-CT scanners have three basic components: the X-ray source, the imaging array, and a method for rotating either the specimen within a stationary scanner or the scanner around the stationary specimen (Ritman, 2011). Placing the sample within the system, the specimen was then exposed to X-rays at multiple angles of view around 360°. The X-rays that were transmitted through the specimen were collected via an imaging array. A tomographic reconstruction algorithm (Feldkamp et al. 1984) was then used to create a 3D volume dataset derived from the X-ray attenuation properties of the organ along a line joining the X-ray focal spot to each of the detector array pixels.
Blurring simulation
To evaluate the impact of this image blurring on the generation of ‘false’ shunts between vessel lumens lying in close proximity (as between the hepatic artery and portal vein), we performed simulations utilizing the known MTF of our imaging system (at 20 μm detector pixel MTF = 20 line pairs per mm and at 5 μm detector pixel MTF = 49 mm−1 at 10% modulation). Simulations were performed for two cases: (1) where a hepatic artery and portal vein lie in close proximity but without a shunt connection them and (2) where the hepatic artery and portal vein were connected by a hepatic arteriolo-portal venular shunt. Our model assumed a square wave profile for the vessel cross-section that was blurred by a Gaussian function: where δ is the standard deviation of the Gaussian blurring function (12 μm in the case of 5 μm voxel size). The area of the Gaussian blurring function was set to unity.
Results
The impact of image blurring on the ability to define the vessel lumen surfaces is illustrated in Fig. 3, where the blurring of vessel edges is presented. We generally perform the tomographic reconstruction so that the resulting cubic voxel has a side dimension equal to that of the detector pixel. The gray scale in our CT images is 1000× μm (in 1 cm per unit).
Figure 3.
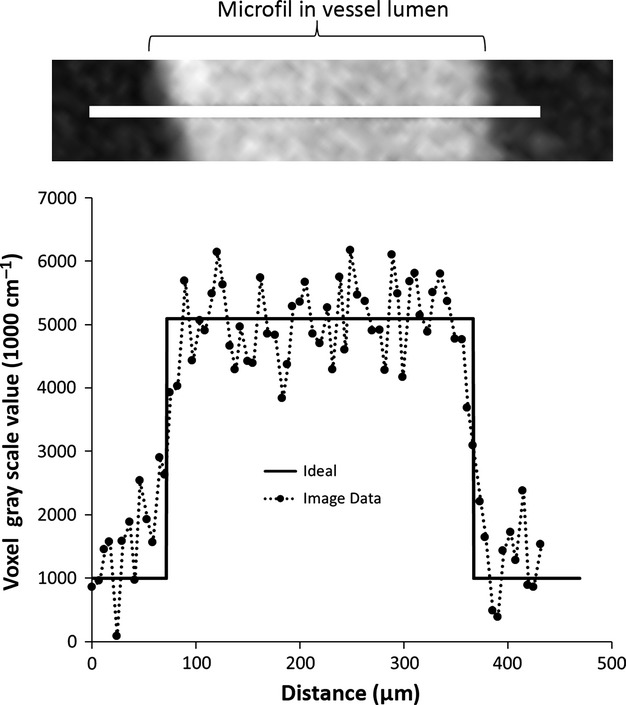
Degree to which vessel edges are blurred in CT images made up of 5-μm on-a-side cubic voxels. Shown here is a line profile of the CT image voxel gray scale values across a ∼ 0.3-mm diameter vessel segment. Ideally the line profile is a square wave. The edges are not sharp, due to image blurring compounded by CT gray scale noise.
In specimens where only the portal vein was injected, the hepatic artery did not fill with contrast. However, where only the hepatic artery was injected, both the hepatic artery and portal vein were filled with the contrast medium. An example of these two cases is shown in Fig. 4.
Figure 4.
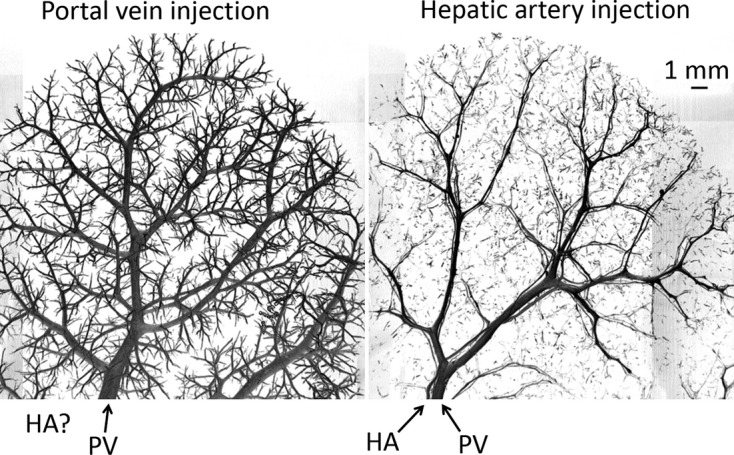
Observation of potential one-way valve-like mechanism of hepatic arteriolo-portal venular shunts, observed with preparation method 2. Left panel: portal vein Microfil injection results in only the portal vein contains contrast. Right panel: hepatic artery Microfil injection results in both the hepatic artery and portal vein being opacified.
In addition, when Microfil® was injected into the hepatic artery at 100 mmHg pressure, and barium was injected into the portal vein at 20 mmHg pressure, Microfil® also showed up in the portal vein (Fig. 5).
Figure 5.

Further support of potential one-way valve-like mechanism of hepatic arteriolo-portal venular shunts, observed by preparation method 3. (A) Hepatic artery injected with Microfil®, and the portal vein injected with barium (lower contrast). (B) Evidence of Microfil® contained in the portal vein. (C) Portal vein cross-section completely filled with Microfil®.
The hepatic artery tree closely follows alongside the portal vein throughout the liver. We noted for vessels < 0.5 mm in diameter that the spacing between the two vessel lumens could be as close as ∼ 40 μm. Four tomographic cross-sections showing this spacing for a range of hepatic artery and portal vein diameters are shown in Fig. 6.
Figure 6.

Four examples of the frequently observed spacing between the contrast enhanced vessel lumens of the hepatic artery and portal vein, observed by preparation method 1. For vessels < 0.5 mm in diameter, the hepatic artery and portal vein lumens remain constantly spaced at ∼ 40 μm apart (represented by dashed white lines). This spacing is likely the result of the concomitant vessel walls touching (as the vessel walls are not enhanced by contrast).
Figure 7 shows examples of hepatic arteriolo-portal venular shunts. These shunts were observed to occur frequently between hepatic artery and portal vein branch segments ∼ 50 μm in diameter. In addition, Fig. 8 relates a shunt cross-section to the larger 3D volume from which the high-resolution image was generated.
Figure 7.
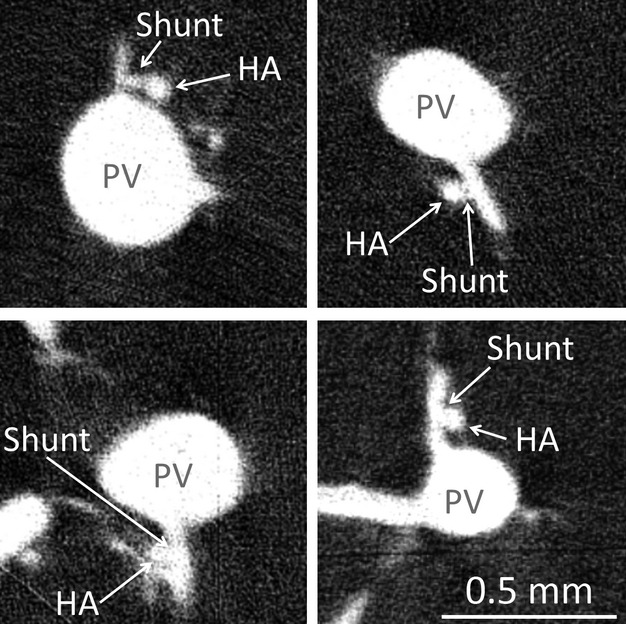
Four examples of observed hepatic arteriolo-portal venular shunts in micro-CT images, observed by preparation method 1. These occur most frequently when a small portal vein branch comes off the main portal vein trunk close to the concomitant hepatic artery vessel.
Figure 8.
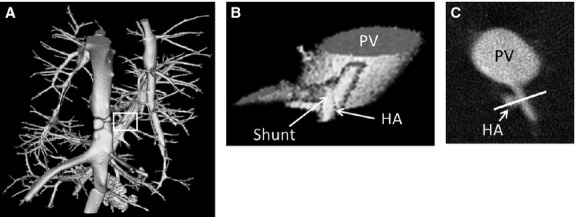
(A) 3D volume rendering of rat caudate lobe sub-volume where the portal vein and hepatic artery were both injected with the contrast agent Microfil®. (B) Zoomed-in view of hepatic arteriolo-portal venular shunt location. (C) 2D cross-section of the same shunt. White line is 0.3 mm in length.
To explore the possibility that these shunts were the result of image blurring (and therefore not real) we performed the simulations presented in the Material and Methods section. Figure 9 simulates how a ∼ 65-μm hepatic artery segment is blurred by the imaging process. For both the hepatic artery and the portal vein, the blurred results (convolving the ideal square wave input with our known blurring function) match very well the measured micro-CT image gray scale values along a line passing through both vessel lumens. Next, we simulated how the concomitant vessels blur together when they lie progressively closer to one another. Figure 10 shows the result of moving the simulated vessels closer, from 40 μm apart, to their lumens being only 5 μm apart. We also added image noise at the level found in large vessel segments [standard deviation of 400 (1000 cm−1)]. If we then compare the blurred result to the line profile of what was taken to be a shunt, a dip in gray scale (representing the separation between the concomitant vessels) is retained up until the separation is ∼ 5 μm (right panel). However, with this small gap between the hepatic artery and portal vein, the summed diameters of the blurred vessels are greater than the overall width of the diameter measured at the shunt location.
Figure 9.
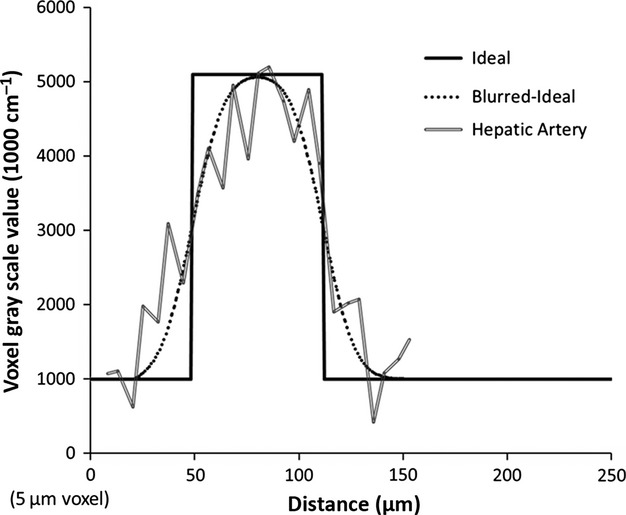
Comparison of simulated hepatic artery line profile with measured profile near shunt location (double line). Ideally, the vessel profile is a square-wave (solid line). However, the non-ideal modulation transfer function of the micro-CT scanner, as well as other issues such as partial volume effects, caused the profile to blur. Utilizing our known blurring function closely predicts what is measured in the micro-CT image (dotted line versus double line).
Figure 10.
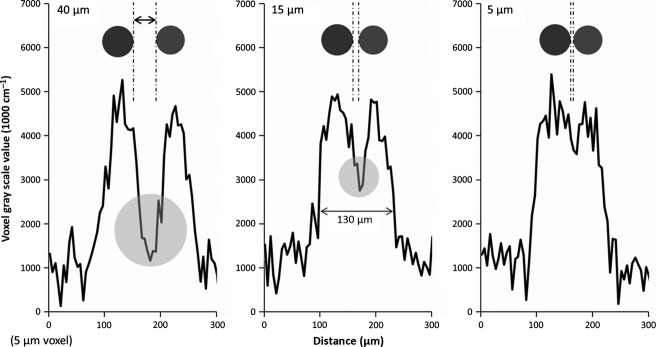
Simulation of varying spacing between hepatic artery and portal vein. The simulations show the line profiles generated between adjacent hepatic artery (65 μm in diameter) and portal vein (50 μm in diameter) separated by varying lumen distances of 40 (left), 15 (middle) and 5 μm (right). The 40-μm result retains much of the dip (circle) resulting from the spacing between the two lumens. Even at a separation of 15 μm a dip in gray scale is still evident (circle in middle plot). At about 5 μm lumen distance (right) the vessels are indistinguishable. However, this separation does not represent the width of the measured shunt.
Utilizing the measured diameters of the hepatic artery and portal vein, and including a 15-μm shunt, results in a close match to the line profile across the observed shunt, as shown in Fig. 11.
Figure 11.
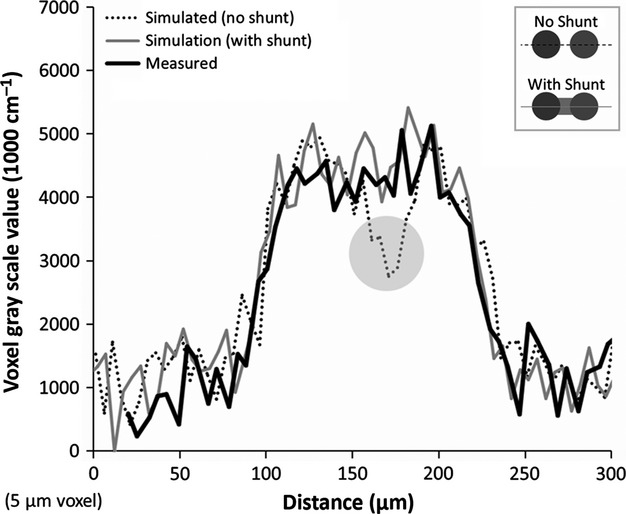
Comparing the line profile generated across a shunt with what we would expect to see if the hepatic artery and portal vein lumens were either (1) not connected or (2) connected by the approximate shunt length (15 μm). This is a close fit to what is evident when a connection exists. Thus, the observed hepatic arteriolo-portal venular shunts appear to be real connections that cannot be explained by image blurring between the hepatic artery and portal vein.
Discussion
The existence of hepatic shunts between the portal vein and hepatic artery is still debated in the current literature. Knowledge of intrahepatic shunts (shunts between the portal vein and hepatic vein) have been the focus of a number of studies, where their existence has both been confirmed at diameters of up to 80–90 μm (Li et al. 2003) as well as ruled out for > 15 μm diameter shunts (Kassissia et al. 1994) in rat liver specimens. In addition, hepatic arteriolo-portal venular shunts (shunts between the hepatic artery and portal vein, as related in this study) have been both supported (Matsui et al. 1986) and rejected (Alexander et al. 2001).
The frequently observed spacing (∼ 40 μm) found in our study between the lumens of the hepatic artery and portal vein, will be useful for future studies, as this sets a limit on the lower bound of image resolution required to separate the two vessel systems. This spacing led to difficulties in distinguishing the two vessel systems at 20-μm voxel resolution images and motivated the development of an automated segmentation approach to separate the concomitant hepatic artery and portal vein.
Two observations in this study provide further evidence for not only the existence of hepatic arteriolo-portal venular shunts but also a potential one-way valve-like mechanism: (1) the hepatic artery does not show up when the portal vein is injected, but both vessel systems are shown when only the hepatic artery is injected, and (2) when a different contrast is injected into the hepatic artery (as compared with the contrast injected into the portal vein), the hepatic artery contrast is observed within the portal vein. These results are consistent with the existence of a one-way valve-like mechanism. This concept is illustrated in Fig. 12, where the valve is closed in the case of the portal vein injection (with contrast only filling the portal vein), and open in the case of the hepatic artery injection (allowing contrast to travel into the portal vein). The extent to which this one-way shunting is dependent on the pressure differences between the hepatic artery and portal vein, or absolute pressures, is beyond the scope of this study. If mixing only occurred at the sinusoidal level, compensation would be possible, but it would seem that the pressure in the hepatic artery and portal vein would be more difficult to control in response to changes in blood flow in either vessel. Attempts were made to control injection pressures and flow rate. However, it is possible that the observed one-way valve-like mechanism became apparent due to a higher hepatic artery pressure and a lower portal vein pressure than occur under physiological conditions. Also, the differences in viscosity between the contrast agents and blood further complicate this, being the last word on the mechanics of the observed shunt. Finally, this research found 3D visual anatomic evidence for hepatic arteriolo-portal venular shunts. The shunts occurred between hepatic artery and portal vein branches each ∼ 50 μm in diameter. Obtaining a definitive measurement of the length and diameter of the lumen and any smooth muscle component of the wall of the shunts would be of interest to further understand the role of these shunts, as the shunts might undergo changes through dilation and contraction and the anatomic snapshot (as is obtained by micro-CT) may not convey this dynamic information accurately.
Figure 12.
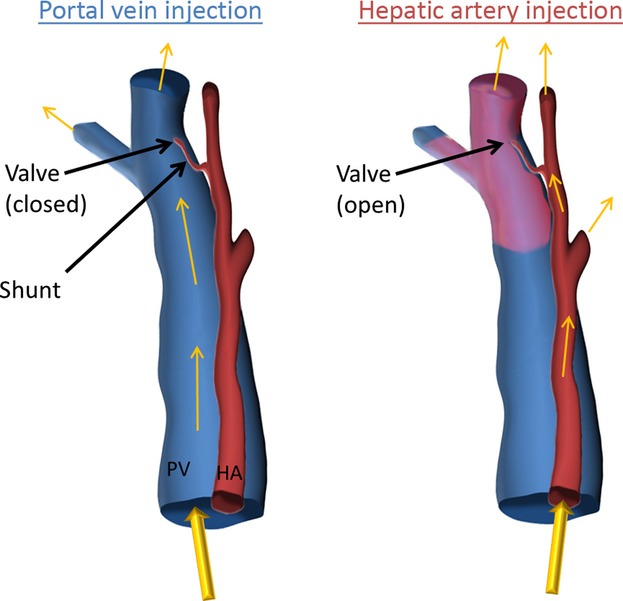
Illustration of one-way valve-like mechanism of hepatic arteriolo-portal venular shunts. Where contrast is injected only into the portal vein, only the portal vein is present, since the shunt is closed and does not allow flow from the portal vein into the hepatic artery. Where contrast is injected only into the hepatic artery, the valve is opened (the portal vein being at low pressure due to no contrast being injected) and contrast fills both the hepatic artery and the portal vein. This illustration explains the results presented in Figs 4 and 5.
This manuscript utilized micro-CT to answer a physiological question. The largest drawback to using micro-CT is that micro-CT imaging provides a snapshot in time. Sample preparation, scanning, and analysis all attempted to draw a conclusion about the dynamic biological system in one particular state, at one moment in time.
Conclusions
By studying high-resolution 3D micro-CT images of the contrast-enhanced vasculature of rat livers, we observed that: (1) there exists a common spacing of ∼ 40 μm between the lumens of the hepatic artery and portal vein, (2) there is 3D anatomic evidence for the existence of hepatic arteriolo-portal venular shunts, and (3) these connections appear to behave similarly to a one-way valve-like connection from the distal hepatic artery to the portal vein (allowing blood from the hepatic artery to flow into the portal vein, but not the other way around).
Acknowledgments
The authors would like to thank Ms Delories C. Darling for her help in the preparation of this manuscript.
Authors' contributions
Concept/design: T.L.K., E.L.R.; specimen preparation: J.L.A., B.E.K.; micro-CT scanning: S.M.J.; image reconstruction: A.J.V.; data analysis/interpretation: T.L.K.; drafting of manuscript: T.L.K.; editing and revision of manuscript: ELR, T.L.K. The final version of manuscript was approved by all authors.
Conflict of interest
None of the authors have any conflict of interest.
References
- Alexander B, Cottam H, Naftalin R. Hepatic arterial perfusion regulates portal venous flow between hepatic sinusoids and intrahepatic shunts in the normal rat liver in vitro. Eur J Physiol. 2001;443:257–264. doi: 10.1007/s004240100682. [DOI] [PubMed] [Google Scholar]
- Bollman JL, Khattab M, Thors R, et al. Experimentally produced alterations of hepatic blood flow. Arch Surg. 1953;66:562–570. doi: 10.1001/archsurg.1953.01260030577025. [DOI] [PubMed] [Google Scholar]
- Feldkamp LA, Davis LC, Kress JW. Practical cone-beam algorithm. J Opt Soc Am A. 1984;1:612–619. [Google Scholar]
- Jorgensen SM, Demirkaya O, Ritman EL. Three-dimensional imaging of vasculature and parenchyma in intact rodent organs with x-ray micro-CT. Am J Physiol Heart Circ Physiol. 1998;275:H1103–H1114. doi: 10.1152/ajpheart.1998.275.3.H1103. [DOI] [PubMed] [Google Scholar]
- Kassissia I, Brault A, Huet PM. Hepatic artery and portal vein vascularization of normal and cirrhotic rat liver. Hepatology. 1994;19:1189–1197. [PubMed] [Google Scholar]
- Kline TL, Ritman EL. Studying microcirculation with micro-CT. In: Leahy, M, editors. Microcirculation Imaging. Weinheim: Wiley-VCH; 2012. pp. 313–348. [Google Scholar]
- Lautt WW. Relationship between hepatic blood flow and overall metabolism: the hepatic arterial buffer response. Fed Proc. 1983;42:1662–1666. [PubMed] [Google Scholar]
- Li X, Benjamin IS, Naftalin R, et al. Location and function of intrahepatic shunts in anaesthetised rats. Gut. 2003;52:1339–1346. doi: 10.1136/gut.52.9.1339. [DOI] [PMC free article] [PubMed] [Google Scholar]
- Marxen M, Thornton MM, Chiarot CB, et al. Micro-CT scanner performance and considerations for vascular specimen imaging. Med Phys. 2004;31:305–313. doi: 10.1118/1.1637971. [DOI] [PubMed] [Google Scholar]
- Matsui O, Kawamura I, Takashima T. Occurrence of an intrahepatic porto-arterial shunt after hepatic artery embolization with gelfoam powder in rats and rabbits. Acta Radiol Diagn. 1986;27:119–122. doi: 10.1177/028418518602700124. [DOI] [PubMed] [Google Scholar]
- Murad SD, Dom VAL, Ritman EL, et al. Early changes of the portal tract on microcomputed tomography images in a newly- developed rat model for Budd-Chiari syndrome. J Gastroenterol Hepatol. 2008;23:1561–1566. doi: 10.1111/j.1440-1746.2008.05403.x. [DOI] [PubMed] [Google Scholar]
- Richter S, Vollmar B, Mucke I, et al. Hepatic arteriolo-portal venular shunting guarantees maintenance of nutritional microvascular supply in hepatic arterial buffer response of rat livers. J Physiol. 2001;531:193–201. doi: 10.1111/j.1469-7793.2001.0193j.x. [DOI] [PMC free article] [PubMed] [Google Scholar]
- Ritman EL. Current status of developments and applications of micro-CT. Annu Rev Biomed Eng. 2011;13:531–552. doi: 10.1146/annurev-bioeng-071910-124717. [DOI] [PubMed] [Google Scholar]
- Schambach SJ, Bag S, Groden C, et al. Vascular imaging in small rodents using micro-CT. Methods. 2010;50:26–35. doi: 10.1016/j.ymeth.2009.09.003. [DOI] [PubMed] [Google Scholar]
- Sinnatamby CS. Last's Anatomy: Regional and Applied. Edinburgh: Elsevier Health Sciences; 2006. p. 584. [Google Scholar]
- Soskin S, Essex HE, Herrick JF, et al. The mechanism of regulation of the blood sugar by the liver. Am J Physiol. 1938;124:558–567. [Google Scholar]
- Ternberg JL, Butcher HR. Blood-flow relation between hepatic artery and portal vein. Science. 1965;150:1030–1031. doi: 10.1126/science.150.3699.1030. [DOI] [PubMed] [Google Scholar]
- Wan SY, Kiraly AP, Ritman EL, et al. Extraction of the hepatic vasculature in rats using 3-D micro-CT images. IEEE Trans Med Imaging. 2000;19:964–971. doi: 10.1109/42.887843. [DOI] [PubMed] [Google Scholar]


