

Abstract
MicroRNAs (miRNAs) are highly conserved small RNAs which regulate gene expression primarily through base pairing to the 3′ untranslated region of target messenger RNA (mRNA), leading to mRNA degradation or translation inhibition depending on the complementarity between the miRNA and target mRNA. Single miRNA regulates multiple target mRNA. miRNAs have been shown to regulate gene expression in the hematopoietic stem cells, as well as at key decision points for various lineages. However, aberrant expression of miRNAs has been documented in cancer and disease models. Rigorous dissection of miRNA pathways and biology requires facile loss of function modeling. This chapter describes detailed protocol for knockdown miRNA-21 which is involved in myelopoiesis using antagomiRs in primary murine bone marrow stem/progenitor cells.
Keywords: microRNA, Antagomir, Murine bone marrow cells, Drug delivery
1. Introduction
MicroRNAs (miRNAs) are endogenous regulatory small RNA molecules of about 17–22 nucleotides in length and have been described recently as modulators of gene activity. miRNAs are expressed as primary miRNA transcripts which are processed to precursor miRNA and then acted upon by DROSHA–DGCR protein complexes to form mature miRNAs (1). miRNA binds to target messenger RNA resulting in posttranscriptional or post-translational repression (2). Almost 700 miRNAs have been identified in humans regulating a predicted one-third of protein-coding genes. Moreover, one miRNA is believed to target multiple mRNAs; similarly one mRNA may be targeted by multiple miRNA highlighting the complex nature of gene expression regulation (3). However, the role of miRNA in physiological and pathological processes is still emerging with mounting evidence to suggest that miRNAs are involved in a remarkable spectrum of biological pathways (4, 5). Different sets of miRNAs are expressed in different cell types and tissues which likely reflect distinct and highly specific regulatory processes. Aberrant expression of miRNAs has been implicated in numerous disease states (6, 7).
Pluripotent hematopoietic stem cells (HSCs) express a variety of lineage-specific miRNAs which may enforce lineage commitment by limiting the expression of proteins from alternative lineages (8). Understanding the role of miRNAs in hematopoietic stem/progenitor cells (HSPCs) requires strategies utilizing over-expression and/or efficient loss-of-function. We have accomplished this through a variety of in vitro assay systems such as colony- forming cell-unit (CFU) assays. The clonogenic hematopoietic (CFU) assay detects progenitor cells committed to a specific lineage by plating HSPCs into semisolid media such as methylcellulose together with cytokines and hematopoietic growth factors to stimulate clonal proliferation into myeloid-restricted lineages that include granulocyte, monocyte, and erythrocyte cells. Overexpression studies are performed by using vectors or chemically engineered oligonucleotides that “mimic” mature miRNA and have the potential to treat or cure cancers (9, 10). In loss-of-function studies, vectors for miRNA knockdown (11, 12) or modified antisense oligonucleotides for mature miRNA known as antagomiRs have been used (13). In this chapter, we describe an in vitro and in vivo assay model to reduce miRNA-21 function in murine bone marrow cells.
2. Materials
2.1. Lineage Depletion and Colony-Forming Unit Assay
Lineage Cell Depletion Kit for mouse, AutoMACS™ Separator, and magnetic column.
Running Buffer: PBS (phosphate buffered saline) pH 7.2, 0.5% BSA (bovine serum albumin), 2 mM EDTA.
Rinsing Buffer: PBS pH 7.2, 2 mM EDTA.
70% alcohol.
Cytokines: mSCF; 10 μg, mIL-3, 10 μg.
StemSpan and MethoCultGF.
45 μM cell strainer.
0.45 μM syringe filter.
6 cm tissue culture grid plate.
Non-treated tissue culture plates: BD Multi-well cell culture plate 24-well, 6-well.
AntagomiRs.
2.2. Immunoblotting
Complete Lysis M Buffer.
Protease Buffer.
10% Separating gel; 0.375 M Tris–HCl, pH 8.8, 10% Acrylamide, 0.1% SDS, 0.1% TEMED, 0.1% APS.
5% Stacking gel; 0.125 M Tris–HCl, pH 6.8, 5% Acrylamide, 0.1% SDS, 0.1% TEMED, 0.1% APS.
SDS-Polyacrylamide Gel Electrophoresis (SDS-PAGE) running buffer: 25 mM Tris base, 250 mM glycine, 0.1% SDS.
Transfer buffer: 25 mM Tris base, 192 mM Glycine, 20% methanol.
Polyvinylidene difluoride (PVDF) membrane (Immobilon-P IVPH00010).
Phosphate-buffered saline with Tween (PBST) 1× PBS, 0.05% Tween 20.
Blocking buffer: 5% nonfat dry milk in PBST.
Enhance chemiluminescent (ECL) plus western blotting detection system.
Stripping buffer: 0.1 M Glycine, 125 mM HCl.
2.3. Surgery and Implanting the Pumps
Alzet Osmotic Pumps.
1 mL Syringe with pump loading needle.
1 mL Syringe with 27G needle for Avertin delivery and Brupenex.
Wound Stapler and Wound Clips.
Blunt-tip dissection scissors.
Sharp Scissors.
Two pairs of forceps (45°).
Shaver.
0.9% Sterile saline.
Isoflurane.
Avertin (anesthetic); prepare a stock solution by dissolving 25 g of avertin in 15.5 mL of tert-Amyl alcohol and the working solution (1.2%) was prepared by diluting 0.5 mL of avertin stock with 39.5 mL 0.9% saline (working solution). Inject ~250 μL/mouse.
Brupenex (analgesic).
6–8-week-old C57/B6 mice.
3. Methods
The design of a specific antagomiR for an miRNA loss-of-function phenotype requires the knowledge of the mature miRNA sequence. The most common Web site that offers miRNA sequences is miR-Base (www.mirbase.org) (14) (see Note 1).
3.1. Designing antagomiR
Example of antagomiR template design
Example—miRNA-21
Target mature miRNA sequence
5′-UAG CUU AUC AGA CUG AUG UUG A-3′
-
Antisense mature miRNA sequence
3′-AUC GAA UAG UCU GAC UAC AAC U-5′
-
AntagomiR
5′-U CAA CAU CAG UCU GAU AAG CUA-3′
-
Mutant AntagomiR (control)
5′-U CAA CUU CAG UCA GAA AAG GUA-3′
3.2. Synthesis of antagomiR
AntagomiRs are synthetic 2-O-methyl RNA oligos of about 21–23 nucleotides which fully complement the miRNAs and effectively compete with miRNA target mRNAs with a stronger binding to the miRNA-associated gene silencing complexes (miRNA-RISCs). AntagomiRs were synthesized and purchased from Dharmacon. AntagomiRs were synthesized with 2′-OMe modified bases (2′-hydroxyl of the ribose is replaced with a methoxy group), phosphorothioate (phosphodiester linkages are changed to phosphorothioates) on the first two and last four bases, and an addition of cholesterol motif at 3′ end through a hydroxyprolinol modified linkage. The addition of 2′-OMe and phosphorothioate modifications improve the bio-stability whereas cholesterol conjugation enhances distribution and cell permeation of the antagomiRs (15). AntagomiR oligonucleotides are deprotected, desalted, and purified by high-performance liquid chromatography.
3.3. Preparing the antagomiR
Centrifuge the tube briefly to pellet.
Reconstitute the antagomiR (powder) with nuclease-free sterile water at 3× dosing concentration.
Mix the suspension at room temperature until the antagomiR fully goes into the solution (see Note 2).
Filter the antagomiR through a 0.45 μM syringe filter.
To calculate the concentration, dilute a small aliquot of antagomiR to 1/250 to 1/500 dilution and determine the Optical Density (OD) using Nanodrop.
-
Example: For calculating mM concentration and mg/mL using extinction coefficient and molecular weight:
If you know the molar concentration, it is easy to prepare a stock solution, e.g., if you get 250 nM of antagomiRs, dissolving in 500 μL of water gives you a 500 μM stock solution.
Keep the antagomiR in small aliquots to avoid freeze and thaw and for long-term storage at −20°C.
3.4. In Vitro Assay
3.4.1. Isolating Mouse Bone Marrow Cells
Flush the bone marrow cells from both femur and tibias with Medium 199 using a syringe and a 23 gauge needle.
Disaggregate the cells by gentle pipetting and pass the cells through 70 μm Nylon cell strainer to remove cell clumps and bone pieces.
Wash the cells by adding running buffer and centrifuge at 300×g for 10 min at 4–8°C.
Pipette off the supernatant completely.
Resuspend the cell pellet in running buffer and determine the cell number.
Label the cells with Lineage cells depletion kit according to the manufacturer’s instructions.
Centrifuge at 300 × g for 10 min and resuspend cell pellet in 40 μL of buffer per 107 total cells.
Add 10 μL of Biotin–Antibody Cocktail per 107 total cells.
Mix well and incubate on ice for 10 min.
Add 30 μL of buffer per 107 total cells.
Add 20 μL of Anti-biotin MicroBeads per 107 total cells.
Mix well and incubate on ice for additional 15 min.
Wash cells by adding 1–2 mL of buffer per 107 cells and centrifuge at 300 × g for 10 min.
Resuspend up to 108 cells in 500 μL of buffer.
Purify the lineage negative cells using AUTOMACS magnetic sorter or magnetic column.
Collect the Linage negative cells and wash the cells with PBS with 0.5% FBS and count the cells.
3.4.2. Inhibiting microRNA Activity
For liquid culture, the cells are maintained at a density of 5×10⁵ cell/mL in serum-free medium, 25 ng/mL mSCF, 20 ng/mL IL6, and 10 ng/mL IL3, and incubate at 37°C, 5% CO2, 100% humidity in a cell culture incubator.
For antagomiR treatment, add 1 μL of 100 μM stock solution to 1 mL of culture medium to get a final concentration of 100 nM in a 24-well non-tissue culture plate.
Mix well and incubate the cells in the cell culture incubator.
Assay for Target Gene Activity: Taqman Expression
For mature miRNA expression analysis, total cellular RNA is extracted from antagomiR-treated cells and subjected to specific miR-qRT-PCR. As shown in Fig. 1a, murine bone marrow treated with antagomiR-21 shows a reduced level of mature miR-21 compared to the cell treated with specific mutant control.
Fig. 1.

Silencing miR-21 using antagomiR-21 (a) in liquid culture (b) in vivo in mice. For in vitro assay, wild-type Lin-bone marrow cells were treated with either control or antagomiR-21 at a concentration of 100 nM for 72 h. For in vivo assay, the mice were implanted with either control or antagomiR-21 and the expression of mature miR-21 is normalized to control mice (set as 1). The results shown here are from individual mice.
To check endogenous miRNA expression, isolate total cellular RNA from the treated cells using TRI reagent at various time points (24, 48, 72 h).
Reverse transcribe the RNA using TaqMan® MicroRNA Reverse Transcription Kit, according to the manufacturer’s protocol using the commercially available assay for specific mature miRNA.
Perform the amplification reaction using specific miRNA taqman probe on ABI Prism 7900 amplification system.
Normalization and analysis of miRNA expression can be calculated using the comparative 2ΔΔ Ct method relative to snRNA-U6.
Immunoblotting Analysis of miRNA Target Proteins
Effective miRNA silencing should result in upregulation of miRNA target proteins. AntagomiR functionality can be analyzed by using an immunoblotting approach. As shown in Fig. 2 mouse bone marrow cells treated with antagomiR-21 show an increased level of miR-21 target protein Pten (phosphatase and tensin homology) as compared to control-treated cells.
Fig. 2.
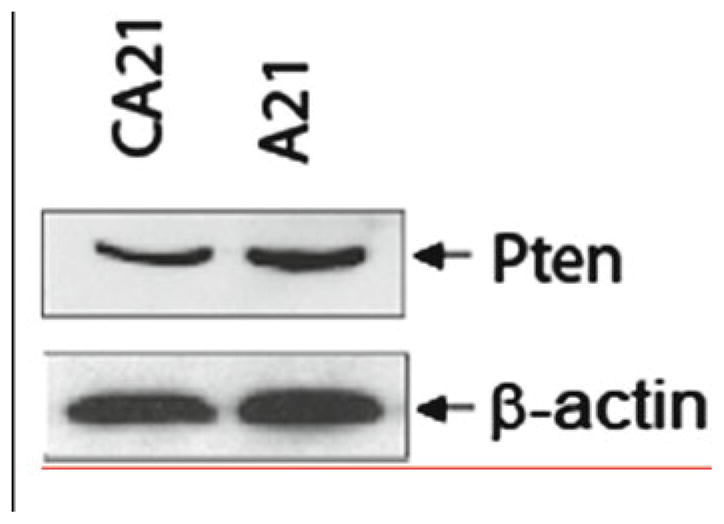
Effect of miR-21 knockdown on its target protein Pten in wild-type mouse bone marrow cells. Cells were treated with either control or antagomiR-21 in liquid culture, harvested with protein lysate after 72 h, and analyzed with respective antibodies.
Wash the cells twice with cold 1× PBS, add cold Complete M Lysis buffer, and isolate protein according to the manufacturer’s instruction.
Separate 40 μg of protein by electrophoresis on 10% SDS-PAGE under reducing and denaturing conditions (100 V and 40 mA for 2 h).
After gel electrophoresis, proteins are transferred to a PVDF membrane (15 V for 30 min).
Incubate the membrane in blocking buffer for 1 h at room temperature, followed by washing three times with 1× PBST.
Add primary antibody in blocking buffer and incubate the membrane overnight at 4°C.
Wash the membrane three times with 1× PBST and incubate with horseradish peroxidase (HRP)-conjugated secondary antibody for 1 h at room temperature.
Wash the membrane three times with 1× PBST.
Use ECL plus system to visualize the immune complexes.
For reprobing, incubate the membrane at room temperature for 1 h in stripping buffer followed by intensive washing with 1× PBST.
The membrane is then ready to be used for probing for beta-Actin as loading control.
Assay for Biological Activity: Colony-Forming Unit Assays
Phenotypic analysis of proliferation, survival, and differentiation of treated cells can be easily monitored by several standard techniques. As we have published (16) and shown in Fig. 3a, mouse bone marrow cells treated with antagomiR-21 show a decrease in total colony numbers with a specific increase in the monocytic colonies (CFU-M).
Fig. 3.

Biological assay to confirm the silencing of miR-21 with antagomiRs. (a) Colony-forming unit from the control- and antagomiR-21-treated wild Lin-bone marrow cells showing lower total colony number, specifically reduced monocytic colonies. (b) Representative picture showing CFU-M, CFU-G, and CFU-GM.
For CFU assay, take 5 × 10³ Lin-mouse bone marrow cells in 100 μL of StemSpan in a 5 mL tube and add 1 μL of 100 μM antagomiR.
Incubate the cells with antagomiR on ice for 30 min.
Add 1 mL of room-temperature MethoCultGF M3535 to the 5 mL tube (see Note 3).
Mix the cells vigorously with a 2 mL pipette and keep it in room temperature for 5 min to get rid of air bubbles.
Plate the cells on a grid plate for easy scoring and incubate in cell culture incubator.
Count colonies after 7–10 days, score the colonies which contain more than 50 cells, and differentiate based on their morphology (CFU-G, CFU-M, CFU-GM) (Fig. 3b). (CFU-G, progenitors of granulocytes, give rise to eosinophils, basophils, or neutrophils; CFU-M, progenitors of macrophages, give rise to macrophages; CFU-GM, progenitors, give rise to a heterogeneous population of macrophages and granulocytes.)
3.5. In Vivo Assay
For a continuous dosing, miniature infusion (osmotic) pumps provide a convenient and reliable method for controlled delivery of drugs. Osmotic pumps are extensively used to study the effects of compounds in vivo, because they eliminate frequent animal handling, repetitive injection schedules, and ensure the delivery of drugs at a constant dose.
3.5.1. Loading the antagomiRs
-
Prepare antagomiR solution of known concentration to load into the pump (ensure that solutions are at room temperature) (see Note 4).
Example: A Model 2006 pump with a mean pumping rate of 0.15 μL/h is filled with 240 μL and implanted for 42 days. Upon removal, approximately 70–80 μL can be aspirated from the reservoir. So, one can assume that approximately 151 μL would be infused during the 42-day infusion period:This would leave a residual volume of 70–80 μL (which give an extra 20 days, 3.6 μL/day).
Wear gloves and carefully load antagomiRs into the pump. Use the blunt-tip needles supplied with the pumps. Do this by moving the plunger to 0.1 mL and then drawing up the fluid slowly. This ensures that all of the liquid leave the syringe (see Note 5).
Hold the pump in an upright position, with the exit port pointed vertically.
Slowly load the antagomiR to the pump by putting the loading needle to the bottom of the pump and loading until the liquid reaches the surface of the pump. Make sure that no air bubbles are in the pump.
Wipe off the excess solution and insert the flow moderator directly into the pump making sure that the cap is flushed with the top of the pump.
The insertion displaces some of the liquid from the filled pump through the exterior hole. (Moderator must be straight to work properly. This can make the pump not work.)
Place the pump in a 50 mL conical tube with about 20 mL of 0.9% saline (see Note 6).
3.5.2. For Subcutaneous Placement of Pump
Inject the mouse with 250 μL of Avertin and 30–40 μL of Brupenex and let it go to sleep.
Once the mouse is anesthetized, shave a patch of hair from the back on the neck right behind the ears with the electric shaver.
Clean the shaved area with alcohol swab.
Make a small insertion/cut in the skin (big enough for the pump) using the sharp scissors and use the blunt-tipped scissors to loosen the subcutaneous connective tissue apart under the skin.
Insert the Alzet Osmotic pump (moderator in first) into the animal and push it deep into the body to place subcutaneously.
Use 1–2 wound clips to close wound entirely.
Keep mouse warm during the recovery as long as possible.
Mice can be housed together with the wound clips.
Assay for Target Gene Activity: Taqman Expression
As shown in Fig. 1b, the efficacy of antagomiR-21 in silencing endogenous mature miR-21 was confirmed in the peripheral blood.
Collect peripheral blood from the control- and antagomiR-21-treated mice using standard bleeding technique described in an approved protocol (retro-orbital, jugular vein, tail vein).
Lyse the red blood cells using ACK lysis buffer and wash with cold 1× PBS.
To validate the miRNA expression, extract total cellular RNA from the white blood cells using TRI reagent and perform the microRNA TaqMan assay as described previously.
Acknowledgments
This work was partially supported by grants from Alex’s Lemonade Stand, and NIH R21 CA142601 and R01 CA159845 (H.L.G.).
Footnotes
Mature miRNA sequences can differ between species. It is important to consider this fact for antagomiR design as well as for mature miRNA detection using specific microRNA Taqman.
Heat at 55°C for 15 min if necessary.
Thaw the MethoCult and shake the bottle vigorously to thoroughly mix the contents. Allow air bubbles to escape by placing the bottle at room temperature for at least 1 h.
AntagomiRs are dosed at a concentration of 80 mg/kg.
Make sure that you filter the antagomiR through a 0.22 μM filter to ensure the sterility. Also use sterile technique while filling, handling, and implanting Alzet Osmotic pumps.
Place the pumps with saline for at least 4–60 h before implantation (depends upon the pump used) in order to prime the pumps for continuous delivery of the drugs.
References
- 1.Nakasa T, Nagata Y, Yamasaki K, Ochi M. A mini-review: MicroRNA in Arthritis. Physiol Genomics. 2011;43(10):566–70. doi: 10.1152/physiolgenomics.00142.2010. [DOI] [PubMed] [Google Scholar]
- 2.Lewis BP, Burge CB, Bartel DP. Conserved seed pairing, often flanked by adenosines, indicates that thousands of human genes are microRNA targets. Cell. 2005;120:15–20. doi: 10.1016/j.cell.2004.12.035. [DOI] [PubMed] [Google Scholar]
- 3.Zhdanov VP. Conditions of appreciable influence of microRNA on a large number of target mRNAs. Mol Biosyst. 2009;5:638–43. doi: 10.1039/b808095j. [DOI] [PubMed] [Google Scholar]
- 4.Shah AA, Meese E, Blin N. Profiling of regulatory microRNA transcriptomes in various biological processes: a review. J Appl Genet. 2010;51:501–7. doi: 10.1007/BF03208880. [DOI] [PubMed] [Google Scholar]
- 5.Chen CZ, Li L, Lodish HF, Bartel DP. MicroRNAs modulate hematopoietic lineage differentiation. Science. 2004;303:83–6. doi: 10.1126/science.1091903. [DOI] [PubMed] [Google Scholar]
- 6.Calin GA, Croce CM. MicroRNA signatures in human cancers. Nat Rev Cancer. 2006;6:857–66. doi: 10.1038/nrc1997. [DOI] [PubMed] [Google Scholar]
- 7.Calin GA, Sevignani C, Dumitru CD, Hyslop T, Noch E, Yendamuri S, Shimizu M, Rattan S, Bullrich F, Negrini M, Croce CM. Human microRNA genes are frequently located at fragile sites and genomic regions involved in cancers. Proc Natl Acad Sci USA. 2004;101:2999–3004. doi: 10.1073/pnas.0307323101. [DOI] [PMC free article] [PubMed] [Google Scholar]
- 8.Chen CZ, Li L, Lodish HF, Bartel DP. MicroRNAs modulate hematopoietic lineage differentiation. Science. 2004;303:83–6. doi: 10.1126/science.1091903. [DOI] [PubMed] [Google Scholar]
- 9.Trang P, Wiggins JF, Daige CL, Cho C, Omotola M, Brown D, Weidhaas JB, Bader AG, Slack FJ. Systemic Delivery of Tumor Suppressor microRNA Mimics Using a Neutral Lipid Emulsion Inhibits Lung Tumors in Mice. Mol Ther. 2011;19(6):1116–22. doi: 10.1038/mt.2011.48. [DOI] [PMC free article] [PubMed] [Google Scholar]
- 10.Todesco M, Rubio-Somoza I, Paz-Ares J, Weigel D. A collection of target mimics for comprehensive analysis of microRNA function in Arabidopsis thaliana. PLoS Genet. 2010;6:e1001031. doi: 10.1371/journal.pgen.1001031. [DOI] [PMC free article] [PubMed] [Google Scholar]
- 11.Gentner B, Schira G, Giustacchini A, Amendola M, Brown BD, Ponzoni M, Naldini L. Stable knockdown of microRNA in vivo by lentiviral vectors. Nat Methods. 2009;6:63–6. doi: 10.1038/nmeth.1277. [DOI] [PubMed] [Google Scholar]
- 12.Scherr M, Venturini L, Eder M. Lentiviral vector-mediated expression of pre-miRNAs and antagomiRs. Methods Mol Biol. 2010;614:175–85. doi: 10.1007/978-1-60761-533-0_12. [DOI] [PubMed] [Google Scholar]
- 13.Mattes J, Yang M, Foster PS. Regulation of microRNA by antagomirs: a new class of pharmacological antagonists for the specific regulation of gene function? Am J Respir Cell Mol Biol. 2007;36:8–12. doi: 10.1165/rcmb.2006-0227TR. [DOI] [PubMed] [Google Scholar]
- 14.Griffiths-Jones S. miRBase: the microRNA sequence database. Methods Mol Biol. 2006;342:129–38. doi: 10.1385/1-59745-123-1:129. [DOI] [PubMed] [Google Scholar]
- 15.Cooper SR, Taylor JK, Miraglia LJ, Dean NM. Pharmacology of antisense oligonucleotide inhibitors of protein expression. Pharmacol Ther. 1999;82:427–35. doi: 10.1016/s0163-7258(99)00002-9. [DOI] [PubMed] [Google Scholar]
- 16.Velu CS, Baktula AM, Grimes HL. Gfi1 regulates miR-21 and miR-196b to control myelopoiesis. Blood. 2009;113:4720–8. doi: 10.1182/blood-2008-11-190215. [DOI] [PMC free article] [PubMed] [Google Scholar]