

Abstract
Background
Despite evidence supporting pre-exposure prophylaxis (PrEP) efficacy, there are concerns regarding the feasibility of widespread PrEP implementation among men who have sex with men (MSM). To inform the development of targeted PrEP delivery guidelines, we characterized sexual risk trajectories among HIV-negative MSM.
Methods
At semiannual visits from 2003–2011, HIV-negative MSM (N=419) participating in the Multicenter AIDS Cohort Study provided data on sexual risk behaviors since their last visit. Based on reported behaviors, participants were assigned a sexual risk behavior (SRB) score at each visit as follows: (0) no insertive or receptive anal intercourse (IAI/RAI), (1) no unprotected IAI/RAI (UIAI/URAI), (2) only UIAI, (3) URAI with 1 HIV-negative partner, (4) condom-serosorting, (5) condom-seropositioning, and (6) no seroadaptive behaviors. Group-based trajectory modeling was used to examine SRB scores (<4 vs. ≥4) and identify groups with distinct sexual risk trajectories.
Results
Three sexual risk trajectory groups were identified: low risk (N=264; 63.0%), moderate risk (N=96; 22.9%; mean duration of consecutive high risk intervals~1 year), and high risk (N=59; 14.1%; mean duration of consecutive high risk intervals~2 years). Compared to low risk group membership, high risk group membership was associated with younger age (in years) (adjusted odds ratio [AOR]=0.92, 95% confidence interval [CI]: 0.88–0.96), being White (AOR=3.67, 95% CI: 1.48–9.11), earning an income ≥$20,000 (AOR=4.98, 95% CI: 2.13–11.64), distress/depression symptoms (CESD≥16) (AOR=2.36, 95% CI: 1.14–4.92), and substance use (AOR=2.00, 95% CI: 1.01–3.97).
Conclusion
Screening for the socio-demographic and behavioral factors described above may facilitate targeted PrEP delivery during high risk periods among MSM.
Keywords: sexual risk behavior, MSM, pre-exposure prophylaxis, trajectory analysis
Introduction
Daily oral pre-exposure prophylaxis (PrEP), a biomedical intervention for HIV prevention, reduces the risk of HIV acquisition between 44 and 75% depending on the population.1–4 Although demonstration projects assessing the acceptability and feasibility of PrEP use are underway,5 potential barriers to widespread PrEP implementation have been identified and include: adherence, acceptability, behavioral disinhibition, cost, the lack of existing infrastructure for monitoring side effects, and viral resistance among PrEP users who become HIV infected.6–9 Thus, many argue PrEP should only be delivered to high risk populations within comprehensive HIV prevention programs that consist of behavioral, biomedical, and structural interventions.10–11
Given the robust data suggesting PrEP’s efficacy among men who have sex with men (MSM)1 and the high rates of HIV infection within segments of this population,12–13 MSM will likely be a group prioritized for PrEP delivery in the United States (US). Interim recommendations from the Centers for Disease Control and Prevention (CDC) state that PrEP should be offered to MSM “at substantial, ongoing, high risk for acquiring HIV infection.”14 However, little is known about the duration of risk among MSM. Thus, how MSM at ongoing high risk should be identified for PrEP use and how long they will need to take PrEP remain unclear.
Although several repeated cross-sectional studies have examined population trends in sexual risk behaviors among MSM over time,15–17 to our knowledge, previous studies have not specifically investigated patterns of sexual risk behavior within individual HIV-negative MSM over sustained periods of time. One study conducted among older, HIV-positive and HIV-negative MSM identified sexual risk trajectories based on the number of sexual partners reported over time.18 However, the measure of risk used in that study did not consider sexual practices associated with the greatest risk of HIV acquisition, such as unprotected receptive anal intercourse (URAI),19–21 or the HIV status of reported partners. Thus, to better classify and understand longitudinal patterns of risk among MSM, a comprehensive measure of risk that accounts for multiple factors affecting the risk of HIV infection should be employed.
To inform the development of more targeted PrEP delivery guidelines for MSM, we created a comprehensive sexual risk behavior score and used data from the Multicenter AIDS Cohort Study (MACS) to characterize distinct sexual risk trajectories among HIV-negative MSM and identify socio-demographic and behavioral factors associated with longitudinal patterns of risk.
Methods
The MACS is an ongoing prospective study of the natural and treated histories of HIV infection among MSM living in Baltimore, MD; Chicago, IL; Los Angeles, CA; and Pittsburgh, PA. Men were enrolled in the MACS at three time points between 1984 and 1985 (1,814 HIV-positive and 3,140 HIV-negative), 1987 and 1990 (382 HIV-positive and 286 HIV-negative), and 2001 and 2003 (688 HIV-positive and 662 HIV-negative). MACS participants complete study visits every six months during which they are tested for HIV (if HIV-negative), provide a blood sample for storage in a repository for future research, undergo a physical exam, and complete study questionnaires, which collect demographic, psychosocial, behavioral, medical history, and health services data. Audio computer-assisted self-interviewing (ACASI) is used at most MACS sites to collect data on sensitive information, such as sexual behaviors and substance use. More detailed descriptions of the methods used to conduct the MACS have been described elsewhere.22–23 Study protocols were approved by institutional review boards at each of the study sites and all participants provided informed consent.
Sample Selection
We used the following criteria to select HIV-negative participants for inclusion in our sample: (1) enrolled in the MACS between 2001 and 2003, (2) completed visit 40 (between 10/1/2003 and 3/31/2004) or visit 41 (between 4/1/2004 and 9/30/2004) as an HIV-negative participant, and (3) completed ≥1 additional visit by visit 55 (between 4/1/2011 and 9/30/2011). Because HIV infection rates in the US are highest among young (<30 years), racial/ethnic minority MSM,13 we restricted our sample to participants enrolled during the third recruitment wave (2001–2003) as they are younger and more racially/ethnically diverse than participants enrolled at earlier time points. We selected visit 40 as the “index visit” because MACS questionnaires did not begin collecting the HIV status of participants’ insertive anal intercourse (IAI) or receptive anal intercourse (RAI) partners with whom they did not use condoms during IAI/RAI until visit 40. Restricting to this time period (2003–2011) also allowed for an examination of risk within a contemporary population of MSM during the highly active antiretroviral therapy (HAART) era. Participants were followed from their index visit (visit 40/41) to their last study visit, death, or the end of the follow-up period (visit 55), whichever came first. Those who seroconverted over the course of follow-up were censored after their first HIV-positive visit.
Of the 662 HIV-negative MACS participants enrolled between 2001 and 2003, 450 were active members of the cohort at the index visit. Although there was no statistically significant difference in the number of male sexual partners reported, MACS participants who were inactive (i.e., lost to follow-up or deceased) at the index visit were slightly younger, less likely to be White, less educated, and earned a lower income than active members of the cohort. Of active participants at the index visit, 430 completed ≥1 additional visit during the study period. However, only 419 of those participants provided covariate data at the index visit and thus were eligible for inclusion in our sample.
Outcome of Interest: Sexual Risk Behavior
We created a comprehensive sexual risk behavior (SRB) score based on findings from a pooled analysis conducted by Vallabhaneni et al., which examined the association between the practice of seroadaptive behaviors and HIV acquisition among MSM.24 Based on their reported behaviors at semiannual study visits, Vallabhaneni et al. sequentially assigned participants to one of six risk categories at each visit and found that compared to engaging in no unprotected anal intercourse (UAI), condom serosorting (UAI with HIV-negative partners only), condom seropositioning (URAI with HIV-negative partners only), and engaging in high risk sex or no seroadaptive behaviors (URAI with HIV-positive/HIV status unknown partners) were positively associated with HIV acquisition, while engaging in UAI with a single HIV-negative partner was negatively associated with HIV acquisition and only engaging in unprotected insertive anal intercourse (UIAI) was not associated with HIV acquisition.24
At each MACS study visit, participants reported the number of IAI/RAI partners they had since their last visit, the number of partners with whom they used condoms every time during IAI/RAI, and the HIV status of partners with whom they did not use condoms every time during IAI/RAI. We assigned participants SRB scores (0 to 6) at each visit based on their reported behaviors during the 6-month interval since their last visit as described in Table 1. Although we based our SRB score on the risk categories defined by Vallabhaneni et al., there are a few slight differences between their risk categories and the levels of our score. First, to highlight differences between those who did and did not practice anal intercourse (AI), our SRB score contains a separate level for those who did not engage in any AI since their last visit (SRB score=0) and those who engaged in AI, but always used condoms (SRB score=1). Second, because URAI is associated with a greater risk of HIV infection than UIAI,19–21 we assigned participants to our single HIV-negative partner category (SRB score=3) if they engaged in any URAI with a single HIV-negative partner. Those who engaged in UIAI only with a single HIV-negative partner were assigned to our only UIAI category (SRB score=2). Because the risk of HIV acquisition did not increase linearly across the risk categories defined by Vallabhaneni et al.24 it would be inappropriate to examine SRB scores as a continuous outcome. Thus, we assigned 6-month intervals with an SRB score≥4 (i.e., behaviors associated with an elevated risk of HIV acquisition) a value of 1 and 6-month intervals with an SRB score<4 (i.e., behaviors not associated with an elevated risk of HIV acquisition) a value of 0 and used this binary variable as the outcome in our analysis.
Table 1.
Sexual risk behavior (SRB) score.
| Score | Label | Description |
|---|---|---|
| 0 | No IAI or RAI | No IAI or RAI since the last visit |
| 1 | No UIAI or URAI | Only protected IAI or RAI since the last visit, regardless of the number of reported IAI or RAI partners or the HIV status of those partners |
| 2 | Only UIAI | Only unprotected IAI since the last visit, regardless of the number of reported IAI or RAI partners or the HIV status of those partners |
| 3 | URAI with one HIV− partner | Only 1 partner since the last visit and condoms were not used every time during RAI with that partner (regardless of condom use during IAI), but the partner was HIV− |
| 4 | Condom Serosorting | RAI only or IAI and RAI since the last visit (multiple partners)
|
| 5 | Condom Seropositioning | IAI and RAI since the last visit (multiple partners)
|
| 6 | No Seroadaptive Behaviors | RAI only or RAI and IAI since the last visit (1 partner or multiple partners)
|
HIV − = HIV-negative; HIV+ = HIV-positive; IAI = insertive anal intercourse; UIAI = unprotected insertive anal intercourse; RAI = receptive anal intercourse; URAI = unprotected receptive anal intercourse.
Covariates of Interest
We examined the following characteristics measured at the index visit in our analysis: age, race/ethnicity (White vs. non-White), education (<college education vs. ≥college education), annual income (<$20,000 vs. ≥$20,000), distress or depression (Center for Epidemiologic Studies Depression Scale [CESD] score ≥16),25 and reported substance use (methamphetamine, poppers, crack, or other cocaine) since the last study visit. Missing values for education (N=10) and income (N=17) at the index visit were imputed with values provided at the subsequent visit.
Statistical Methods
To identify sub-groups of participants that follow different sexual risk trajectories, we modeled SRB scores (<4 vs. ≥4) over time using Nagin’s group-based trajectory modeling.26 Group-based trajectory models are semi-parametric, finite mixture models fit using maximum likelihood estimation.26 In contrast to traditional growth curve modeling, which identifies a single mean trajectory for an entire population, group-based trajectory modeling identifies clusters or sub-groups of individuals within populations that follow distinct trajectories over time.26
To determine the number of trajectory groups present within our sample, we fit a series of group-based trajectory models with 2 to 5 groups. In selecting the appropriate number of trajectory groups, we considered the following criteria: (1) the Bayesian Information Criterion (BIC), (2) average posterior probabilities of group membership, as a measure of classification quality, (3) group size, and (4) the usefulness of the number of groups in terms of the similarities/differences in their trajectory shapes.26–27 Once the number of groups was decided upon, we varied the shape of the trajectory curves (i.e., zero-order, linear, quadratic, and cubic) and selected the trajectory model with the highest BIC value. Next, we added the covariates of interest to the trajectory model. This allowed for joint estimation of (1) the parameters that describe the shape of trajectory group curves and (2) adjusted odds ratios (AOR) for the relationship between the covariates of interest and trajectory group membership. An advantage of employing this joint estimation process is that it yields standard errors that account for the uncertainty of group assignments.26 To account for potential differences in risk across study sites, our final model included site in addition to the covariates of interest, which were selected based on a priori knowledge of their association with sexual risk behaviors or HIV seroconversion among MSM. Group-based trajectory modeling was conducted using Proc Traj28 in SAS 9.2 (SAS Institute, Inc.; Cary, NC).
To describe the frequency and duration of risk for each trajectory group, we calculated the mean length of consecutive high risk intervals, where intervals were defined as the time between study visits (~6 months) and high risk intervals were defined as intervals with an SRB score≥4. Intervals with no data due to missed visits were assumed to be no or low risk intervals (i.e., SRB score<4) so as not to overestimate the duration of risk.
Results
A total of 419 participants, providing data at 4,834 visits (72.1% of all possible visits during the study period), were included in this study and the mean number of visits was 11.5 (SD=4.3; median=13.0; IQR=8.0–15.0). At the index visit, study participants were racially/ethnically diverse (38.4% White; 42.2% Black; 15.0% Hispanic) and had a mean age of 38.3 years (SD=9.8); ~20% were under 30 years of age (Table 2). Since their last study visit, 42.5% of participants reported having RAI, of which 25.8% reported having URAI with ≥1 serodiscordant (HIV-positive/HIV status unknown) partner. The proportion of participants with an SRB score ≥4 remained below 20% over time, while the proportion of participants who did not have IAI or RAI since their last study visit rose from 43 to 56% (see Figure, Supplemental Digital Content 1, which displays SRB scores over time).
Table 2.
Characteristics of HIV-negative Multicenter AIDS Cohort Study (MACS) participants at the index visit (10/1/2003 – 9/30/2004).
| Characteristic | Sexual Risk Trajectory Group
|
Total (N=419) | ||||||
|---|---|---|---|---|---|---|---|---|
| Low Risk (N=264) | Moderate Risk (N=96) | High Risk (N=59) | ||||||
|
| ||||||||
| n | % | n | % | n | % | n | % | |
| Study center | ||||||||
| Baltimore | 82 | 31.1 | 15 | 15.6 | 19 | 32.2 | 116 | 27.7 |
| Chicago | 46 | 17.4 | 14 | 14.6 | 9 | 15.3 | 69 | 16.5 |
| Los Angeles | 68 | 25.8 | 42 | 26.0 | 14 | 23.7 | 107 | 25.5 |
| Pittsburgh | 68 | 25.8 | 25 | 43.8 | 17 | 28.8 | 127 | 30.3 |
| Mean age in years (SD) | 40.5 | 8.9 | 34.3 | 9.7 | 34.4 | 10.8 | 38.3 | 9.8 |
| Race/Ethnicity | ||||||||
| White non-Hispanic | 73 | 27.7 | 55 | 57.3 | 33 | 55.9 | 161 | 38.4 |
| Black non-Hispanic | 147 | 55.7 | 19 | 19.8 | 11 | 18.6 | 177 | 42.2 |
| Hispanic | 32 | 12.1 | 18 | 18.8 | 13 | 22.0 | 63 | 15.0 |
| Other | 12 | 4.6 | 4 | 4.2 | 2 | 3.4 | 18 | 4.3 |
| Education | ||||||||
| ≤ High school graduate | 100 | 37.9 | 15 | 15.6 | 9 | 15.3 | 124 | 29.6 |
| Some College | 64 | 24.2 | 30 | 31.3 | 19 | 32.2 | 113 | 27.0 |
| ≥ College graduate | 100 | 37.9 | 51 | 53.1 | 31 | 52.5 | 182 | 43.4 |
| Annual income ≥ $20,000 | 93 | 35.2 | 58 | 60.4 | 41 | 69.5 | 192 | 45.8 |
| Distress/depression (CESD ≥16) | 135 | 51.1 | 55 | 57.3 | 40 | 67.8 | 230 | 54.9 |
| Male sex partner since last visit | 131 | 49.6 | 94 | 97.9 | 59 | 100.0 | 284 | 67.8 |
| Mean # of male sex partners (SD) | 4.4 | 7.1 | 9.4 | 23.1 | 14.6 | 22.1 | 8.1 | 17.7 |
| RAI since last visit | 52 | 19.7 | 69 | 71.9 | 57 | 96.6 | 178 | 42.5 |
| Mean # of RAI partners (SD) | 1.5 | 1.7 | 3.5 | 6.7 | 7.5 | 14.1 | 4.2 | 9.3 |
| URAI | 20 | 38.5 | 39 | 56.5 | 47 | 82.5 | 106 | 59.6 |
| URAI with ≥1 serodiscordant partner | 3 | 5.8 | 13 | 18.8 | 30 | 52.6 | 46 | 25.8 |
| IAI since last visit | 85 | 32.2 | 71 | 74.0 | 50 | 84.8 | 206 | 49.2 |
| Mean # of IAI partners (SD) | 2.3 | 2.8 | 5.9 | 11.6 | 7.1 | 14.1 | 4.7 | 10.1 |
| UIAI | 41 | 48.2 | 45 | 63.4 | 39 | 78.0 | 125 | 60.7 |
| UIAI with ≥1 serodiscordant partner | 16 | 18.8 | 23 | 32.4 | 24 | 48.0 | 63 | 30.6 |
| Substance use since last visit | ||||||||
| Any substance use^ | 87 | 33.0 | 37 | 38.5 | 32 | 54.2 | 156 | 37.2 |
| ≥5 alcohol beverages per day | 36 | 13.6 | 18 | 18.8 | 11 | 18.6 | 65 | 15.5 |
| Marijuana | 86 | 32.6 | 38 | 39.6 | 29 | 49.2 | 153 | 36.5 |
| Amyl nitrates (poppers) | 21 | 8.0 | 23 | 24.0 | 22 | 37.3 | 66 | 15.8 |
| Crack | 53 | 20.1 | 13 | 13.5 | 4 | 6.8 | 70 | 16.7 |
| Other Cocaine | 26 | 9.9 | 11 | 11.5 | 4 | 6.8 | 41 | 9.8 |
| Uppers (crystal, methamphetamines) | 9 | 3.4 | 11 | 11.5 | 9 | 15.3 | 29 | 6.9 |
Numbers may not sum to column totals due to missing data; Percents may not sum to 100 due to rounding or omission of one category for binary variables.
Excludes alcohol and marijuana, but includes amyl nitrates, crack, other cocaine, and uppers.
SD = standard deviation; CESD = Center for Epidemiologic Studies Depression Scale; IAI = insertive anal intercourse; UIAI = unprotected insertive anal intercourse; RAI = receptive anal intercourse; URAI = unprotected receptive anal intercourse
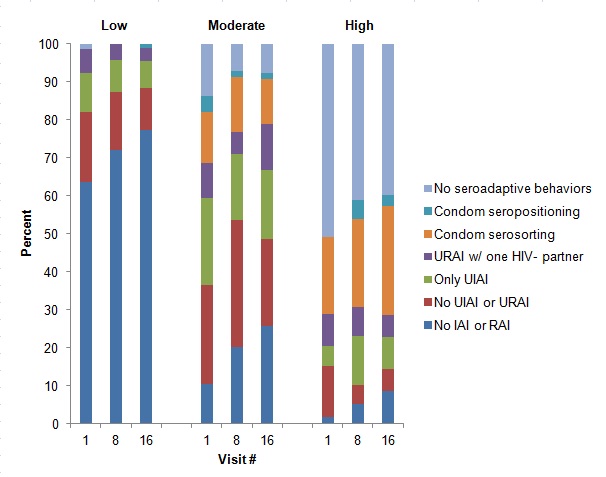
Our final model identified three sexual risk trajectory groups, which we labeled low (N=264, 63.0%), moderate (N=96, 22.9%), and high risk (N=59, 14.1%). The average posterior probabilities of group membership for each group ranged from 0.88 to 0.95, which indicates good classification quality of our model.26 No IAI or RAI was most commonly reported by members of the low risk group over time, while engaging in no seroadaptive behaviors was most frequently reported by members of the high risk group (see Figure, Supplemental Digital Content 2, which displays SRB scores over time by group). Over the course of follow-up, 3.0% (8/264), 10.4% (10/96), 32.2% (19/59) of participants seroconverted from the low, moderate, and high risk groups, respectively.
While the mean number of 6-month intervals did not differ across the trajectory groups (low risk=11.6, SD=4.4; moderate risk=11.8, SD=3.7; high risk=10.9, SD=4.8; p-value=0.55), the frequency of high risk 6-month intervals and the length of consecutive high risk 6-month intervals were greater for the high risk group relative to both the moderate and low risk groups (Figure 1). No consecutive high risk 6-month intervals were observed among participants in the low risk group; however, 47.9% of participants in the moderate risk group and 93.2% of participants in the high risk group had consecutive high risk 6-month intervals (data not shown). Among participants with consecutive high risk 6-month intervals, the mean length was 2.4 intervals (~1 years; SD=0.7) and 3.7 intervals (~2 years; SD=2.7) for the moderate and high risk groups, respectively.
Figure 1.
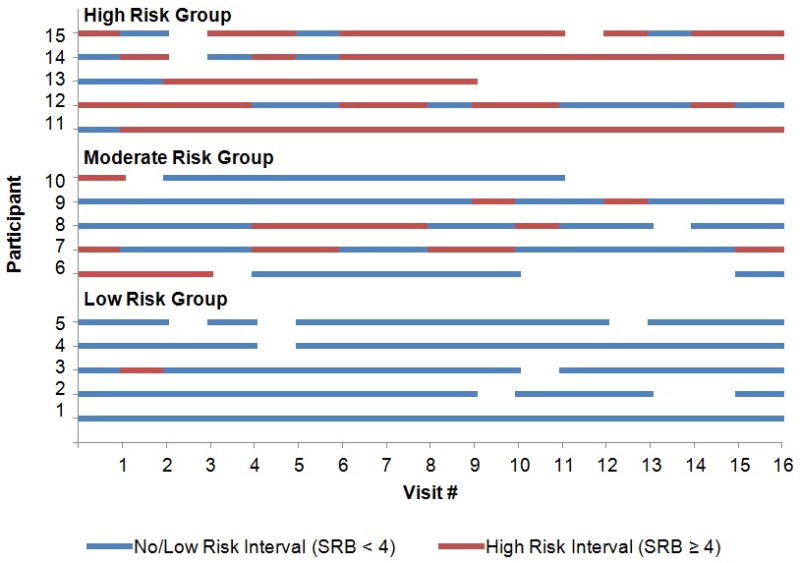
Individual risk patterns for a random sample of 5 HIV-negative Multicenter AIDS Cohort Study (MACS) participants with ≥8 study visits from each of the identified sexual risk trajectory groups: low risk, moderate risk, and high risk. Blue lines indicate no or low risk 6-month intervals between study visits with an SRB score<4. Red lines indicate high risk 6-month intervals between study visits with an SRB score ≥4. Blank intervals indicate a missed visit at the end of the 6-month interval, thus data on the risk behaviors practiced during the interval were not obtained.
To model the probability of engaging in high risk behaviors (SRB score≥4) over time we selected zero-order trajectories for the low and high risk groups and a linear trajectory for the moderate risk group (Figure 2). The predicted probability of engaging in high risk behaviors over time for the low risk group was approximately 0.009 (95% confidence interval [CI]: 0.004–0.014), while it started at 0.29 (95% CI: 0.22–0.36) and declined to 0.17 (95% CI: 0.12–0.23) for the moderate risk group and remained constant at 0.71 (95% CI: 0.66–0.76) for the high risk group.
Figure 2.

Sexual risk trajectories among 419 HIV-negative Multicenter AIDS Cohort Study (MACS) participants (2003 – 2011). Sexual risk behavior (SRB) scores ≥4 indicate condom serosorting, condom seropositioning, and practicing no seroadaptive behaviors. The identified groups represent individuals who exhibited low risk (N=264, 63.0%), moderate risk (N=96, 22.9%) and high risk (N=59, 14.1%) trajectories over time.
Several covariates of interest were associated with sexual risk trajectory group membership (Table 3). Compared to low risk group membership, moderate and high risk group membership were associated with younger age, being White, and earning an annual income ≥$20,000 at the index visit. However, compared to membership in the low risk group, reporting symptoms of distress or depression (AOR=2.36, 95% CI: 1.14–4.92) and reporting substance use (AOR=2.00, 95% CI: 1.01–3.97) at the index visit were only associated with membership in the high risk group.
Table 3.
Adjusted odds ratios for the association between covariates of interest and sexual risk trajectory group membership among 419 HIV-negative Multicenter AIDS Cohort Study (MACS) participants.
| Covariate | Sexual Risk Trajectory Group
|
|||
|---|---|---|---|---|
| Moderate Risk
|
High Risk
|
|||
| AOR | 95% CI | AOR | 95% CI | |
| Study site | ||||
| Baltimore | 0.68 | 0.26, 1.75 | 1.90 | 0.68, 5.27 |
| Chicago | 1.55 | 0.57, 4.23 | 2.66 | 0.86, 8.25 |
| Los Angeles | 2.16 | 0.84, 5.56 | 2.99 | 0.97, 9.16 |
| Pittsburgh | Ref | - | Ref | - |
| Age (years) | 0.94 | 0.90, 0.98 | 0.92 | 0.88, 0.96 |
| White non-Hispanic | 3.91 | 1.72, 8.87 | 3.67 | 1.48, 9.11 |
| ≥ College graduate | 1.02 | 0.48, 2.19 | 0.76 | 0.32, 1.78 |
| Annual income ≥ $20,000 | 2.73 | 1.30, 5.74 | 4.98 | 2.13, 11.64 |
| Distress/depression (CESD ≥ 16) | 1.37 | 0.73, 2.55 | 2.36 | 1.14, 4.92 |
| Substance use^ | 1.29 | 0.68, 2.43 | 2.00 | 1.01, 3.97 |
Reference group = low risk group.
Substance use: amyl nitrates, crack, other cocaine, and uppers.
AOR = adjusted odds ratio; CI = confidence interval; CESD = Center for Epidemiologic Studies Depression Scale.
Discussion
Our analysis of longitudinal data from the MACS demonstrates that HIV-negative MSM exhibit relatively stable yet distinct patterns of sexual risk behavior over time. More than half of our sample rarely engaged in high risk behaviors (low risk group: 63.0%) over the eight year study period. However, 22.9% of participants (moderate risk group) occasionally practiced high risk behaviors, while 14.1% of participants (high risk group) engaged in such behaviors with greater frequency and duration.
Given the high probability of engaging in sexual risk behaviors among members of the high risk group and that 32.2% of participants in that group seroconverted during the study period, HIV-negative MSM similar to those following a high risk trajectory in our sample would likely benefit most from PrEP use. While most members of the high risk group were not at constant risk, over 90% of participants following a high risk trajectory exhibited continuous risk periods with an average duration of ~2 years. These findings suggest high risk MSM transition between low risk periods and high risk periods or “seasons of risk” over time. Thus, a targeted approach to PrEP delivery among MSM during “seasons of risk” may be more beneficial than continuous or prolonged PrEP use among high risk MSM.
Our findings also indicate that MSM following distinct sexual risk trajectories can be distinguished by certain individual-level characteristics. Many of the characteristics associated with following a high risk trajectory (i.e., young age, distress or depression, and substance use) have previously been identified as proximal predictors of sexual risk behaviors among MSM.29–35 However, to our knowledge, this is the first study to examine and demonstrate a relationship between these characteristics and longitudinal patterns of risk among HIV-negative MSM. Thus, our findings provide an understanding of the length of time MSM at ongoing high risk may remain at risk and how such MSM can be identified, and therefore are particularly relevant to the development of more targeted PrEP delivery guidelines based on the CDC’s current recommendation that PrEP be offered to MSM “at substantial, ongoing, high risk for acquiring HIV infection.”14
Younger age, being White, and earning an annual income ≥$20,000 at the index visit were associated with membership in both the moderate and high risk trajectory groups. Young MSM (<30 years of age) are at greatest risk of HIV infection in the US13 and engage in UAI more frequently than older MSM,29–30 thus young MSM are often the focus of HIV prevention efforts. However, given that 61.0% of participants in the high risk group were at least 30 years old at the index visit, our findings suggest that high risk periods occur well beyond 30 years of age among MSM. Incorporating and retaining young MSM in HIV prevention programs that include targeted PrEP delivery could potentially reduce their risk of HIV acquisition over a number of years.
Despite the fact that Black MSM are disproportionately affected by HIV/AIDS and are at greatest risk of HIV infection in the US,13, 36–37 we found that being non-White was associated with membership in the low risk group. Previous studies have shown that high risk behaviors are practiced with the same or lower frequency among Black MSM compared to other MSM, and suggest that sexual network characteristics among Black MSM may explain racial disparities in the risk of HIV infection.38–41 Although we used a comprehensive SRB score in our analysis, our score does not account for sexual network characteristics, such as age or race mixing, which may be needed to accurately describe the risk among non-White MSM.
Both distress or depression symptoms and reported substance use at the index visit were associated with following a high risk trajectory, but not a moderate risk trajectory. While distress or depression symptoms and reported substance use may be ongoing for individuals who follow high risk trajectories, our findings suggest that reports of these factors even at a single point in time are predictive of long-term patterns of risk. Assessing recent or current distress or depression and substance use may aid clinicians in the identification of MSM who exhibit “seasons of risk” for potential PrEP use.
Our study has several limitations. Although we restricted our sample to younger and more racially/ethnically diverse MACS participants, those included in our sample are still older and less diverse than those at greatest risk of HIV infection in the US. MACS participants also represent a highly motivated group of MSM who have been retained in a cohort study for a number of years, and thus may differ from MSM in general. The increasing proportion of participants reporting no AI over time may be explained by the fact that MSM engage in AI less frequently with age,42 but could also have been due to poorer retention rates among those at greatest risk. Although MACS participants still active at the index visit did not differ from those who were inactive on sexual risk behaviors (i.e., the number of reported sexual partners), they did differ on a number of demographic characteristics, thus different sexual risk trajectories may have been identified within the full sample. Further, there is some suggestion that group-based trajectory modeling has a tendency to over-extract trajectory groups within populations.43 However, Nagin argues that trajectory groups should be thought of as an approximation to a continuous distribution of individual-level trajectories within populations and cautions against the interpretation of identified groups as truly distinct entities.44 Thus, group-based trajectory modeling is useful for describing individuals with similar trajectories along a continuum. Moreover, despite the fact that participants were assigned to the group for which they had the highest posterior probability of membership, trajectory group assignments are not certain. However, the majority of HIV seroconversions occurred among members of the high risk group suggesting that participants were appropriately assigned according to risk. Additionally, because we assumed that 6-month intervals with missing data were no or low risk intervals, we may have underestimated the true frequency and duration of risk within our sample. Further, although we created a comprehensive SRB score based on data presented by Vallabhaneni et al.,24 we cannot be certain of the accuracy of our score in classifying risk. Previous research also suggests that partner type (main vs. casual) is strongly associated with condom use during AI among MSM.33, 45 However, MACS behavioral questionnaires do not collect the partner type for reported AI partners, thus our score is further limited by the fact that we cannot account for differences in risk by partner type. Finally, despite the fact that ACASI was implemented at most MACS sites, social desirability bias may have led to under-reporting of sexual risk behaviors, and hence an underestimation of the associated risks particularly in the high risk group.
Despite these limitations, the large sample of HIV-negative MSM from across the US, long duration of follow-up, and use of a comprehensive sexual risk behavior score are some of the many strengths of our study. Our findings expand the current understanding of sexual risk behaviors among MSM and should be considered in the development of targeted PrEP delivery guidelines for similar MSM populations. Such guidelines could enable clinicians to efficiently screen and identify MSM who exhibit “seasons of risk” for potential PrEP use. However, to ensure PrEP coverage throughout an individual’s duration of risk, future research should investigate factors associated with the transition from low risk to high risk periods among high risk MSM.
Supplementary Material
Supplemental Digital Content 1. Figure that displays SRB score over time. Pines_SDC1.pdf
Supplemental Digital Content 2. Figure that displays SRB score over time by group. Pines_SDC2.jpg
Acknowledgments
Heather A. Pines was supported by a Ruth L. Kirschstein National Research Service Award for individual predoctoral fellows from the National Institute of Mental Health (F31MH097620). Robert E. Weiss was supported by the Center for HIV Identification, Prevention, and Treatment Services (5P30MH058107-15) and the UCLA Center for AIDS Research – CORE H (AI28697). Data used in producing the analyses presented in this manuscript were collected by the Multicenter AIDS Cohort Study (MACS) with centers (Principal Investigators) at: Johns Hopkins University Bloomberg School of Public Health (Joseph Margolick), U01-AI35042; Northwestern University (Steven Wolinsky), U01-AI35039; University of California, Los Angeles (Roger Detels), U01-AI35040; University of Pittsburgh (Charles Rinaldo), U01-AI35041; the Center for Analysis and Management of MACS, Johns Hopkins University Bloomberg School of Public Health (Lisa Jacobson), UM1-AI35043. The MACS is funded primarily by the National Institute of Allergy and Infectious Diseases (NIAID), with additional co-funding from the National Cancer Institute (NCI). Targeted supplemental funding for specific projects was also provided by the National Heart, Lung, and Blood Institute (NHLBI), and the National Institute on Deafness and Communication Disorders (NIDCD). MACS data collection is also supported by UL1-TR000424 (JHU CTSA). Website located at http://www.statepi.jhsph.edu/macs/macs.html.
Footnotes
Conflicts of Interest: No conflicts of interest to declare.
Results were presented at the STI & AIDS World Congress 2013 (joint meeting of the 20th International Society for Sexually Transmitted Diseases Research [ISSTDR] and the 14th International Union Against Sexually Transmitted Infections [IUSTI]) held in Vienna, Austria (July 14–17, 2013).
The contents of this publication are solely the responsibility of the authors and do not represent the official views of the National Institutes of Health (NIH).
Source of Funding: Heather A. Pines was supported by a Ruth L. Kirschstein National Research Service Award for individual predoctoral fellows from the National Institute of Mental Health (F31MH097620). Pamina M. Gorbach was supported by the National Institutes of Health (U01-AI35040). Robert E. Weiss was supported by the Center for HIV Identification, Prevention, and Treatment Services (5P30MH058107-15) and the UCLA Center for AIDS Research – CORE H (AI28697). Steven Shoptaw was supported by the National Institutes of Health (U01-AI35040) and the Center for HIV Identification, Prevention, and Treatment Services (5P30MH058107). Michael Plankey was supported by the National Institutes of Health (U01 grant). For the remaining authors, no sources of funding were declared.
References
- 1.Grant RM, Lama JR, Anderson PL, et al. Preexposure chemoprophylaxis for HIV prevention in men who have sex with men. N Engl J Med. 2010;363:2587–2599. doi: 10.1056/NEJMoa1011205. [DOI] [PMC free article] [PubMed] [Google Scholar]
- 2.Baeten JM, Donnell D, Ndase P, et al. Antiretroviral prophylaxis for HIV prevention in heterosexual men and women. N Engl J Med. 2012;367:399–410. doi: 10.1056/NEJMoa1108524. [DOI] [PMC free article] [PubMed] [Google Scholar]
- 3.Thigpen MC, Kebaabetswe PM, Paxton LA, et al. Antiretroviral preexposure prophylaxis for heterosexual HIV transmission in Botswana. N Engl J Med. 2012;367:423–434. doi: 10.1056/NEJMoa1110711. [DOI] [PubMed] [Google Scholar]
- 4.Choopanya K, Martin M, Suntharasamai P, et al. Antiretroviral prophylaxis for HIV infection in injecting drug users in Bangkok, Thailand (the Bangkok Tenofovir Study): a randomised, double-blind, placebo-controlled phase 3 trial. Lancet. 2013;381:2083–2090. doi: 10.1016/S0140-6736(13)61127-7. [DOI] [PubMed] [Google Scholar]
- 5.AVAC. [Accessed October 24, 2013];Ongoing and Planned PrEP Trials and Demonstration Projects. 2013 Aug; http://www.avac.org/ht/a/GetDocumentAction/i/3113.
- 6.Paxton LA, Hope T, Jaffe HW. Pre-exposure prophylaxis for HIV infection: what if it works? Lancet. 2007;370:89–93. doi: 10.1016/S0140-6736(07)61053-8. [DOI] [PubMed] [Google Scholar]
- 7.Underhill K, Operario D, Mimiaga MJ, et al. Implementation science of pre-exposure prophylaxis: preparing for public use. Curr HIV/AIDS Rep. 2010;7:210–219. doi: 10.1007/s11904-010-0062-4. [DOI] [PMC free article] [PubMed] [Google Scholar]
- 8.Kim SC, Becker S, Dieffenbach C, et al. Planning for pre-exposure prophylaxis to prevent HIV transmission: challenges and opportunities. J Int AIDS Soc. 2010;13:24. doi: 10.1186/1758-2652-13-24. [DOI] [PMC free article] [PubMed] [Google Scholar]
- 9.Myers GM, Mayer KH. Oral Preexposure Anti-HIV Prophylaxis for High-Risk U.S. Populations: Current Considerations in Light of New Findings. AIDS Patient Care STDS. 2011;25:63–71. doi: 10.1089/apc.2010.0222. [DOI] [PubMed] [Google Scholar]
- 10.Padian NS, Buve A, Balkus J, et al. Biomedical interventions to prevent HIV infection: evidence, challenges, and way forward. Lancet. 2008;372:585–599. doi: 10.1016/S0140-6736(08)60885-5. [DOI] [PubMed] [Google Scholar]
- 11.Underhill K, Operario D, Skeer M, et al. Packaging PrEP to Prevent HIV: An Integrated Framework to Plan for Pre-Exposure Prophylaxis Implementation in Clinical Practice. J Acquir Immune Defic Syndr. 2010;55:8–13. doi: 10.1097/qai.0b013e3181e8efe4. [DOI] [PMC free article] [PubMed] [Google Scholar]
- 12.Centers for Disease Control and Prevention. [Accessed October 13, 2013];HIV Surveillance Report: Diagnoses of HIV Infection in the United States and Dependent Areas, 2011. 2013 Feb;:23. Available at: http://www.cdc.gov/hiv/library/reports/surveillance/2011/surveillance_Report_vol_23.html.
- 13.Prejean J, Song R, Hernandez A, et al. Estimated HIV incidence in the United States, 2006–2009. PLoS One. 2011;6:e17502. doi: 10.1371/journal.pone.0017502. [DOI] [PMC free article] [PubMed] [Google Scholar]
- 14.Centers for Disease Control and Prevention. Interim guidance: preexposure prophylaxis for the prevention of HIV infection in men who have sex with men. MMWR Morb Mortal Wkly Rep. 2011;60:65–68. [PubMed] [Google Scholar]
- 15.Chen SY, Gibson S, Katz MH, et al. Continuing increases in sexual risk behavior and sexually transmitted diseases among men who have sex with men: San Francisco, Calif, 1999–2001, USA. Am J Public Health. 2002;92:1387–1388. [PMC free article] [PubMed] [Google Scholar]
- 16.Scheer S, Kellogg T, Klausner JD, et al. HIV is hyperendemic among men who have sex with men in San Francisco: 10-year trends in HIV incidence, HIV prevalence, sexually transmitted infections and sexual risk behaviour. Sex Transm Infect. 2008;84:493–498. doi: 10.1136/sti.2008.031823. [DOI] [PubMed] [Google Scholar]
- 17.Lattimore S, Thornton A, Delpech V, et al. Changing patterns of sexual risk behavior among London gay men: 1998–2008. Sex Transm Dis. 2011;38:221–229. doi: 10.1097/OLQ.0b013e3181f2ebe1. [DOI] [PubMed] [Google Scholar]
- 18.Lim SH, Christen CL, Marshal MP, et al. Middle-aged and older men who have sex with men exhibit multiple trajectories with respect to the number of sexual partners. AIDS Behav. 2012;16:590–598. doi: 10.1007/s10461-011-9916-z. [DOI] [PMC free article] [PubMed] [Google Scholar]
- 19.Jin F, Jansson J, Law M, et al. Per-contact probability of HIV transmission in homosexual men in Sydney in the era of HAART. AIDS. 2010;24:907–913. doi: 10.1097/QAD.0b013e3283372d90. [DOI] [PMC free article] [PubMed] [Google Scholar]
- 20.Baggaley RF, White RG, Boily MC. HIV transmission risk through anal intercourse: systematic review, meta-analysis and implications for HIV prevention. Int J Epidemiol. 2010;39:1048–1063. doi: 10.1093/ije/dyq057. [DOI] [PMC free article] [PubMed] [Google Scholar]
- 21.Grulich AE, Zablotska I. Commentary: probability of HIV transmission through anal intercourse. Int J Epidemiol. 2010;39:1064–1065. doi: 10.1093/ije/dyq101. [DOI] [PubMed] [Google Scholar]
- 22.Kaslow RA, Ostrow DG, Detels R, et al. The Multicenter AIDS Cohort Study: rationale, organization, and selected characteristics of the participants. Am J Epidemiol. 1987;126:310–318. doi: 10.1093/aje/126.2.310. [DOI] [PubMed] [Google Scholar]
- 23.Dudley J, Jin S, Hoover D, et al. The Multicenter AIDS Cohort Study: retention after 9 1/2 years. Am J Epidemiol. 1995;142:323–330. doi: 10.1093/oxfordjournals.aje.a117638. [DOI] [PubMed] [Google Scholar]
- 24.Vallabhaneni S, Li X, Vittinghoff E, et al. Seroadaptive Practices: Association with HIV Acquisition among HIV-Negative Men Who Have Sex with Men. PLoS One. 2012;7:e45718. doi: 10.1371/journal.pone.0045718. [DOI] [PMC free article] [PubMed] [Google Scholar]
- 25.Mills TC, Paul J, Stall R, et al. Distress and depression in men who have sex with men: the Urban Men’s Health Study. Am J Psychiatry. 2004;161:278–285. doi: 10.1176/appi.ajp.161.2.278. [DOI] [PubMed] [Google Scholar]
- 26.Nagin D. Group-based modeling of development. Cambridge: Harvard University Press; 2005. [Google Scholar]
- 27.Muthen B, Muthen LK. Integrating person-centered and variable-centered analysis: growth mixture modeling with latent trajectory classes. Alcoholism: Clinical and Experimental Research. 2000;24:882–891. [PubMed] [Google Scholar]
- 28.Jones BL, Nagin DS. Advances in Group-Based Trajectory Modeling and an SAS Procedure for Estimating Them. Sociological Methods & Research. 2007;35:542–571. [Google Scholar]
- 29.Mansergh G, Marks G. Age and risk of HIV infection in men who have sex with men. AIDS. 1998;12:1119–1128. doi: 10.1097/00002030-199810000-00003. [DOI] [PubMed] [Google Scholar]
- 30.Crepaz N, Marks G, Mansergh G, et al. Age-related risk for HIV infection in men who have sex with men: examination of behavioral, relationship, and serostatus variables. AIDS Educ Prev. 2000;12:405–415. [PubMed] [Google Scholar]
- 31.Ostrow DG, Beltran ED, Joseph JG, et al. Recreational drugs and sexual behavior in the Chicago MACS/CCS cohort of homosexually active men. Chicago Multicenter AIDS Cohort Study (MACS)/Coping and Change Study. J Subst Abuse. 1993;5:311–325. doi: 10.1016/0899-3289(93)90001-r. [DOI] [PubMed] [Google Scholar]
- 32.Woody GE, Donnell D, Seage GR, et al. Non-injection substance use correlates with risky sex among men having sex with men: data from HIVNET. Drug Alcohol Depend. 1999;53:197–205. doi: 10.1016/s0376-8716(98)00134-3. [DOI] [PubMed] [Google Scholar]
- 33.Koblin BA, Chesney MA, Husnik MJ, et al. High-risk behaviors among men who have sex with men in 6 US cities: baseline data from the EXPLORE Study. Am J Public Health. 2003;93:926–932. doi: 10.2105/ajph.93.6.926. [DOI] [PMC free article] [PubMed] [Google Scholar]
- 34.Colfax G, Vittinghoff E, Husnik MJ, et al. Substance use and sexual risk: a participant- and episode-level analysis among a cohort of men who have sex with men. Am J Epidemiol. 2004;159:1002–1012. doi: 10.1093/aje/kwh135. [DOI] [PubMed] [Google Scholar]
- 35.Fendrich M, Avci O, Johnson TP, et al. Depression, substance use and HIV risk in a probability sample of men who have sex with men. Addict Behav. 2013;38:1715–1718. doi: 10.1016/j.addbeh.2012.09.005. [DOI] [PMC free article] [PubMed] [Google Scholar]
- 36.Valleroy LA, MacKellar DA, Karon JM, et al. HIV prevalence and associated risks in young men who have sex with men. Young Men’s Survey Study Group. JAMA. 2000;284:198–204. doi: 10.1001/jama.284.2.198. [DOI] [PubMed] [Google Scholar]
- 37.Hall HI, Byers RH, Ling Q, et al. Racial/ethnic and age disparities in HIV prevalence and disease progression among men who have sex with men in the United States. Am J Public Health. 2007;97:1060–1066. doi: 10.2105/AJPH.2006.087551. [DOI] [PMC free article] [PubMed] [Google Scholar]
- 38.Bingham TA, Harawa NT, Johnson DF, et al. The effect of partner characteristics on HIV infection among African American men who have sex with men in the Young Men’s Survey, Los Angeles, 1999–2000. AIDS Educ Prev. 2003;15:39–52. doi: 10.1521/aeap.15.1.5.39.23613. [DOI] [PubMed] [Google Scholar]
- 39.Millett GA, Flores SA, Peterson JL, et al. Explaining disparities in HIV infection among black and white men who have sex with men: a meta-analysis of HIV risk behaviors. AIDS. 2007;21:2083–2091. doi: 10.1097/QAD.0b013e3282e9a64b. [DOI] [PubMed] [Google Scholar]
- 40.Berry M, Raymond HF, McFarland W. Same race and older partner selection may explain higher HIV prevalence among black men who have sex with men. AIDS. 2007;21:2349–2350. doi: 10.1097/QAD.0b013e3282f12f41. [DOI] [PubMed] [Google Scholar]
- 41.Millett GA, Peterson JL, Flores SA, et al. Comparisons of disparities and risks of HIV infection in black and other men who have sex with men in Canada, UK, and USA: a meta-analysis. Lancet. 2012;380:341–348. doi: 10.1016/S0140-6736(12)60899-X. [DOI] [PubMed] [Google Scholar]
- 42.Sanchez T, Finlayson T, Drake A, et al. Human immunodeficiency virus (HIV) risk, prevention, and testing behaviors--United States, National HIV Behavioral Surveillance System: men who have sex with men, November 2003–April 2005. MMWR Surveill Summ. 2006;55:1–16. [PubMed] [Google Scholar]
- 43.Bauer DJ, Curran PJ. Distributional assumptions of growth mixture models: implications for overextraction of latent trajectory classes. Psychol Methods. 2003;8:338–363. doi: 10.1037/1082-989X.8.3.338. [DOI] [PubMed] [Google Scholar]
- 44.Nagin DS, Tremblay RE. Developmental trajectory groups: fact or a useful statistical fiction? Criminology. 2005;43:873–904. [Google Scholar]
- 45.Sullivan PS, Salazar L, Buchbinder S, et al. Estimating the proportion of HIV transmissions from main sex partners among men who have sex with men in five US cities. AIDS. 2009;23:1153–1162. doi: 10.1097/QAD.0b013e32832baa34. [DOI] [PubMed] [Google Scholar]
Associated Data
This section collects any data citations, data availability statements, or supplementary materials included in this article.
Supplementary Materials
Supplemental Digital Content 1. Figure that displays SRB score over time. Pines_SDC1.pdf
Supplemental Digital Content 2. Figure that displays SRB score over time by group. Pines_SDC2.jpg