

Abstract
Purpose
To compare diffusion-weighted magnetic resonance imaging (DW-MRI) with positron emission tomography/computed tomography (PET/CT) for staging and evaluating treatment response in patients with diffuse large B-cell lymphoma (DLBCL).
Materials and Methods
Institutional review board approval was obtained for this study; all subjects gave informed consent. Twelve patients were imaged before treatment and 8 of these also were imaged after two cycles of chemotherapy using both DW-MRI and PET/CT. Up to six target lesions were selected at baseline for response assessment based on International Working Group criteria (nodes >1.5 cm long diameter and extranodal lesions >1cm long diameter). For pretreatment staging, visual analysis of the numbers of nodal and extranodal lesions based on PET/CT was performed. For interim response assessment after cycle 2 of chemotherapy, residual tumor sites were assessed visually and percentage changes in target lesion size, maximum standardized uptake value (SUVmax) and apparent diffusion coefficient (ADC) from pretreatment values were calculated.
Results
In 12 patients studied pretreatment, there were 46 nodal and 16 extranodal sites of lymphomatous involvement. Agreement between DW-MRI and PET/CT for overall lesion detection was 97% (60/62 tumor sites; 44/46 nodal and 16/16 extranodal lesions) and for Ann Arbor stage it was 100%. In the 8 patients who had interim assessment, 5 of their 49 tumor sites remained abnormal on visual analysis of both DW-MRI and PET/CT and there was one false-positive on DW-MRI. Of their 24 target lesions, mean pretreatment ADC value, tumor size and SUVmax were 772 μm2/s, 21.3 cm2 and 16.9 g/mL, respectively. At interim assessment of the same 24 target lesions, ADC values increased by 85% tumor size decreased by 74%, and SUVmax decreased by 83% (all p<0.01 versus baseline).
Conclusion
DW-MRI provides results comparable to those of PET/CT for staging and early response assessment in patients with DLBCL.
Keywords: Diffuse large B-cell lymphoma, Response to chemotherapy, Diffusion-weighted MRI, Apparent diffusion coefficient, PET/CT, Standardized uptake value
INTRODUCTION
Diffuse large B-cell lymphoma (DLBCL) is the most common subtype of non-Hodgkin lymphoma (1). Positron emission tomography/computed tomography (PET/CT) with the glucose analogue 18F-fluorodeoxyglucose (FDG) is frequently used for staging of lymphoma and has been adopted as part of the standardized criteria for assessing response at completion of chemotherapy (International Working Group [IWG] criteria) (2–7). There also is growing interest in the use of FDG-PET early during a course of chemotherapy to allow for adaptation of therapy based on response. Whether this use of PET will lead to improved outcomes remains controversial, although the practice is common (8–11). Although PET/CT appears to be a sensitive test for identifying tumor extent and determining treatment response, it has the disadvantage of associated radiation exposure, which is an important limitation in younger patients undergoing serial examinations (12).
Diffusion-weighted magnetic resonance imaging (DW-MRI) with apparent diffusion coefficient (ADC) calculations provides information related to random microscopic motion of water molecules as an indirect marker of tumor cellularity, and it has the advantage of not using ionizing radiation. Several recent studies in a variety of tumors have shown that DW-MRI with ADC evaluation can stage and monitor response during and at the end of treatment (13–17). Because of its high cellularity, diffuse large B-cell lymphoma (DLBCL), which is the most common form of non-Hodgkin lymphoma, has relatively high signal intensity on DW-MRI images and low ADC values. Studies on the use of DW-MRI in DLBCL are few in number, and those that are available have a number of limitations, such as inclusion of patients with mixed histologic subtypes of DLCBL and relapsed or previously treated tumors, failure to separately analyze Hodgkin and non-Hodgkin lymphoma, and the use of conventional CT as the reference standard rather than PET/CT (18–24). Additionally, a single anatomic site was often analyzed, rather than the evaluation of multiple sites, which is employed in the IWG response assessment criteria (6,7).
The current pilot study was undertaken to assess the performance of whole-body DW-MRI in staging and early detection of chemotherapy response in DLBCL, by comparison with FDG-PET/CT as the reference standard. This prospective study, unlike other studies, includes a cohort of patients who had homogeneous DLBLC histology, underwent standard chemotherapy, and were staged using the IWG criteria.
PATIENTS AND METHODS
Patients
This prospective study was approved by our Institutional Review Board (IRB), and each participant gave written informed consent. Patients ≥18 years of age with histologically proven DLBCL, who were scheduled for chemotherapy with rituximab, cyclophosphamide, doxorubicin, vincristine (Oncovin®) and prednisone (R-CHOP) or similar R-CHOP-like regimens were considered eligible, and were asked to undergo DW-MRI and FDG-PET/CT at initial staging and after cycle 2 of chemotherapy (early response assessment). The time between cycles was 21 days. Baseline imaging needed to be performed within 30 days before the start of chemotherapy, and end of cycle 2 imaging needed to be performed no later than 3 days before the start of cycle 3 (Figure 1). All patients underwent physical examination, standard laboratory tests and bone marrow aspiration and biopsy.
Figure 1.

Study flow diagram.
Patients were excluded who had a history of prior chemotherapy or radiotherapy for DLBCL, had relapsed or transformed DLBCL, had another active malignancy within the past three years, contraindication to MRI (e.g., claustrophobia, implanted devices), were pregnant or breastfeeding, had uncontrolled diabetes mellitus with fasting blood glucose > 200 mg/dL, or were unable to give informed consent.
Staging and Response Assessment
Staging was based on the Ann Arbor classification system (4). At the end of chemotherapy (after 6 cycles of chemotherapy), response on a per patient basis was assessed using the revised IWG criteria (6,7), which are routinely applied in clinical practice. These criteria are based on the sum of the products of the maximum biperpendicular diameters of lesions measured on CT and the persistence or absence of FDG avidity (6,7). Additionally, patients were followed for approximately two years in accordance with routine clinical practice to assess for development of recurrent disease.
At interim evaluation, response on a per patient basis was not evaluated. The interim evaluation was used to assess anatomical site-specific response to chemotherapy and percentage changes in target lesion size, SUVmax and ADC from baseline pretreatment values
DW-MRI Technique
Whole-body DW-MRI was performed on a 1.5 T MR scanner (Magnetom Avanto, Siemens Medical Solutions, Erlangen, Germany) with a sliding table platform with the patient positioned supine and head first in the magnet bore using the manufacturer’s body and spine array coils. The body matrix coil was used in combination with the spine matrix coil. The body matrix coil had six elements, and dimensions of 322 mm × 520 mm × 40 mm (L × W × H). The spine matrix coil had 24 elements and dimensions of 1185 mm × 485 mm × 33 mm (L × W × H). Additionally, a neck coil was used for the cervical region; the latter had four elements with coil dimensions of 190 mm × 330 mm × 332 mm (L × W × H). Acceleration factor was 2 and reference lines were 30.
The MRI examination consisted of whole-body screening from the level of the skull base to the proximal femurs in the axial plane using a parallel-acquisition technique to improve spatial resolution and decrease data acquisition time. Four stations were performed to cover the total anatomic area. DW-MRI was acquired using a single-shot echo-planar sequence with two b values (50 and 800 s/mm2) as previously reported (16,21) with SPectral-Attenuated Inversion Recovery (SPAIR) used for fat saturation. Based on the manufacturer’s advice and literature Based on the manufacturer’s advice and our preliminary testing in volunteers prior to the study, SPAIR was selected over short-tau inversion recovery (STIR) imaging because it had better qualitative CNR than did STIR. The MRI parameters are shown in Table 1. Intravenous and oral contrast material was not given. DW-MRI was acquired during free-breathing.
Table 1.
MR sequences, slice/gap thickness and MR Parameters
| Sequence | Field of view (mm2) | Matrix | Slice (mm) | Gap (mm) | Number slices | Number averages | TR (ms) | TE (ms) | Flip angle | Time (s) |
|---|---|---|---|---|---|---|---|---|---|---|
| DW-MRI | 380×323 | 128×128 | 5 | 0 | 30 | 5 | 5500 | 67 | 90 | 138 |
| HASTE | 380×323 | 256×256 | 5 | 0 | 30 | 1 | 1000 | 67 | 105 | 30 |
PET/CT Technique
PET/CT was obtained as part of routine clinical care on an integrated PET/CT scanner (Biograph 40, Siemens Medical Solutions, Erlangen, Germany) as previously described (8). Briefly, patients fasted for at least 4 hours and had fasting blood glucose ≤ 200 mg/dL before injection of 370–555 MBq (10–15 mCi) FDG. After approximately 60 min, a spiral CT scan (typically 95–111 effective mAs, 130 kVp, and 5-mm slice thickness), with oral iodinated contrast agent, but not intravenous contrast agent, was acquired, followed by pelvis-to-skull base emission images. The PET emission images were corrected for measured attenuation and reconstructed using an ordered-subset expectation maximization iterative algorithm per the manufacturer’s instructions
Tumor Size Measurement
The IWG criteria were used as the standard to assess therapeutic response at interim chemotherapy (6,7). IWG criteria use up to six of the largest nodal and/or extranodal masses, referred to as target lesions, for response assessment. Other masses are categorized as non-target lesions and followed subjectively. To qualify as target lesions, lymph nodes must measure > 1.5 cm in long axis and organ lesions > 1 cm in diameter to be considered abnormal. Disease must be measured in two dimensions and the sum of the product of the diameters used for response assessment (6,7). Using IWG criteria, one of the authors selected the index lesions for analysis on the CT images (from the PET/CT). In each patient, the products of the bidimensional measurements of the index lesions were recorded on a standardized form. Annotated CT images showing the index lesions were disclosed to the MRI and nuclear medicine readers for independent quantitative analysis of apparent diffusion coefficient (ADC) value and maximum standardized uptake value (SUVmax), respectively, thus, ensuring that the same lesions were used for all measurements. The same anatomical locations and same set of imaging sequences were used for follow-up evaluation.
MRI Analysis
Qualitative Analysis
All MR images were reviewed on a Picture Archiving and Communication System workstation (Vitrea®, Vital Images, Minneapolis, MN). Two radiologists reviewed the DW-MR images; they were blinded to the PET/CT findings. For staging analysis, the body was divided into site-specific regions: 20 nodal and seven extranodal areas. Nodal regions included Waldeyer ring, right and left cervical, right and left supraclavicular, right and left subpectoral, right and left axillary, mediastinal, right and left hilar, portal, gastrohepatic, retroperitoneal, mesenteric, right and left iliac, and right and left inguinal regions. Extranodal regions included lungs, liver, spleen, kidneys, gastrointestinal tract, bone, and superficial soft tissues. DW images with b values of 50 and 800 s/mm2 were examined to ensure that no motion had occurred during the two acquisitions.
For the per nodal and extranodal site evaluation, the signal intensity of lymph nodes and extranodal sites was assessed visually on axial images at b = 50 and b = 800 s/mm2 images and on the ADC maps as described in the literature (16,21) For this study, we did not assess the optimal b-value for lesion identification and location. Abnormal signal on either or both of the b-value images was considered abnormal. Nodal and organ lesions were detected by identification of signal abnormality and were considered abnormal if the signal intensity was higher than that of muscle on b value images and lower than that of muscle on ADC images. Size criteria were not used in the qualitative evaluation. The spleen was considered abnormal if it either contained focal lesions or was enlarged (long axis >13 cm). At end-of-cycle-2 imaging, the same nodal and extranodal regions were assessed for presence or absence of residual signal abnormality.
Quantitative Analysis
ADC measurements were reported in square micrometers per second (16). One MRI reader was given the annotated CT images from the PET/CT to identify the target lesions for ADC calculations. For pretreatment evaluation, the region of interest (ROI) was manually drawn to encompass a 1-cm2 area and was placed on the interpolated axial images in the largest cross-sectional plane (26). Each ROI was placed to avoid vascular structures and necrotic components. To ensure no significant variability, measurements were taken from three areas in each target lesion, and the mean ADC value was used for analyses. Locations of pre-treatment ADCs and post-treatment residual tumor ADCs were matched. At interim evaluation, all target lesions were still visible although smaller in size, ranging in longest diameter between 4 mm and 3.9 cm (mean 1.4 cm). ROIs were placed only in residual areas of disease to allow comparison with baseline values and were manually drawn to encompass a 0.5 to 1-cm2 area depending on lesion size.
To prevent mistaking strong T2-signal (i.e., T2 shine-through) for restricted diffusion, we correlated high b-value images with corresponding ADC maps and HASTE anatomical images. Lymphomas showed low signal intensity on ADC maps, whereas T2-shine-through appeared as an area of high signal intensity (15).
PET/CT Analysis
A single nuclear medicine physician unaware of the DW-MRI results assessed the PET/CT images. The nuclear medicine reader qualitatively interpreted the PET/CT images for the same nodal and extranodal regions assessed on DW-MRI as described above. Any focus of visually elevated FDG uptake higher than background tissues, unrelated to normal physiologic FDG uptake, was considered positive for lymphomatous involvement both at baseline and interim analysis (6). Homogeneously increased FDG uptake in the spleen greater than that in the liver was also considered pathologic. The nuclear medicine reader was also given the annotated CT images to guide target lesion identification for interim response assessment.
For response assessment at end-of-cycle-2 imaging, the same per lesion nodal and extranodal regions and target lesions evaluated at baseline were evaluated at interim analysis. In addition, tumor SUVmax was quantified at baseline and after 2 cycles of chemotherapy in each of the index lesions. SUVmax was determined using a 3-D volumetric tool (True-D software, Siemens Medical Solutions, Erlangen, Germany).
Statistical Analysis
The numbers of nodal and extra nodal lesions were based on PET/CT diagnoses. The positive percent agreements (and 95% confidence intervals) between PET/CT and MRI diagnoses were calculated (26). Lesion detection for DW-MRI was based on the consensus of two independent readers, who resolved disagreements through a consensus read. For the assessment of interobserver agreement, differences between observers in detection of disease sites with DW-MRI among anatomical regions were non- normally distributed (Shapiro-Wilk W test, p < 0.01); therefore, the differences were tested for statistical significance with the Wilcoxon signed-rank test.
For tumor size, ADC and SUVmax measurements, all data distributions were tested for normality with the Shapiro-Wilk W test. For normally distributed data, means (± standard deviations) were used for descriptive statistics. For non-normal distributions, the medians and 25th – 75th percentile ranges were used for descriptive statistics. Percentage changes in values for the sum of the products of the bidimensional measurements, SUVmax, and ADC were tested for differences from zero with the one-sample t test for normally distributed data and the Wilcoxon signed-rank test for non-normally distributed data. Statistical analyses were performed with JMP Statistical Software Release 10.0.0 (SAS Institute, Inc., Cary, NC) and StatXact 10 Statistical Software for Exact Nonparametric Inference (Cytel, Inc., Cambridge, MA)..
RESULTS
Demographic and Clinical Characteristics (Table 2)
Table 2.
Demographic data of 12 patients with DLBCL
| Patient no. | Sex (M/F) | Age (y) | Disease stage* | Therapy | End of cycle 2 imaging | End of treatment response† |
|---|---|---|---|---|---|---|
| 1 | F | 67 | II | R-CHOP × 6 | PET and MRI | CR |
| 2 | M | 58.5 | II | R-CHOP × 6 | PET | PR |
| 4 | F | 66.5 | III | R-CHOP × 6 | PET and MRI | PR |
| 5 | M | 53 | IV | R-CHOP × 3 (alternating with methotrexate and cytarabine) | PET and MRI | CR |
| 6 | M | 54 | II | R-CHOP × 6 | PET and MRI | CR |
| 7 | M | 66 | IV | R-EPOCH × 6 | PET | CR |
| 8 | M | 31 | IV | R-EPOCH × 6 | PET and MRI | CR |
| 9 | F | 83 | II | R-CHOP × 4 | PET | CR |
| 10 | F | 66 | I | R-CHOP × 6 | PET and MRI | CR |
| 11 | M | 57 | IV | R-EPOCH × 6 | PET | CR |
| 12 | F | 39 | IV | R-CHOP × 6 | PET and MRI | CR |
| 13 | F | 58 | IV | R-CHOP × 6 | PET and MRI | CR |
Based on Ann Arbor classification--combination of PET/CT images, bone marrow biopsy results and physical examination.
Based on IWG criteria, combining PET/CT findings and sum of products of bidimensional measurements. CR, complete response; PR, partial response.
Between May 2011 and February 2012, 15 patients consented to participate in the study. All patients underwent PET/CT for initial staging. Whole-body DW-MRI was performed in 12 of these patients. One patient was excluded because he could not fit in the MRI scanner, another had transformed lymphoma, rather than DLBCL on final histologic evaluation, and the third withdrew consent because of the need to delay treatment to schedule the MRI. The median age of these twelve patients (six men, six women) evaluable for staging assessment was 57.5 (range 31–83 years). Their Ann Arbor stages were I in 1 patient, II in 4 and IV in 7 patients (there were no patients with stage III disease). Five patients with early-stage (I/II) disease received R-CHOP (6 cycles in four and 4 cycles in one). Of seven patients with advanced disease (III/IV), three received 6 cycles of R-CHOP, three received 6 cycles of R-EPOCH (rituximab, etoposide, prednisone, vincristine, cyclophosphamide, doxorubicin), and one received 3 cycles of R-CHOP alternating with methotrexate and cytarabine.
Baseline DW-MRI and FDG-PET were performed a median of 5.5 days apart (range 1–21 days), and the later of the two examinations was performed a median of 1.5 days (range 0–6 days) before the start of chemotherapy.
Eleven patients underwent PET/CT following cycle 2 of chemotherapy, and eight of these also underwent DW-MRI; four patients withdrew from the study before post-cycle 2 imaging. These eight patients were considered evaluable for the comparison of DW-MRI and FDG-PET at the end of cycle 2. The DW-MRI and FDG-PET studies were performed a median of 0 days apart (range 0–2 days) in these patients, and the earlier of the two examinations was performed a median of 1 day (range 0–7 days) before the start of cycle 3 of chemotherapy.
Qualitative Analysis of DW-MRI Lesion Detection
At pretreatment imaging, based on PET/CT as the reference standard, there were 46 lymph node regions and 16 organ sites of lymphomatous involvement meeting IGG criteria (see Table 3). The two DW-MRI readers agreed on the presence of abnormal signal intensity in 44 of 46 lymph node regions and in 16 of 16 organ sites. The 62 lesions had high signal intensity on both b value images and low signal intensity on ADC images. Visual detection of lung and liver lesions was not compromised by respiratory or cardiac motion.
Table 3.
Per lesion detection by anatomic regions using PET/CT as reference standard
| Anatomic Region | Lesions detected by PET/CT | Lesions detected by DW-MRI (consensus read) |
|---|---|---|
| Nodal regions | ||
| Waldeyer ring | 2 | 2 |
| Neck (right or left) | 7 | 7 |
| Supraclavicular (right or left) | 3 | 3 |
| Subpectoral (right or left) | 1 | 1 |
| Axilla (right or left) | 7 | 7 |
| Mediastinum | 2 | 2 |
| Hilar (right or left) | 4 | 4 |
| Portal | 1 | 1 |
| Gastrohepatic | 3 | 1 |
| Retroperitoneal | 4 | 4 |
| Mesenteric | 3 | 3 |
| Iliac (right or left) | 4 | 4 |
| Inguinal (right or left) | 5 | 5 |
| TOTAL | 46 | 44 |
| Organ regions | ||
| Pharynx | 2 | 2 |
| Lungs (right or left) | 3 | 3 |
| Liver | 3 | 3 |
| Spleen | 2 | 2 |
| Uterine cervix | 1 | 1 |
| Adrenal gland | 1 | 1 |
| Scalp soft tissues | 1 | 1 |
| Bone Marrow | 3 | 3 |
| TOTAL | 16 | 16 |
Based on a consensus visual assessment of b-value images, for the total of 62 lesions, the positive percent agreement between DW-MRI and PET/CT was 97% (60/62, 95% confidence interval 92%–100%). Agreement for extranodal lesions was 100% (16/16, 76%–100%) and for nodal lesions was 96% (44/46, 90%–100%) (Figure 2). Two nodal lesions, both mesenteric nodes, were missed by DW-MRI. In one case, the node could not be differentiated from adjacent bowel. In the second case, the node was in the splenic hilum and was mistaken for a splenule (Figure 3). There were no false-positive foci detected by DW-MRI by comparison with FDG-PET. DW-MRI was graded as positive for disease in 60 of 62 lesions and in 58 of 62 lesions by reviewers 1 and 2, respectively. There was no difference between observers in detection of disease presence among anatomical regions (p = 0.69). DW-MRI staging agreed with the PET-based Ann Arbor staging system in all 12 patients.
Figure 2.

56-year-old woman with stage IV DLBCL and hepatic involvement. DW-MRI and PET/CT for lesion detection. (A) Pre-treatment DW-MRI with b value 50 sec/mm2 showing two hyperintense hepatic lesions (arrows). (B) DW-MRI with b value 800 sec/mm2 showing the same tumors. (C) Corresponding axial ADC coefficient map demonstrating hyperintense lesions (ADC mean 889 μm2/s). (D) Corresponding PET/CT image with intense FDG uptake in the lesions (SUVmax 16.9).
Figure 3.
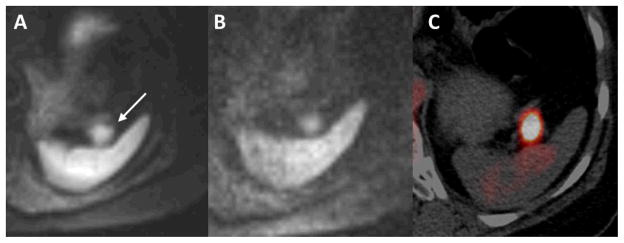
59-year-old woman with stage IV DLBCL and a false-negative mesenteric lymph node on baseline MRI. (A) Pretreatment DW-MRI (b value 50 sec/mm2) and (B) DW-MRI (b 800 sec/mm2) demonstrate a lesion with restricted diffusion in the splenic hilum (arrow), which was assumed to be a splenule. (C) Corresponding pretreatment PET/CT shows increased FDG uptake (much greater than that in the normal spleen), consistent with involvement of a lymph node near the splenic hilum.
At end of the second chemotherapy cycle, three of the eight patients who had both DW-MRI and PET/CT had persistent abnormalities on both studies, with 2 of their 38 nodal sites and 3 of their 11 extranodal lesions remaining positive (Figure 4). In one other patient with a negative PET/CT, there was one nodal station that was positive on DW-MRI (false positive DW-MRI) (Figure 5). There were no false-negative cases by DW-MRI.
Figure 4.


39-year-old woman with stage IV DLBCL. DW-MRI and PET/CT used in treatment response monitoring. There is widespread nodal involvement as well as involvement of the lungs. (A) Pretreatment DW-MRI (b value 50 sec/mm2) (top left), DW-MRI (b value 800 sec/mm2) (top right), axial ADC coefficient map (bottom left), and fused PET/CT (bottom right) demonstrate lymphadenopathy in right axillary, subpectoral and paratracheal lymph nodes, as well as a 1.5-cm left upper lobe pulmonary nodule (arrow). FDG-avid right paratracheal lymphadenopathy is not well demonstrated on the DWI as the lymph node was slightly below the selected DW-MRI imaging plane. (B) Pretreatment whole-body coronal b-50 and b-800 images (left and middle panels) and PET (right panel) show subpectoral and paratracheal lymph nodes and left upper lobe pulmonary nodule as well as a splenic mass. (C) Post therapy whole-body coronal. b-800 (left panel) and PET (right panel) images show resolution of subpectoral, mediastinal and lung abnormalities and a residual splenic mass with mildly increased FDG uptake (arrow). The b-50 DW-MR image had a similar appearance.
Figure 5.

53-year-old man with stage IV DLBCL and a false positive right axillary lymph node. (A) Pretreatment DW-MRI (b value 50 sec/mm2) demonstrates diffusion restriction in right axillary lymph nodes. (B) Corresponding pretreatment PET/CT shows increased FDG uptake. (C) Following two cycles of R-CHOP chemotherapy, there is residual diffusion signal in a right axillary lymph node. (D) This node did not demonstrate increased activity on PET/CT.
At the end of treatment, seven of the eight patients who underwent both interim PET/CT and DW-MRI had complete response, including the one with a false-positive DW-MRI at the end of cycle-2. At a median follow-up of 23.8 months, all of these patients remained free of disease. The remaining patient had a partial response and had showed persistent abnormalities on both interim FDG-PET/CT and DW-MRI; she developed myelodysplastic syndrome with refractory anemia and died 14.9 months from the diagnosis of DLBCL.
Changes in Lesion Size, SUVmax, and ADC from Initial Staging to End of Treatment
In the 8 patients who had both FDG-PET/CT and DW-MRI at end of cycle 2 of treatment, there were 24 target lesions (16 nodal masses and 8 extranodal lesions) that were analyzed prior to treatment for tumor size, SUVmax and ADC values. Mean pretreatment ADC value, tumor size and SUVmax were 772 μm2/s, 21.3 cm2 and 16.9 g/mL, respectively.
At interim treatment, all 24 target lesions showed residual disease, with mean diameter of 1.4 cm (range 4 mm to 3.9 cm). Mean post-treatment ADC value, tumor size and SUVmax were 1561.0 μm2/s, 5.7 cm2 and 2.5 g/mL, respectively. On average, ADC values increased by 85%, tumor size decreased by 74%, and SUVmax decreased by 83%. As illustrated in Figure 6, there was no overlap in pretreatment and posttreatment ADC values. The results of all measurements are presented in Table 4.
Figure 6.
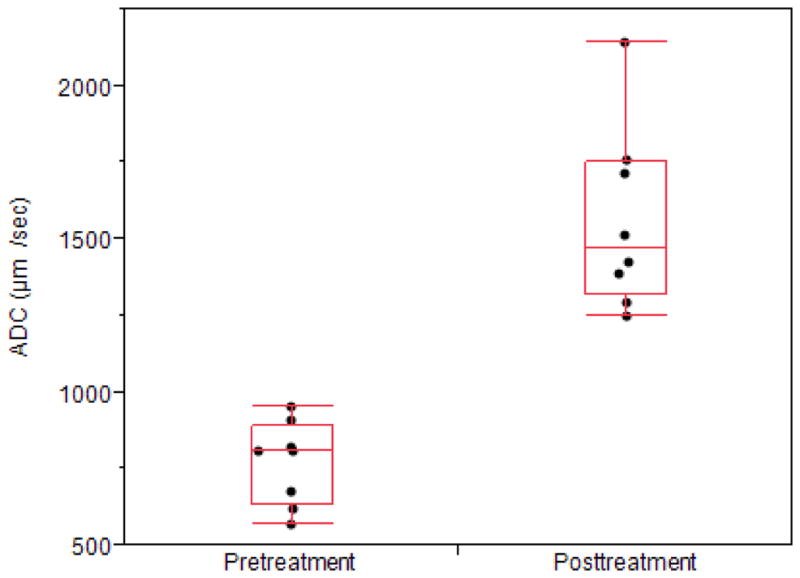
Average pre- and posttreatment ADC values. To better illustrate the distribution of the data points; they are spread horizontally to minimize overlapping. The ends of the boxes are the 25th and 75th quartiles (quartiles). The lines across the middles of the boxes are the medians. The interquartile range is the difference between the quartiles. The lines (whiskers) extend from the boxes to the outermost points that fall within the distance computed as 1.5 (interquartile range).
Table 4.
Baseline values (1), end-of-cycle-2 values (2) and percent change for sum of product of biperpendicular diameters (area, cm2 ), maximum standardized uptake value (SUVmax, g/mL), and apparent diffusion coefficient (ADC, μm2/s) for 8 subjects undergoing both interim FDG-PET/CT and DW-MRI.
| Patient No. | Area 1(cm2) | Area 2(cm2) | Decrease in Area(%) | SUV 1(g/mL) | SUV 2(g/mL) | Decrease in SUV (%) | ADC 1(μm2/sec) | ADC 2(μm2/sec) | Increase in ADC (%) | Response | Follow-up (months) |
|---|---|---|---|---|---|---|---|---|---|---|---|
| 1 | 19.5 | 9.2 | 53 | 16.7 | 3.1 | 81 | 619.3 | 1511.7 | 144 | CR | NED (25.7) |
| 4 | 24.5 | 15.1 | 38 | 8.45 | 2.87 | 66 | 810.8 | 1425.3 | 76 | PR | Dead (14.9) |
| 5 | 6.7 | 1 | 85 | 19.2 | 1.64 | 91 | 955.1 | 1761.1 | 84 | CR | NED (26.1) |
| 6 | 8.5 | 0.8 | 91 | 17.5 | 1.3 | 93 | 823.7 | 1294.3 | 57 | CR | NED (24.7) |
| 8 | 43.3 | 6.6 | 85 | 14.25 | 2.95 | 79 | 811 | 1388.2 | 71 | CR | NED (23.3) |
| 10 | 31.1 | 2.6 | 92 | 22.5 | 2.9 | 87 | 572 | 2140.3 | 274 | CR | NED (23.8) |
| 12 | 22.2 | 7.6 | 66 | 19.96 | 2.16 | 89 | 909.8 | 1715.3 | 89 | CR | NED (22.8) |
| 13 | 14.9 | 2.4 | 84 | 16.37 | 3.27 | 80 | 676.3 | 1252 | 85 | CR | NED (22.1) |
| Mean ± SD | 21.3 ± 12.0 | 5.7 ± 5.0 | 74 ± 20* | 16.9 ± 4.2 | 2.5 ± 0.7 | 83 ± 9* | 772.3 ± 136.6 | 1561.0 ± 296.8 | 85 (72–130)†* |
Significant (P < 0.01) change between baseline and end of cycle 2
Median (25th–75 percentile range).
SD, standard deviation; CR, complete response; PR, partial response, NED, no evidence of disease
DISCUSSION
This pilot study evaluated qualitative and quantitative DW-MRI for staging and early response assessment during chemotherapy in adults with DLBCL, using FDG-PET/CT as the reference standard. We demonstrated that DW-MRI appears to provide comparable information for staging of patients with DLBCL and as a biomarker of interim response to chemotherapy.
Current staging and response assessment guidelines in DLBCL are based on IGW criteria, which include visual assessment of the nodal and extranodal tumor sites on PET/CT (6,7). Our study has the advantage of a relatively large number of lesions in the qualitative analysis of lesion detection. At pretreatment imaging, there were 46 lymph node regions and 16 organ sites of lymphomatous involvement based on high signal intensity on both b value images and low signal intensity on ADC images. The results show a high level of agreement between DW-MRI and PET/CT for detecting target and non-target disease sites overall (97% agreement), and for nodal lesions (96%) and extranodal disease (100%), respectively. There were two false-negative sites on DW-MRI, both missed mesenteric nodal masses, in two patients. However, this weakness of DW-MRI may not be as important as it appears, as both patients had multiple other sites of disease. Hence, the failure to detect these lesions did not impact staging. In this study, there was 100% agreement between the PET/CT-based Ann Arbor stage and DW-MRI-based stage. A few earlier studies have demonstrated the potential of whole-body DW-MRI for lesion detection in lymphoma, but these studies included many lymphoma subtypes with different cellular density that potentially can lead to different degrees of diffusivity. In a study by Van Ufford et al., staging results of DW-MRI were concordant with PET/CT in 77% of 22 patients (2 with Hodgkin lymphoma and 20 with different histologic types of non-Hodgkin lymphoma); overstaging and understaging relative to PET/CT occurred in 0% and 23% of patients, respectively (23). A study by Lin et al. compared DW-MRI with PET/CT in 15 adults (13 with DLBCL and two with DLBLC and follicular lymphoma) and showed a nodal detection rate of 81% (73 of 91) and extranodal detection rate of 100% (21). In a study of 8 patients with heterogeneous DLBCL pathology (one relapsed and one follicular lymphoma partly transformed into DLBCL), Wu et al. reported overstaging of three of the eight patients by both DW-MRI and PET/CT, because of bone marrow infiltration that was not detected by bone marrow biopsy (24). Overall, our results suggest that in a homogeneous population of patients with DLBCL, DW-MRI and PET/CT are comparable in staging of patients with DLBCL.
The ability to document disease response or progression during therapy has the potential to allow for individualized treatment adaptation, namely intensifying or de-intensifying treatment in patients with poor or good response, respectively. Therefore, we evaluated whether DW-MRI could provide qualitative site-specific interim response information similar to that obtained using visual assessment of tumor metabolism at FDG-PET/CT imaging. Our study demonstrated site-specific response changes that were generally concordant with those on FDG-PET/CT. In the eight patients having both baseline and interim imaging studies, five of their 49 tumor sites (38 nodal and 11 extranodal) remained abnormal on visual analysis of both DW-MRI and PET/CT. However, one nodal region that was normal on interim FDG-PET/CT was falsely positive on DW-MRI, yielding an overall lesion-based concordance rate of 98% (48/49). Lin et al. reported similar results with agreement in 79 of 85 nodal regions (93%) on PET/CT and DW-MRI at interim analysis in the same 15 patients with mixed histology described above (22). In that study, 4 of 6 FDG-avid regions were falsely negative and 2 of 79 PET-negative regions were falsely positive on DW-MRI, whereas we had no false-negative cases.
Our study also determined the feasibility of quantitative DW-MRI for evaluating early chemotherapeutic response in patients with DLBCL. Within this context, we showed substantial ADC increases (median 85%, range 72–103) after cycle 2 of chemotherapy agreeing with decreased DW-MRI restriction at visual analysis and decrease in tumor size (74% decrease) and SUV values (83% decrease). For comparison, Wu et al. in 8 patients with heterogeneous DLBCL pathology, reported increases in ADC values (77% increase over mean pre-therapy ADC) after two cycles of chemotherapy, which correlated inversely with tumor burden on PET/CT (mean decrease 59%) and with tumor volume on MRI (mean decrease 65%) (24).
The strengths of our study are a homogeneous tumor pathology, relatively uniform chemotherapy, and analysis of multiple disease sites, rather than a single nodal site, to assess staging and treatment response, similar to the IWG criteria. Homogeneous tumor pathology is of particular importance in tumor detection and response monitoring, because subtypes of non-Hodgkin lymphomas, such as follicular and DLBCL, are characterized by differing microscopic ultrastructure, which potentially can lead to differences in signal intensity and ADC values, and may in part explain differences between our study and those reported in the literature.
The main limitation of this study is the small study population. Accordingly, it is not possible for us to define a “threshold” or cutoff ADC value for predicting response. Nevertheless, our results suggest that a visual assessment of DW-MRI, akin to that used in PET/CT, is a viable option for staging and for interim response assessment during chemotherapy in patients with DLBCL. Another potential limitation is that we limited our study to a 1.5-T MRI scanner. However, at present, DW-MRI in the body appears to be more robust when performed at 1.5 T rather than 3.0 T, because of the ability to suppress fat uniformly over a large field of view and fewer susceptibility artifacts (16, 27,28). We also used SPAIR to optimize fat suppression. This sequence can be sensitive to inhomogeneities over large FOVs. For larger FOVs, STIR or a spectral-spatial water-only excitation technique may work better than chemical-selective sequences, such as SPAIR (29). However, overall, our image quality was judged subjectively to be excellent and the agreement was 97% between DW-MRI and PET/CT, suggesting that SPAIR did not have a negative impact on our results. Third, histologic confirmation of response was not available, although it would not be feasible or ethical to obtain histology from all suspect nodes and organs. We based the presence or absence of disease on FDG-PET/CT, which is widely acknowledged as the reference standard for evaluating patients with DLBCL (2–7). Fourth, we could not determine whether the magnitude of change in ADC values after cycle 2 of chemotherapy will predict response at the end of treatment. Although we have follow-up of these patients for a median of nearly two years, the small sample, which included only one patient with a partial response at interim assessment, precludes meaningful assessment of the ability of DW-MRI findings to predict long-term outcome.
We conclude that DW-MRI has potential to be an effective method for detecting DLBCL lesions and for identifying responders during therapy. The results of this study have important implications for future treatment of DLBCL. If the utility of DW-MRI for response assessment can be confirmed, it may allow for response-adapted treatment strategies, with a reduction in the radiation burden now associated with FDG-PET/CT imaging. Our results also suggest that ultimately, FDG-PET/MRI rather than FDG-PET/CT and MRI performed separately may prove to be ideal for evaluation of this patient population.
Acknowledgments
Research reported in this publication was supported in part by funding from the Mallinckrodt Institute of Radiology and by the Washington University Institute of Clinical and Translational Sciences Grant UL1 TR000448 from the National Center for Advancing Translational Sciences (NCATS) of the National Institutes of Health (NIH). . We thank the Alvin J. Siteman Cancer Center at Washington University School of Medicine and Barnes-Jewish Hospital in St. Louis, Missouri for the use of the Imaging and Response Assessment Core. The Siteman Cancer Center is supported in part by National Cancer Institute Cancer Center Support Grant P30 CA091842. The content is solely the responsibility of the authors and does not necessarily represent the official view of the NIH. We also thank Jeanine Wade and Glenn Foster for their technical assistance with this study.
Abbreviations
- ADC
apparent diffusion coefficient
- CR
complete response
- DLBCL
diffuse large B-cell lymphoma
- DW-MRI
diffusion-weighted magnetic resonance imaging
- FDG
18F-fluorodeoxyglucose
- IWG
International Working Group
- PET/CT
positron emission tomography/computed tomography
- PR
partial response
- R-CHOP
rituximab, cyclophosphamide, doxorubicin, vincristine (Oncovin®) and prednisone
- R-EPOCH
rituximab, etoposide, prednisone, vincristine, cyclophosphamide, doxorubicin
- ROI
region of interest
- SUVmax
maximum standardized uptake value
References
- 1.Jemal A, Siegel R, Ward E, Murray T, Xu J, Thun MJ. Cancer statistics, 2007. CA Cancer J Clin. 2007;57:43–66. doi: 10.3322/canjclin.57.1.43. [DOI] [PubMed] [Google Scholar]
- 2.Juweid ME, Cheson BD. Role of positron emission tomography in lymphoma. J Clin Oncol. 2005;23:4577–4580. doi: 10.1200/JCO.2005.01.904. [DOI] [PubMed] [Google Scholar]
- 3.Juweid ME, Cheson BD. Positron-emission tomography and assessment of cancer therapy. N Engl J Med. 2006;254:496–507. doi: 10.1056/NEJMra050276. [DOI] [PubMed] [Google Scholar]
- 4.Kwee TC, Kwee RM, Nievelstein RA. Imaging in staging of malignant lymphoma: a systematic review. Blood. 2008;111:504–516. doi: 10.1182/blood-2007-07-101899. [DOI] [PubMed] [Google Scholar]
- 5.Shankar LK, Hoffman JM, Bacharach S, Graham MM, Karp J, Lammertsma A, Larson S, Mankoff DA, Siegel BA, Van den Abeele A, Yap J, Sullivan D. Consensus recommendations for the use of 18F-FDG PET as an indicator of therapeutic response in patients in National Cancer Institute trials. J Nucl Med. 2006;47:1059–1066. [PubMed] [Google Scholar]
- 6.Cheson BD, Pfistner B, Juweid ME, Gascoyne RD, Specht L, Horning SJ, Coiffier B, Fisher RI, Hagenbeek A, Zucca E, Rosen ST, Stroobants S, Lister TA, Hoppe RT, Dreyling M, Tobinai K, Vose JM, Connors JM, Federico M, Diehl V. Revised response criteria for malignant lymphoma. J Clin Oncol. 2007;25:579–586. doi: 10.1200/JCO.2006.09.2403. [DOI] [PubMed] [Google Scholar]
- 7.Juweid ME, Stroobants S, Hoekstra OS, Mottaghy FM, Dietlein M, Guermazi A, Wiseman GA, Kostakoglu L, Scheidhauer K, Buck A, Naumann R, Spaepan K, Hicks RJ, Weber WA, Reske SN, Schwaiger M, Schwartz LH, Zijlstra JM, Siegel BA, Cheson BD. Use of positron emission tomography for response assessment of lymphoma: consensus of the Imaging Subcommittee of International Harmonization Project in Lymphoma. J Clin Oncol. 2007;25:571–578. doi: 10.1200/JCO.2006.08.2305. [DOI] [PubMed] [Google Scholar]
- 8.Cashen AF, Dehdashti F, Luo J, Homb A, Siegel BA, Bartlett NL. 18F-FDG PET/CT for early response assessment in diffuse large B-cell lymphoma: poor predictive value of international harmonization project interpretation. J Nucl Med. 2011;52:386–92. doi: 10.2967/jnumed.110.082586. [DOI] [PMC free article] [PubMed] [Google Scholar]
- 9.Halasz LM, Jacene HA, Catalano PJ, Van den Abbeele AD, Lacasce A, Mauch PM, Ng AK. Combined modality treatment for PET-positive non-Hodgkin lymphoma: favorable outcomes of combined modality treatment for patients with non-Hodgkin lymphoma and positive interim or postchemotherapy FDG-PET. Int J Radiat Oncol Biol Phys. 2012;83:e647–54. doi: 10.1016/j.ijrobp.2012.01.060. [DOI] [PubMed] [Google Scholar]
- 10.Itti E, Meignan M, Berriolo-Riedinger A, Biggi A, Cashen AF, Véra P, Tilly H, Siegel BA, Gallamini A, Casanovas RO, Haioun C. An international confirmatory study of the prognostic value of early PET/CT in diffuse large B-cell lymphoma: comparison between Deauville criteria and ΔSUVmax. Eur J Nucl Med Mol Imaging. 2013;40:1312–1320. doi: 10.1007/s00259-013-2435-6. [DOI] [PubMed] [Google Scholar]
- 11.Zinzani PL. PET in T-Cell Lymphoma. Curr Hematol Malig Rep. 2011;6:241–644. doi: 10.1007/s11899-011-0098-6. [DOI] [PubMed] [Google Scholar]
- 12.Brenner DJ, Elliston CD. Estimated radiation risks potentially associated with full-body CT screening. Radiology. 2004;232:735–738. doi: 10.1148/radiol.2323031095. [DOI] [PubMed] [Google Scholar]
- 13.Koh D-M, Collins DJ. Diffusion-weighted MRI in the body: applications and challenges in oncology. AJR. 2007;188:1622–1635. doi: 10.2214/AJR.06.1403. [DOI] [PubMed] [Google Scholar]
- 14.Lichy MP, Aschoff P, Plathow C, Stemmer A, Horger W, Mueller-Horvat C, Steidle G, Horger M, Schafer J, Eschmann SM, Kiefer B, Claussen CD, Pfannenberg C, Schlemmer HP. Tumor detection by diffusion- weighted MRI and ADC-mapping–initial clinical experiences in comparison to PET-CT. Invest Radiol. 2007;42:605–613. doi: 10.1097/RLI.0b013e31804ffd49. [DOI] [PubMed] [Google Scholar]
- 15.Malayeri AA, El Khouli RH, Zaheer A, Jacobs MA, Corona-Villalobos CP, Kamel IR, Macura KJ. Principles and applications of diffusion-weighted imaging in cancer detection, staging, and treatment follow-up. Radiographics. 2011;31:1773–91. doi: 10.1148/rg.316115515. [DOI] [PMC free article] [PubMed] [Google Scholar]
- 16.Padhani AR, Koh D-M, Collins DJ. Whole-body diffusion-weighted MR imaging in cancer: current status and research directions. Radiology. 2011;261:700–718. doi: 10.1148/radiol.11110474. [DOI] [PubMed] [Google Scholar]
- 17.Takahara T, Imai Y, Yamashita T, Yasuda S, Nasu S, Van Cauteren M. Diffusion weighted whole body imaging with background body signal suppression (DWIBS): technical improvement using free breathing STIR and high resolution 3D display. Rad Med. 2004;4:275–282. [PubMed] [Google Scholar]
- 18.Gu J, Chan T, Zhang J, Leung AY, Kwong YL, Khong PL. Whole body diffusion weighted imaging: the added value to whole body MRI at initial diagnosis of lymphoma. AJR. 2011;197:W384–W391. doi: 10.2214/AJR.10.5692. [DOI] [PubMed] [Google Scholar]
- 19.Kwee TC, van Ufford HM, Beek FJ, Takahara T, Uiterwaal CS, Bierings MB, Ludwig I, Fijnheer R, Nievelstein RA. Whole-body MRI, including diffusion-weighted imaging, for the initial staging of malignant lymphoma: comparison to computed tomography. Invest Radiol. 2009;44:683–690. doi: 10.1097/RLI.0b013e3181afbb36. [DOI] [PubMed] [Google Scholar]
- 20.Lichy MP, Aschoff P, Plathow C, Stemmer A, Horger W, Mueller-Horvat C, Steidle G, Horger M, Schafer J, Eschmann SM, Kiefer B, Claussen CD, Pfannenberg C, Schlemmer HP. Tumor detection by diffusion weighted MRI and ADC-mapping–initial clinical experiences in comparison to PET-CT. Invest Radiol. 2007;42:605–613. doi: 10.1097/RLI.0b013e31804ffd49. [DOI] [PubMed] [Google Scholar]
- 21.Lin C, Luciani A, Itti E, El-Gnaoui T, Vignaud A, Beaussart P, Lin SJ, Belhadj K, Brugières P, Evangelista E, Haioun C, Meignan M, Rahmouni A. Whole-body diffusion-weighted magnetic resonance imaging with apparent diffusion coefficient mapping for staging patients with diffuse large B-cell lymphoma. Eur Radiol. 2010;20:2027– 2038. doi: 10.1007/s00330-010-1758-y. [DOI] [PubMed] [Google Scholar]
- 22.Lin C, Itti E, Luciani A, Zegai B, Lin SJ, Kuhnowski F, Pigneur F, Gaillard I, Paone G, Meignan M, Haioun C, Rahmouni A. Whole-body diffusion-weighted imaging with apparent diffusion coefficient mapping for treatment response assessment in patients with diffuse large B-cell lymphoma. Invest Radiol. 2011;46:341–349. doi: 10.1097/RLI.0b013e3182087b03. [DOI] [PubMed] [Google Scholar]
- 23.Van Ufford He, Kwee TC, Beek FJ. Newly diagnosed lymphoma: initial results with whole-body T1-weighted, STIR, and diffusion-weighted MRI compared With 18F-FDG PET/CT. AJR. 2011;196:662–669. doi: 10.2214/AJR.10.4743. [DOI] [PubMed] [Google Scholar]
- 24.Wu X, Kellokumpu-Lehtinen PL, Pertovaara H, Korkola P, Soimakallio S, Eskola H, Dastidar P. Diffusion-weighted MRI in early chemotherapy response evaluation of patients with diffuse large B-cell lymphoma – a pilot study: comparison with 2-deoxy-2-fluoro- D-glucose-positron emission tomography/computed tomography. NMR in Biomedicine. 2011;24:1181–1190. doi: 10.1002/nbm.1689. [DOI] [PubMed] [Google Scholar]
- 25.Kwee TC, Ludwig I, Uiterwaal CS, van Ufford HM, Vermoolen MA, Fijnheer R, Bierings MB, Nievelstein RA. ADC measurements in the evaluation of lymph nodes in patients with non-Hodgkin lymphoma: feasibility study. Magn Reson Mater Phy. 2011;24:1–8. doi: 10.1007/s10334-010-0226-7. [DOI] [PubMed] [Google Scholar]
- 26.Blalock HM. Social Statistics. New York: McGraw-Hill Book Company; 1979. pp. 213–215. [Google Scholar]
- 27.Koh D-M, Tunariu N, Blackledge M, Collins DJ. Competing technology for PET/computed tomography. Diffusion-weighted magnetic resonance imaging. PET Clin. 2013;8:259–277. doi: 10.1016/j.cpet.2013.03.002. [DOI] [PubMed] [Google Scholar]
- 28.Padhani AR, Liu G, Koh DM, Chenevert TL, Thoeny HC, Takahara T, Dzik-Jurasz A, Ross BD, Van Cauteren M, Collins D, Hammoud DA, Rustin GJ, Taouli B, Choyke PL. Diffusion-weighted magnetic resonance imaging as a cancer biomarker: consensus and recommendations. Neoplasia. 2009;11:102–125. doi: 10.1593/neo.81328. [DOI] [PMC free article] [PubMed] [Google Scholar]
- 29.Koh D-M, Blackedge M, Padhani AR, et al. Whole-body diffusion-weighted MRI: tips, tricks, and pitfalls. AJR. 2012;199:252–262. doi: 10.2214/AJR.11.7866. [DOI] [PubMed] [Google Scholar]