Abstract
Background
Galectins are known to regulate cell differentiation and growth as well as cell adhesion and apoptosis. Galectins have been discussed as possible prognosticators for survival in renal cell cancer (RCC) and other urological tumors. They might also play an emerging role as possible new marker-proteins for RCC. In this study, we analyzed the expression of galectin-1 and galectin-3 mRNA in order to further investigate their clinical significance in RCC.
Methods
Tissue samples were obtained from 106 patients undergoing surgery for RCC. The expression of galectin-1 and galectin-3 mRNA in normal kidney and corresponding cancer tissue was analyzed using quantitative real time PCR. Differences in expression levels of paired tissue samples were assessed using paired two-sample tests. Associations of relative mRNA expression levels in tumor tissues with clinical findings were analyzed using univariate logistic regression.
Results
The expression of galectin-1 (p < 0.001) and -3 (p < 0.001) mRNA were significantly higher in RCC when compared to the adjacent normal kidney tissue. For clear cell RCC, an association of male gender with higher galectin-1 and galectin-3 mRNA expression (p = 0.054, p = 0.034) was detected. For all RCCs, galectin-1 mRNA expression failed to show a significant association with advanced disease as well as a higher rate of lymph node metastases (p = 0.058, p = 0.059).
Conclusion
The mRNA expression of galectin-1 and galectin-3 is significantly increased in RCC cancer tissue. The higher mRNA expression in tumor tissue of male patients raises the question of a functional connection between galectins and the higher prevalence of RCC in men. Associations with advanced disease might lead to new ways of identifying patients at higher risk of recurrent disease and might even facilitate early metastasectomy with curative intent.
Keywords: Galectin, Renal cell carcinoma, Biomarker, Prognosis
Background
RCC accounts for approximately 2–3% of all malignancies in adults with a higher incidence in males. Incidence peaks in the sixth and seventh decade of life [1,2]. A variety of risk factors for RCC, such as obesity and tobacco exposure, have been proposed in the past [1,3]. The incidence of RCC is increasing, most likely due to the wide implementation of imaging modalities, such as ultrasonography and CT-scanning [4]. The clinical course of the tumor is not or at least difficult to predict [5]. Decision making on active treatment and surveillance is therefore difficult, especially in the elderly population where aggressive surgery might put the patient at an increased peri-operative risk. Although there are no randomized controlled trials, there is evidence for a benefit of early and complete metastasectomy in patients with RCC with regard to an improved overall survival [6]. Given these difficulties of clinical decision making, there is a strong need for risk stratification in order to improve early identification of patients with recurrent disease after curative treatment. However reliable predictive biomarkers to adequately assess the hazard of treated and untreated patients with RCC are currently lacking.
Galectins are proteins of 30 kDa that can be found in the cellular nucleus, the cytosol and also in the extracellular space. They are members of the lectin family, a group of β-galactoside binding proteins. Lectins had previously been shown to be involved in several cellular functions, such as cell-cell interactions, cell adhesion, proliferation, angiogenesis, inflammation, fibrogenesis and apoptosis [7-10]. We previously reported on alterations of galectin expression in prostate and bladder cancer [11,12]. Out of the currently described 18 galectins, we focused our research on galectin-1 and -3 because they both had previously been correlated with the development of various malignancies [13-15]. Objective of our current study was the further characterization of galectin-1 and -3 mRNA expression in RCC. Furthermore we were looking for correlations of galectin-1 and -3 mRNA expression with clinical parameters including progression free survival.
Methods
Tissue sampling
Tissue from the tumor itself and adjacent corresponding tumor free renal tissue of 106 patients undergoing kidney surgery were collected between 2001 and 2005. Samples were collected at Eberhard Karls University Tuebingen. All tissue samples were obtained during the operation. Adjacent normal appearing tissues were sampled ≈0.5-2 cm distant from the margin of the primary tumor site. All samples were collected immediately after surgery, snap frozen in liquid nitrogen and stored at -80°C. Tissue was selected to include at least 75% vital tumor.
Tumor stages and histological subtypes were assessed according to the UICC 2002 issue of the TNM system [16] by two separate pathologists. Grading was based on the Fuhrman grading system [17] while histological subtypes were defined in accordance with the consensus classification of renal cell neoplasia [18]. All patients were systemic therapy-naïve and did not receive any neoadjuvant treatment before definitive surgery.
Localized RCC was defined as pT ≤ 2 without lymph node involvement or the presence of organ-metastasis and grading ≤ G2, while advanced RCCs were defined as pT ≥ 3 or lymph node positive or organ metastasis or > G2.
All data were gathered by data managers and physicians and maintained by a relational database. The approval was granted by the ethics committee (Ethics Committee of the Medical Faculty, University of Tuebingen - Germany) and informed consent was obtained from all patients prior to surgery. Patient’s clinical and histopathological parameters are summarized in Table 1.
Table 1.
Histopathological and clinical parameters of patients with RCC
| Patient characteristics | All RCC all tumours | % |
|---|---|---|
|
Total |
106 |
100% |
|
Patients |
|
|
| Age (mean; ± SD) |
63.7 (11.8) |
|
| Male |
68 |
64.2% |
| Female |
38 |
35.8% |
|
Histology |
|
|
| Clear cell |
77 |
72.6% |
| Papillary |
22 |
20.7% |
| Chromophobe |
5 |
4.7% |
| Other/not classified |
2 |
1.9% |
|
Stage |
|
|
| NA |
3 |
2.8% |
| pT1 |
9 |
8.5% |
| pT1a |
32 |
30.2% |
| pT1b |
20 |
18.9% |
| pT2 |
5 |
4.7% |
| pT3 |
3 |
2.8% |
| pT3a |
10 |
9.4% |
| pT3b |
24 |
22.6% |
| pT4 |
0 |
0% |
|
Grade |
|
|
| G1 |
17 |
16% |
| G1-2 |
15 |
14.2% |
| G2 |
57 |
53.8% |
| G2-3 |
7 |
6.6% |
| G3 |
10 |
9.4% |
|
LN metastasis* |
11 |
10.4% |
|
Visceral metastasis* |
23 |
21.7% |
|
advanced/metastatic disease |
|
|
| (pT3-4 or N+/M+/>G2) | 49 | 46.2% |
∗At time of surgical intervention. SD = standard deviation, LN = lymph node, N+ = lymph node metastasis, M+ = organ metastasis.
Patients
The mean age of all patients was 63.7 years (SD ± 11.8). The male-female ratio was 68/38 (64.2% / 35.8%). Histopathological subclassification showed 77 patients with clear cell RCC, 22 patients with papillary and five patients with chromophobe tumors; two patients had non-classified histology.
Primary cells
For an external reference control, renal proximal tubular epithelial cells (RPTEC; Lonza (Basel, Switzerland) were cultured and prepared according to the manufacturers instructions.
Quantitative real-time PCR analysis
Of each tissue sample two sections were stained with hematoxylin-eosin and evaluated by a pathologist. Tissue was prepared from 20 cryo sections (each 20 μm). The total RNA was then extracted using TriReagent (Ambion). Conversion into single-stranded complementary DNA (cDNA) was performed using the High Capacity cDNA Reverse Transcription Kit (Applied Biosystems, Foster City, CA, USA). For quantitative real time PCR (qRT-PCR), we used the ABI 7900 Fast Sequence Detection System with universal PCR master mix and TaqMan expression assays (Applied Biosystems) according to the manufacturers instructions. The here used TaqMan assays were LGALS1 (Assay ID: Hs00355202_m1), LGALS3 (Assay ID: Hs00173587_m1), RPL13A (Hs03043885_g1), HPRT1 (Hs99999909_m1) and GUSB (Hs00939627_m1). The human RPL13A, HPRT1 and GUSB transcripts were used as endogenous controls. For biological control, we used cDNA from RPTEC primary cell transcripts. In addition, blank, no-template and no reverse transcription controls were included for each measurement. The method of Livak et al. [19] and reference ΔCt values derived from the biological reference RPTEC were used for calculation of ΔΔCt and all relative quantity values. Data were assessed using the SDS 2.3 Manager, dataAssist V1.0 software. The endogenous controls RPL13A, HPRT1 and GUSB were combined using the dataAssist software V1.0 and "arithmetic mean" as method for normalization. 106 measurements for galectin-1 expression were successfully performed; for galectin-3 one measurement did not meet the standards and was excluded. All statistics and graphics were performed using the statistical programming language R 2.15-2. For graphical analysis we used assorted differences plots, jitter plots and bean plots that were generated using R statistical software [20]. In all statistical tests the two-sided type-I-error was set to 5%. For statistical analysis of galectin mRNA expression in tumor vs. paired adjacent tissue, we used the paired t-test and the Wilcoxon signed-rank test. For correlation of relative expression levels with recurrence free survival we dichotomized our data according to median, mean as well as stepwise dichotomization analysis. Kaplan-Meier analysis and Cox regression was then used to evaluate the influence of mRNA expression patterns on recurrence free survival. Logistic regression was used to correlate galectin mRNA expression with clinical parameters.
Results
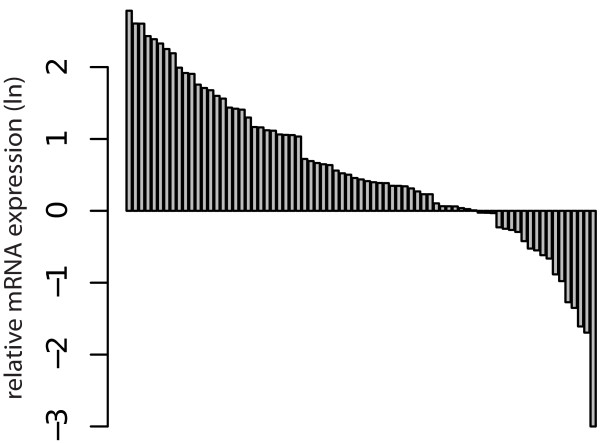
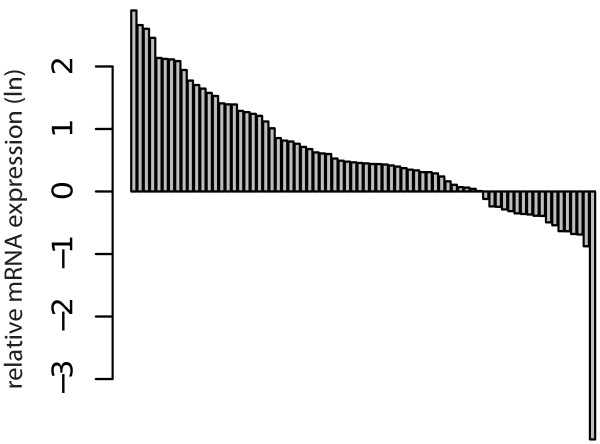
Paired analysis of tumorous kidney tissue in comparison with adjacent microscopically normal appearing tissue was performed with 75 samples for galectin-1 and galectin-3 mRNA expression. Patient characteristics are depicted in Table 2. The mRNA expression of galectin-1 (p < 0.001, Figure 1) and galectin-3 (p < 0.001, Figure 2) were significantly higher in RCC when compared to the surrounding normal kidney tissue in paired analysis.
Table 2.
Histopathological and clinical parameters of patients subjected to paired analysis of galectin-1 and galectin-3 expression in tumors vs. adjacent normal kidney tissue
| Patients for paired analysis | No. | % |
|---|---|---|
|
Total |
75 |
100% |
|
Patients |
|
|
| Age (mean; ±SD) |
67 (11.8) |
|
| Male |
46 |
61.3% |
| Female |
29 |
38.7% |
|
Histology |
|
|
| Clear cell |
58 |
77.3% |
| Papillary |
12 |
16% |
| Chromophobe |
4 |
5.3% |
| Other/notclassified |
1 |
1.3% |
|
Stage |
|
|
| NA |
3 |
4% |
| pT1 |
4 |
5.3% |
| pT1a |
24 |
32% |
| pT1b |
14 |
18.7% |
| pT2 |
4 |
5.3% |
| pT3 |
1 |
1.3% |
| pT3a |
6 |
8% |
| pT3b |
19 |
25.3% |
| pT4 |
0 |
0% |
|
Grade |
|
|
| G1 |
9 |
12% |
| G1-2 |
11 |
14.7% |
| G2 |
40 |
53.3% |
| G2-3 |
6 |
8% |
| G3 |
9 |
12% |
|
LN metastasis* |
7 |
9.3% |
|
Visceral metastasis* |
19 |
25.3% |
|
locally advanced/metastatic |
|
|
| disease (pT3>4 and/or N/M+) | 36 | 48% |
∗At time of surgical intervention. SD = standard deviation, LN = lymph node, N+ = lymph node metastasis, M+ = organ metastasis.
Figure 1.
Assorted differences plot for paired analysis: Difference between relative logarithmic (ln) expressions of galectin-1 mRNA in RCC tissue compared to the surrounding normal kidney tissue (p < 0.001).
Figure 2.
Assorted differences plot for paired analysis: Difference between relative logarithmic (ln) expressions of galectin-3 mRNA in RCC tissuecompared to the surrounding normal kidney tissue (p < 0.001).
For galectin-1, mean mRNA expression in RCC and adjacent normal tissue was 1.57 (SD 0.86) and 0.99 (SD 0.62). For galectin-3, mean expression was -0.3 (SD 0.88) and -0.9 (SD 0.53) respectively. Relative expression levels with regard to sample and tumor characteristics are depicted in Table 3.
Table 3.
Histopathological parameters and relative expression levels of galectin-1/3 mRNA in all patients with RCC
| Sample/pathology | n | Mean relative expression (ΔΔCt) | SD |
|---|---|---|---|
|
LGALS1 |
106 |
|
|
| Male |
68 |
1.58 |
0.87 |
| Female |
38 |
1.37 |
0.91 |
| Age (< median) |
54 |
1.50 |
0.96 |
| Age (≥ median) |
52 |
1.48 |
0.81 |
| M0 |
83 |
1.41 |
0.90 |
| M+ |
23 |
1.77 |
0.78 |
| N0 |
95 |
1.44 |
0.86 |
| N+ |
11 |
1.97 |
1.03 |
| Localized RCC* |
57 |
1.34 |
0.89 |
| Advanced RCC* |
49 |
1.67 |
0.86 |
| Grade (≤2) |
89 |
1.46 |
0.85 |
| Grade (> 2) |
17 |
1.63 |
1.09 |
|
LGALS3 |
105 |
|
|
| Male |
38 |
-0.41 |
1.04 |
| Female |
67 |
-0.06 |
0.79 |
| Age (< median) |
54 |
-0.25 |
0.97 |
| Age (≥ median) |
51 |
-0.12 |
0.82 |
| M0 |
82 |
-0.18 |
0.90 |
| M+ |
23 |
-0.23 |
0.92 |
| N0 |
94 |
-0.21 |
0.86 |
| N+ |
11 |
-0.001 |
1.23 |
| Localized RCC* |
56 |
-0.13 |
0.91 |
| Advanced RCC* |
49 |
-0.25 |
0.89 |
| Grade (≤ 2) |
88 |
-1.62 |
0.9 |
| Grade (> 2) | 17 | -0.43 | 0.91 |
SD = standard deviation, N+ = lymph node metastasis, M+ = organ metastasis. ∗Advanced RCC was defined as pT ≥3, N1 and/or M1, or G>2.
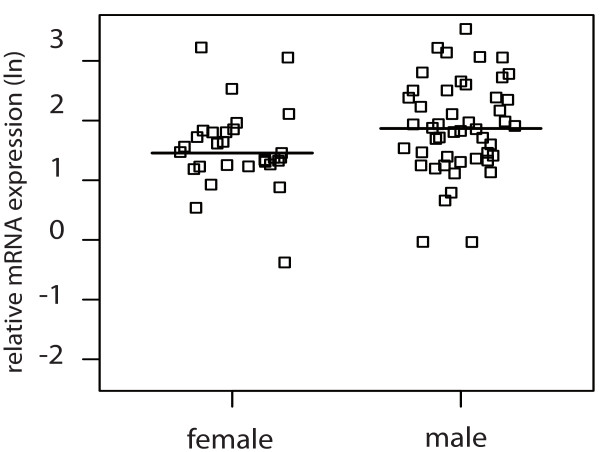
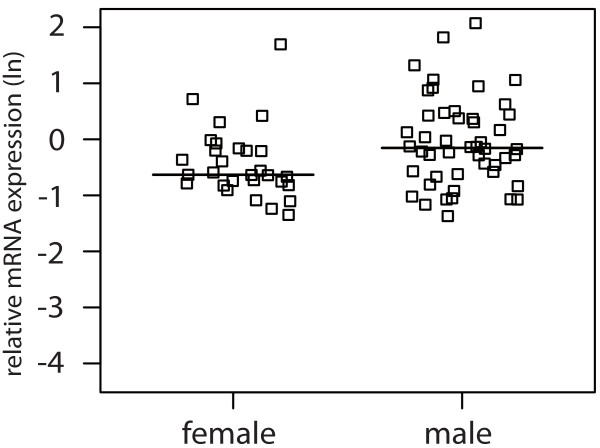
For clear cell RCC, logistic regression showed an association of male gender with higher galectin-1 (p = 0.054) and -3 (p = 0.034) mRNA expression as depicted in Figure 3 and Figure 4.
Figure 3.
Jitter plot showing the relative logarithmic (ln) expression of galectin-1 mRNA in clear cell RCC tissue in male and female patients (p = 0.054) with the horizontal line indicating the median expression level.
Figure 4.
Jitter plot showing the relative logarithmic (ln) expression of galectin-3 mRNA in clear cell RCC tissue in male and female patients (p = 0.034) with the horizontal line indicating the median expression level.
These gender differences were seen exclusively in clear cell RCC tissue and did not occur in the corresponding normal tissue.
We also compared clinical parameters with the expression of galectin-1 and galectin-3. Clinical follow up was available for 43 patients. As could be expected, recurrence free survival was associated with advanced disease (p = 0.01) and metastases (p = 0.002). However no correlation between galectin-1 (p = 0.11) or galectin-3 expression (p = 0.214) and RCC recurrence after 75 month could be demonstrated in univariate analysis.
When dichotomizing our data according to the mean expression level or in stepwise dichotomization analysis, no differences with regard to recurrence free survival could be demonstrated in Cox regression or Kaplan Meier analysis.
There was no association of galectin-1 (p = 0.48) or galectin-3 (p = 0.45) mRNA expression with tumor grade.
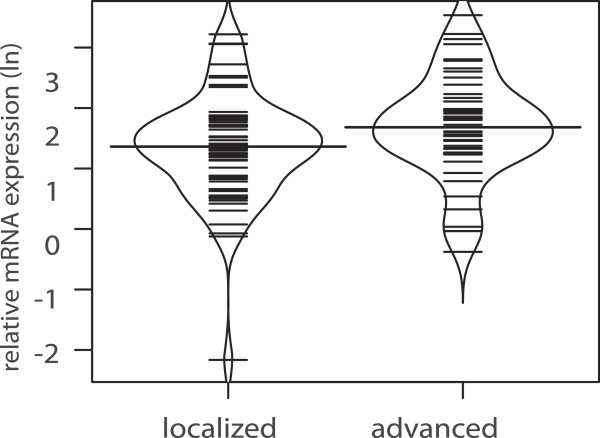
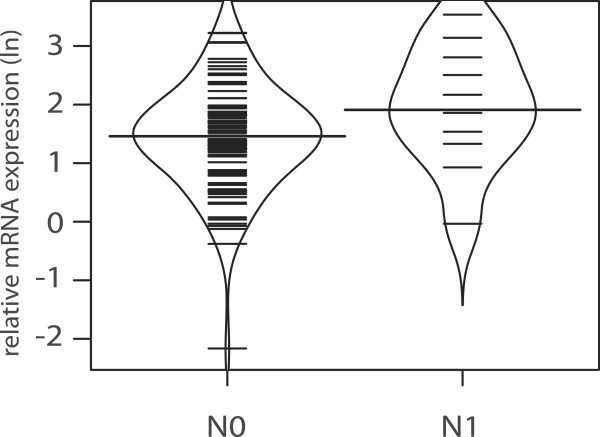
When looking at extend of disease, galectin-1 mRNA expression for all patients with RCC failed to reach the significance level with regard to advanced disease (p = 0.058, Figure 5) and lymph node metastasis (p = 0.059, Figure 6).
Figure 5.
Bean plot analysis of relative logarithmic (ln) galectin-1 expression in patients with localized vs. advanced disease (p = 0.058) with the horizontal line indicating the median expression level.
Figure 6.
Bean plot analysis of relative logarithmic (ln) galectin-1 expression in patients with- and without nodal involvement (p = 0.059). The horizontal line is indicating the median expression level.
Discussion
Galectin-1 had previously been shown to be elevated in a variety of cancers such as head and neck squamous cell carcinoma, thyroid cancer or hepatocellular carcinoma [13,14,21]. Moreover, the plasma levels of galectin-1 were shown to be significantly higher in RCC patients when compared to healthy controls [15]. Galectin-3 had also previously been associated with several cancer entities, such as small-cell lung cancer, gastric and colorectal cancer [22-24]. Previous studies were able to show an up-regulation of galectin-3 in RCC [25,26].
It is well known that the expression of galectin variants varies between different organ tissues [27]. Therefore we took great interest in identifying the relative galectin-1 and galectin-3 mRNA concentration by using tumor and non-tumor tissue from the same patient as reference. By doing so, we were able to eliminate any intra individual variance in distribution of galectin-1 and -3.
In contrast to our findings, previous studies implicated a possible negative correlation of galectins with regard to RCC cancer [28]. Albeit, these results were based on immunohistochemistry of proteins and not on mRNA expression analysis, they show that the physiological role of galectins is highly complicated and may vary between subtypes. Additionally, among the tumor samples of the aforementioned study a high expression of galectin-3 was initially noted that vanished with increasing stage and grade among tumors and therefore showed the reported results.
In the present study a significantly increased expression of galectin-1 and galectin-3 mRNA in RCC was shown when compared to normal adjacent renal tissue.
These findings support the hypothesis that galectin-1 and -3 may play a role in RCC progression or carcinogenesis. In this study extend of disease and lymph node involvement did not correlate with galectin-1 or galectin-3 mRNA expression.
Significance levels were narrowly missed. Others could show a significant correlation of advanced RCC and metastasis for galectin-3 using real time PCR as well as immunehistochemistry [29].
Our findings of higher galectin-1 and -3 levels in clear cell RCC tissue of male patients and the fact that neither of the two encoding genes is located on the sex chromosomes is very interesting since RCC most predominantly occurs in the male population.
With regard to a possible mechanism of action, previous data on various tumors suggest that galectin-3 may mediate invasion and the migration of cancer cells via the Wnt/ β-catenin signaling pathway and Akt (Protein Kinase B) phosphorylation. The proposed model describes galectin-3 to increase Akt phosphorylation, thereby increasing phosphorylation and inactivation of glycogen synthase kinase-3 β (GSK-3 β). With inactivation of GSK-3 β, the degradation of β-catenin is reduced. With increased cellular levels, β-Catenin can translocate to the nucleus and activate transcription after binding to transcription factors [30,31]. Others have argued that the effect of galectins in the immune T-cell response plays an important role: Higher levels of galectin-3 for instance have previously been shown to induce T-cell apoptosis, thereby providing a potential immune escape mechanism [32]. The latter findings originate from animal models, colorectal cancer research or in vitro studies. The impact of galectin mediated T-cell supression had not yet been fully shown in RCC [33,34].
Our findings are not without limitations. One possible issue in our evaluation might be a possible contamination of renal cell tissue with lymphocytes. Lymphatic cells are often predominantly found in or around cancerous tissue. It has been shown that the expression of galectins is upregulated in the presence of stimulated B-cells where they play a putative role in immune modulation and T-cell control [35]. Likewise immune mediated activation of T-cells is known to lead to an increased expression of galectin-1 [36]. In view of our histopathological control sections we can however exclude higher concentrations of lymphatic tissue invasion. Therefore the aforementioned confounding effects may not play an important role in this study. In addition, our data are in accordance with other studies showing equivalent elevations of galectins in cancerous tissue [26,29,37,38].
Our data on galectin-1 and -3 encourage further investigations such as the influence on survival in larger patient cohorts or the relevance of these proteins with regard to new therapeutic agents and targeted therapy. Further studies should also include the role of galectin-1 and -3 on the protein level as well as sex specific expression.
Conclusion
To our knowledge this is the first study simultaneously correlating clinical tumor parameters with galectin-1 and -3 using real time PCR and mRNA expression patterns. The here found higher expression of galectin-1 and galectin-3 in male patients might lead to further molecular and biochemical research with regard to gender specific differences for the prevalence of RCC. The shown results regarding with advanced RCCs might lead to new ways of identifying patients at higher risk of recurrent disease and might even facilitate early metastasectomy.
Competing interests
The authors declare that they have no competing interests.
Authors’ contributions
CAJK, study design, interpretation of results and draft of manuscript. MWK, interpretation of results, final approval. IP, figures and interpretation of results. JH, sample selection and sample collection. MA, histopathological workup. RS, Statistical analysis. TRH, final approval. AS, final approval. MK, final approval and interpretation of results. JS, database management and quantitative real time PCR. ASM, Final approval and interpretation of results. All authors have read and approved the final manuscript.
Pre-publication history
The pre-publication history for this paper can be accessed here:
Contributor Information
Christoph-A von Klot, Email: klot.christoph@mhh-hannover.de.
Mario W Kramer, Email: kramer.mario@mh-hannover.de.
Inga Peters, Email: peters.inga@mh-hannover.de.
Joerg Hennenlotter, Email: joerg.hennenlotter@med.uni-tuebingen.de.
Mahmoud Abbas, Email: Abbas.Mahmoud@mh-hannover.de.
Ralph Scherer, Email: Scherer.Ralph@mh-hannover.de.
Thomas RW Herrmann, Email: Herrmann.Thomas@mh-hannover.de.
Arnulf Stenzl, Email: arnulf.stenzl@med.uni-tuebingen.de.
Markus A Kuczyk, Email: kuczyk.markus@mh-hannover.de.
Juergen Serth, Email: Serth.juergen@mh-hannover.de.
Axel S Merseburger, Email: Merseburger.Axel@mh-hannover.de.
References
- Lindblad P. Epidemiology of renal cell carcinoma. Scand J Surg. 2004;93(2):88–96. doi: 10.1177/145749690409300202. [DOI] [PubMed] [Google Scholar]
- Altekruse SF, Huang L, Cucinelli JE, McNeel TS, Wells KM, Oliver MN. Spatial patterns of localized-stage prostate cancer incidence among white and black men in the southeastern United States, 1999-2001. Cancer Epidemiol Biomarkers Prev. 2010;19(6):1460–1467. doi: 10.1158/1055-9965.EPI-09-1310. [DOI] [PMC free article] [PubMed] [Google Scholar]
- Dhote R, Thiounn N, Debré B, Vidal-Trecan G. Risk factors for adult renal cell carcinoma. Urol Clin North Am. 2004;31(2):237–247. doi: 10.1016/j.ucl.2004.01.004. [DOI] [PubMed] [Google Scholar]
- Katz DL, Zheng T, Holford TR, Flannery J. Time trends in the incidence of renal carcinoma: analysis of Connecticut Tumor Registry data, 1935-1989. Int J Cancer. 1994;58(1):57–63. doi: 10.1002/ijc.2910580111. [DOI] [PubMed] [Google Scholar]
- Mejean A, Oudard S, Thiounn N. Prognostic factors of renal cell carcinoma. J Urol. 2003;169(3):821–827. doi: 10.1097/01.ju.0000051378.14270.2a. [DOI] [PubMed] [Google Scholar]
- Kwak C, Park YH, Jeong CW, Lee SE, Ku JH. Metastasectomy without systemic therapy in metastatic renal cell carcinoma: comparison with conservative treatment. Urol Int. 2007;79(2):145–151. doi: 10.1159/000106329. [DOI] [PubMed] [Google Scholar]
- Leffler H. Galectins structure and function–a synopsis. Results Probl Cell Differ. 2001;33:57–83. doi: 10.1007/978-3-540-46410-5_4. [DOI] [PubMed] [Google Scholar]
- Hughes RC. Galectins as modulators of cell adhesion. Biochimie. 2001;83(7):667–676. doi: 10.1016/S0300-9084(01)01289-5. [DOI] [PubMed] [Google Scholar]
- Kasper M. Hughes RC:Immunocytochemical evidence for a modulation of galectin 3 (Mac-2), a carbohydrate binding protein, in pulmonary fibrosis. J Pathol. 1996;179(3):309–316. doi: 10.1002/(SICI)1096-9896(199607)179:3<309::AID-PATH572>3.0.CO;2-D. [DOI] [PubMed] [Google Scholar]
- Barondes SH, Castronovo V, Cooper DN, Cummings RD, Drickamer K, Feizi T, Gitt MA, Hirabayashi J, Hughes C, Kasai K. Galectins: a family of animal beta-galactoside-binding lectins. Cell. 1994;76(4):597–598. doi: 10.1016/0092-8674(94)90498-7. [DOI] [PubMed] [Google Scholar]
- Merseburger AS, Kramer MW, Hennenlotter J, Simon P, Knapp J, Hartmann JT. Involvement of decreased Galectin-3 expression in the pathogenesis and progression of prostate cancer. Prostate. 2008;68(1):72–77. doi: 10.1002/pros.20688. [DOI] [PubMed] [Google Scholar]
- Kramer MW, Kuczyk MA, Hennenlotter J, Serth J, Schilling D, Stenzl A, Merseburger AS. Decreased expression of galectin-3 predicts tumour recurrence in pTa bladder cancer. Oncol Rep. 2008;20(6):1403–1408. [PubMed] [Google Scholar]
- Saussez S, Lorfevre F, Lequeux T, Laurent G, Chantrain G, Vertongen F, Toubeau G, Decaestecker C, Kiss R. The determination of the levels of circulating galectin-1 and -3 in HNSCC patients could be used to monitor tumor progression and/or responses to therapy. Oral Oncol. 2008;44(1):86–93. doi: 10.1016/j.oraloncology.2006.12.014. [DOI] [PubMed] [Google Scholar]
- Saussez S, Glinoer D, Chantrain G, Pattou F, Carnaille B, André S, Gabius H-J, Laurent G. Serum galectin-1 and galectin-3 levels in benign and malignant nodular thyroid disease. Thyroid. 2008;18(7):705–712. doi: 10.1089/thy.2007.0361. [DOI] [PubMed] [Google Scholar]
- Kaneko N, Gotoh A, Okamura N, Matsuo E-I, Terao S, Watanabe M, Yamada Y, Hamami G, Nakamura T, Ikekita M, Okumura K, Nishimura O. Potential tumor markers of renal cell carcinoma: Alpha-Enolase for postoperative follow up, and galectin-1 and galectin-3 for primary detection. Int J Urol. 2012;20(5):530–535. doi: 10.1111/j.1442-2042.2012.03206.x. [DOI] [PubMed] [Google Scholar]
- Sobin LH, Compton CC. TNM seventh edition: what’s new, what’s changed: communication from the International Union Against Cancer and the American Joint Committee on Cancer. Cancer. 2010;116(22):5336–5339. doi: 10.1002/cncr.25537. [DOI] [PubMed] [Google Scholar]
- Fuhrman SA, Lasky LC, Limas C. Prognostic significance of morphologic parameters in renal cell carcinoma. Am J Surg Pathol. 1982;6(7):655–663. doi: 10.1097/00000478-198210000-00007. [DOI] [PubMed] [Google Scholar]
- Stenzl A, deKernion JB. Pathology, biology, and clinical staging of renal cell carcinoma. Semin Oncol. 1989;16(1 Suppl 1):3–11. [PubMed] [Google Scholar]
- Livak KJ, Schmittgen TD. Analysis of relative gene expression data using real-time quantitative PCR and the 2(-Delta Delta C(T)) Method. Methods. 2001;25(4):402–408. doi: 10.1006/meth.2001.1262. [DOI] [PubMed] [Google Scholar]
- R Core Team. R: A Language and Environment for Statistical Computing. Vienna: R Foundation for Statistical Computing; 2013. [ http://www.R-project.org/] [Google Scholar]
- Spano D, Russo R, Di Maso V, Rosso N, Terracciano LM, Roncalli M, Tornillo L, Capasso M, Tiribelli C, Iolascon A. Galectin-1 and its involvement in hepatocellular carcinoma aggressiveness. Mol Med. 2010;16(3-4):102–115. doi: 10.2119/molmed.2009.00119. [DOI] [PMC free article] [PubMed] [Google Scholar]
- Buttery R, Monaghan H, Salter DM, Sethi T. Galectin-3: differential expression between small-cell and non-small-cell lung cancer. Histopathology. 2004;44(4):339–344. doi: 10.1111/j.1365-2559.2004.01815.x. [DOI] [PubMed] [Google Scholar]
- Baldus SE, Zirbes TK, Weingarten M, Fromm S, Glossmann J, Hanisch FG, Mönig SP, Schröder W, Flucke U, Thiele J, Hölscher AH, Dienes HP. Increased galectin-3 expression in gastric cancer: correlations with histopathological subtypes, galactosylated antigens and tumor cell proliferation. Tumour Biol. 2000;21(5):258–266. doi: 10.1159/000030131. [DOI] [PubMed] [Google Scholar]
- Arfaoui-Toumi A, Kria-Ben Mahmoud L, Ben Hmida M, Khalfallah MT, Regaya-Mzabi S, Bouraoui S. Implication of the Galectin-3 in colorectal cancer development (about 325 Tunisian patients) Bull Cancer. 2010;97(2):E1–E8. doi: 10.1684/bdc.2010.1032. [DOI] [PubMed] [Google Scholar]
- Young AN, Amin MB, Moreno CS, Lim SD, Cohen C, Petros JA, Marshall FF, Neish AS. Expression profiling of renal epithelial neoplasms: a method for tumor classification and discovery of diagnostic molecular markers. Am J Pathol. 2001;158(5):1639–1651. doi: 10.1016/S0002-9440(10)64120-X. [DOI] [PMC free article] [PubMed] [Google Scholar]
- François C, van Velthoven R, De Lathouwer O, Moreno C, Peltier A, Kaltner H, Salmon I, Gabius HJ, Danguy A, Decaestecker C, Kiss R. Galectin-1 and galectin-3 binding pattern expression in renal cell carcinomas. Am J Clin Pathol. 1999;112(2):194–203. doi: 10.1093/ajcp/112.2.194. [DOI] [PubMed] [Google Scholar]
- Kim H, Lee J, Hyun JW, Park JW, Joo HG, Shin T. Expression and immunohistochemical localization of galectin-3 in various mouse tissues. Cell Biol Int. 2007;31(7):655–662. doi: 10.1016/j.cellbi.2006.11.036. [DOI] [PubMed] [Google Scholar]
- Merseburger AS, Kramer MW, Hennenlotter J, Serth J, Kruck S, Gracia A, Stenzl A, Kuczyk MA. Loss of galectin-3 expression correlates with clear cell renal carcinoma progression and reduced survival. World J Urol. 2008;26(6):637–642. doi: 10.1007/s00345-008-0294-8. [DOI] [PubMed] [Google Scholar]
- Sakaki M, Fukumori T, Fukawa T, Elsamman E, Shiirevnyamba A, Nakatsuji H, Kanayama H-O. Clinical significance of Galectin-3 in clear cell renal cell carcinoma. J Med Invest. 2010;57(1-2):152–157. doi: 10.2152/jmi.57.152. [DOI] [PubMed] [Google Scholar]
- Zhang D, Chen Z-G, Liu S-H, Dong Z-Q, Dalin M, Bao S-S, Hu Y-W, Wei F-C. Galectin-3 gene silencing inhibits migration and invasion of human tongue cancer cells in vitro via downregulating beta-catenin. Acta Pharmacol Sin. 2013;34(1):176–184. doi: 10.1038/aps.2012.150. [DOI] [PMC free article] [PubMed] [Google Scholar]
- Song S, Mazurek N, Liu C, Sun Y, Ding QQ, Liu K, Hung M-C, Bresalier RS. Galectin-3 mediates nuclear beta-catenin accumulation and Wnt signaling in human colon cancer cells by regulation of glycogen synthase kinase-3beta activity. Cancer Res. 2009;69(4):1343–1349. doi: 10.1158/0008-5472.CAN-08-4153. [DOI] [PMC free article] [PubMed] [Google Scholar]
- Fukumori T, Takenaka Y, Yoshii T, Kim H-RC, Hogan V, Inohara H, Kagawa S, Raz A. CD29 and CD7 mediate galectin-3-induced type II T-cell apoptosis. Cancer Res. 2003;63(23):8302–8311. [PubMed] [Google Scholar]
- Hsu DK, Chen HY, Liu FT. Galectin-3 regulates T-cell functions. Immunol Rev. 2009;230(1):114–127. doi: 10.1111/j.1600-065X.2009.00798.x. [DOI] [PubMed] [Google Scholar]
- Peng W, Wang HY, Miyahara Y, Peng G, Wang RF. Tumor-associated galectin-3 modulates the function of tumor-reactive T cells. Cancer Res. 2008;68(17):7228–7236. doi: 10.1158/0008-5472.CAN-08-1245. [DOI] [PMC free article] [PubMed] [Google Scholar]
- Zuñiga E, Rabinovich GA, Iglesias MM, Gruppi A. Regulated expression of galectin-1 during B-cell activation and implications for T-cell apoptosis. J Leukoc Biol. 2001;70(1):73–79. [PubMed] [Google Scholar]
- Fuertes MB, Molinero LL, Toscano MA, Ilarregui JM, Rubinstein N, Fainboim L, Zwirner NW, Rabinovich GA. Regulated expression of galectin-1 during T-cell activation involves Lck and Fyn kinases and signaling through MEK1/ERK, p38 MAP kinase and p70S6 kinase. Mol Cell Biochem. 2004;267(1–2):177–185. doi: 10.1023/b:mcbi.0000049376.50242.7f. [DOI] [PubMed] [Google Scholar]
- Masui O, White NMA, DeSouza LV, Krakovska O, Matta A, Metias S, Khalil B, Romaschin AD, Honey RJ, Stewart R, Pace K, Bjarnason GA, Siu KWM, Yousef GM. Quantitative proteomic analysis in metastatic renal cell carcinoma reveals a unique set of proteins with potential prognostic significance. Mol Cell Proteomics. 2013;12(1):132–144. doi: 10.1074/mcp.M112.020701. [DOI] [PMC free article] [PubMed] [Google Scholar]
- Straube T, Elli AF, Greb C, Hegele A, Elsässer H-P, Delacour D, Jacob R. Changes in the expression and subcellular distribution of galectin-3 in clear cell renal cell carcinoma. J Exp Clin Cancer Res. 2011;30:89. doi: 10.1186/1756-9966-30-89. [DOI] [PMC free article] [PubMed] [Google Scholar]


