

Abstract
The hypothesis of the “liquid biopsy” using circulating tumor cells (CTCs) emerged as a minimally invasive alternative to traditional tissue biopsy to determine cancer therapy. Discordance for biomarkers expression between primary tumor tissue and circulating tumor cells (CTCs) has been widely reported, thus rendering the biological characterization of CTCs an attractive tool for biomarkers assessment and treatment selection. Studies performed in metastatic colorectal cancer (mCRC) patients using CellSearch, the only FDA-cleared test for CTCs assessment, demonstrated a much lower yield of CTCs in this tumor type compared with breast and prostate cancer, both at baseline and during the course of treatment. Thus, although attractive, the possibility to use CTCs as therapy-related biomarker for colorectal cancer patients is still limited by a number of technical issues mainly due to the low sensitivity of the CellSearch method. In the present study we found a significant discordance between CellSearch and AdnaTest in the detection of CTCs from mCRC patients. We then investigated KRAS pathway activating mutations in CTCs and determined the degree of heterogeneity for KRAS oncogenic mutations between CTCs and tumor tissues. Whether KRAS gene amplification may represent an alternative pathway responsible for KRAS activation was further explored. KRAS gene amplification emerged as a functionally equivalent and mutually exclusive mechanism of KRAS pathway activation in CTCs, possibly related to transcriptional activation. The serial assessment of CTCs may represent an early biomarker of treatment response, able to overcome the intrinsic limit of current molecular biomarkers represented by intratumor heterogeneity.
Keywords: circulating tumor cells, colorectal cancer, KRAS, tumor heterogeneity, biomarker
Introduction
Molecular targeted therapies hold the promise of a personalized cancer treatment based on the knowledge of single patient’s tumor profile. As a consequence of the improved understanding of molecular biology of cancer, significant steps have been made toward the individualization of treatment for patients with advanced colorectal cancer in the past few years. Despite the introduction of an increasing number of molecular agents into clinical practice, the improvement in survival for metastatic colorectal cancer (mCRC) patients is modest, with a median survival still not exceeding 24 mo. Research has demonstrated that the identification of predictive biomarkers is crucial in the selection of patients who might most likely benefit from targeted agents. Inhibitors of the vascular endothelial growth factor (VEGF) and the epidermal growth factor receptor (EGFR) are both key approaches in the treatment of mCRC patients, improving the efficacy of chemotherapy alone.1 While none of the proposed biomarkers is currently validated for predicting the response to anti-angiogenic treatment, KRAS mutational status has been established as a major biomarker of resistance to anti-EGFR monoclonal antibodies and KRAS testing is required before starting the treatment with these compounds.2 Point mutations in the KRAS gene are causally associated with both primary and acquired resistance to anti-EGFR drugs in metastatic colorectal cancer.3,4 Nevertheless, a large proportion of patients with KRAS wild-type (wt-KRAS) tumors are still not responsive to the treatment. Additional oncogenic activations of downstream genes of EGFR signaling pathway, such as the RAS-RAF-MAPK and PI3K-PTEN-AKT pathways, are emerging as promising biomarkers, although they have not been yet validated for routine clinical use.5,6 The complexity of the molecular alterations driving resistance to EGFR-targeted treatments is further enhanced by recent evidence on spatial heterogeneity in KRAS mutations between primary tumor samples, which in turn raises the question on whether or not appropriate sampling protocols are currently in place to enable detection of low frequency KRAS mutations. Although not conclusive, data have been reported on a temporal heterogeneity of activating KRAS mutations, due to positive or negative selective pressure on KRAS mutant tumor cells over the course of the disease.7,8 Heterogeneity in the expression of predictive biomarkers creates challenges in the diagnostic accuracy and, consequently, in the therapeutic decision making process for cancer patients. The availability of minimally invasive approaches to monitor the dynamic evolution of cancer represents a significant step toward the individualization of therapeutic approaches, to improve treatment outcomes. In this context, and taking into consideration the frequent genetic discordance between primary tumors and corresponding metastases, the hypothesis of the “liquid biopsy” using CTCs emerged as a minimally invasive alternative to traditional tissue biopsy in determining cancer therapy.9 To date, the CellSearch system is the only FDA-cleared test for CTCs assessment with prognostic purpose in metastatic breast, prostate, and colorectal cancer.10
In metastatic colorectal cancer, the CellSearch system received US FDA clearance for routine clinical use with a threshold CTC count ≥3/7.5 mL of blood, to stratify patients into favorable and unfavorable prognostic groups.11-14 Nevertheless, the studies performed in colorectal cancer patients using CellSearch demonstrated a much lower yield of CTCs in this tumor type compared with breast and prostate cancer, both at baseline and in course of treatment.15 The PCR-based assay developed by AdnaGen makes use of RT-PCR to identify putative transcripts of genes in EpCAM-positive cells isolated by a magnetic separation method. The immunomagnetic cell capture technology, combined with multiplex RT-PCR in AdnaTest may potentially allow the detection of a broad range of molecular abnormalities in CTCs supporting the design of future studies testing CTCs directed therapies.
Aims of the present study were: (1) to compare CellSearch and AdnaTest in their ability to detect CTCs in mCRC patients; (2) to investigate whether the KRAS pathway activating mutations can be identified in CTCs and to determine the degree of heterogeneity for KRAS oncogenic mutations between CTCs and tumor tissue; and (3) to explore the correlation between KRAS gene point mutations and KRAS gene amplification as alternative alterations responsible for KRAS pathway activation.
Results
CTCs detection rate: comparison between CellSearch and AdnaTest
Forty-one (41) consecutive patients were initially recruited, with 2 later excluded for inadequate samples. In each patient CTCs were isolated with both CellSearch system and AdnaTest.
CTCs were found in 8/39 patients (20.5%) using CellSearch system. The rate of patients found positive for CTCs presence with AdnaTest was 81% with a positive expression rate of 81% for EGFR, 48% for CEA and 19% for EpCAM respectively (Fig. 1). Statistical analysis found no correlation between the two isolation methods (Chi square test P = 0.306; Mann–Whitney and Spearman tests P = 0.659 and 0.678, respectively) (Table 1). No significant correlation was found between CTCs presence and clinico-pathological characteristics of patients.
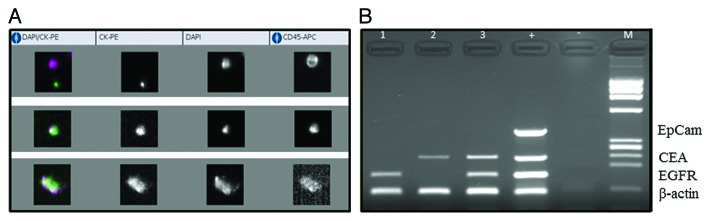
Figure 1. CellSearch analysis (A) and multiplex PCR performed after isolation of CTCs with AdnaTest (B) in three exemplificative patients with metastatic colorectal cancer. The figure shows that the absence of CTC at the CellSearch analysis is consistent with lack of EpCAM expression, as visualized at the AdnaTest analysis. Conversely, the approach with the multiplex PCR allows the identification of CTC underestimated by CellSearch, through the positive expression of EGFR and CEA.
Table 1. Detection rate of CTC in metastatic colorectal cancer: comparison between CellSearch and Adnatest.
| CTC AdnaTest | Total | ||
|---|---|---|---|
| Negative | Positive | ||
| CTC Veridex 0 count | 5 | 26 | 31 |
| % within CTC Veridex | 16.1% | 83.9% | 100.0% |
| % within CTC AdnaTest | 71.4% | 81.2% | 79.5% |
| % of total | 12.8% | 66.7% | 79.5% |
| CTC Veridex 1 count | 1 | 2 | 3 |
| % within CTC Veridex | 33.3% | 66.7% | 100.0% |
| % within CTC AdnaTest | 14.3% | 6.2% | 7.7% |
| % of total | 2.6% | 5.1% | 7.7% |
| CTC Veridex 2 count | 1 | 0 | 1 |
| % within CTC Veridex | 100.0% | 0.0% | 100.0% |
| % within CTC AdnaTest | 14.3% | 0.0% | 2.6% |
| % of total | 2.6% | 0.0% | 2.6% |
| CTC Veridex 3 count | 0 | 1 | 1 |
| % within CTC Veridex | 0.0% | 100.0% | 100.0% |
| % within CTC AdnaTest | 0.0% | 3.1% | 2.6% |
| % of total | 0.0% | 2.6% | 2.6% |
| CTC Veridex 5 count | 0 | 2 | 2 |
| % within CTC Veridex | 0.0% | 100.0% | 100.0% |
| % within CTC AdnaTest | 0.0% | 6.2% | 5.1% |
| % of total | 0.0% | 5.1% | 5.1% |
| CTC Veridex 11 count | 0 | 1 | 1 |
| % within CTC Veridex | 0.0% | 100.0% | 100.0% |
| % within CTC AdnaTest | 0.0% | 3.1% | 2.6% |
| % of total | 0.0% | 2.6% | 2.6% |
| Total count | 7 | 32 | 39 |
| % within CTC Veridex | 17.9% | 82.1% | 100.0% |
| % within CTC AdnaTest | 100.0% | 100.0% | 100.0% |
| % of total | 17.9% | 82.1% | 100.0% |
Correlation between KRAS mutational status in tissue samples and CTCs
The further molecular analysis of CTCs referred to KRAS mutational status, KRAS overexpression, and EGFR expression was then performed in CTCs isolated through AdnaTest.
KRAS gene mutational status in CRC tissue was available for 24 out of 32 CTCs positive samples; in this group of patients KRAS sequence analysis was performed in CTCs as well. KRAS codon 12 mutation was detected in 7 of the 24 tumor tissue samples analyzed (29%), whereas in 5/24 cases (21%) CTCs harboring the same mutation were identified. The correlation between KRAS mutation in tumor tissue and CTCs was found not statistically significant (P = 0.580 and 0.672 at Chi square and Fisher exact test, respectively) (Table 2).
Table 2. Correlation between KRAS mutational status in tumor tissues and CTC.
| KRAS CTC wild-type mutated | Total | ||
|---|---|---|---|
| KRAS tissue wild-type count | 13 | 4 | 17 |
| % within KRAS tissue | 76.5% | 23.5% | 100.0% |
| % within KRAS tissue | 54.2% | 66.7% | 56.7% |
| % of total | 43.3% | 13.3% | 56.7% |
| Mutated count | 11 | 2 | 13 |
| % within KRAS tissue | 84.6% | 15.4% | 100% |
| % within KRAS tissue | 45.8% | 33.3% | 43.3% |
| % of total | 36.7% | 6.7% | 43.3% |
| Total count | 24 | 6 | 30 |
| % within KRAS tissue | 80.0% | 20.0% | 100.0% |
| % within KRAS tissue | 100.0% | 100.0% | 100.0% |
| % of total | 80.0% | 20.0% | 100.0% |
Correlation between KRAS overexpression and KRAS mutation in CTCs
In the same series of patients, KRAS overexpression in CTCs was detected in 8/24 cases (33%). None of these eight samples displayed a concomitant KRAS activating mutation in CTCs or in tumor tissue, suggesting that the pathway activation by mutation or gene overexpression might be functionally equivalent and thus mutually exclusive. Of note, when tissue KRAS codon 12 mutations and KRAS gene point mutations or overexpression in CTCs were all combined, KRAS activating genetic alterations were globally found in 20/24 patients with a prevalence of 83%, confirming the key role of KRAS pathway in the biology of CRC. No statistically significant correlation was found between KRAS mutation and KRAS overexpression in CTCs (P = 0.075 and 0.104 at Chi square and Fisher exact test, respectively) (Table 3).
Table 3. Correlation between KRAS overexpression and KRAS mutation in CTC.
| KRAS overexpression CTC | Total | ||||
|---|---|---|---|---|---|
| Negative | Positive | ||||
| KRAS overexpression CTC | Negative | Count | 12 | 6 | 18 |
| % within KRAS overexpression CTC | 66.7% | 33.3% | 100.0% | ||
| % within K-RAS CTC | 48.0% | 85.7% | 56.2% | ||
| % of total | 37.5% | 18.8% | 56.2% | ||
| Positive | Count | 13 | 1 | 14 | |
| % within KRAS overexpression CTC | 92.9% | 7.1% | 100.0% | ||
| % within KRAS CTC | 52.0% | 14.3% | 43.8% | ||
| % of total | 40.6% | 3.1% | 43.8% | ||
| Total | Count | 25 | 7 | 32 | |
| % within KRAS overexpression CTC | 78.1% | 21.9% | 100.0% | ||
| % within KRAS CTC | 100.0% | 100.0% | 100.0% | ||
| % of total | 78.1% | 21.9% | 100.0% | ||
Correlation between KRAS mutation/overexpression and EGFR expression in CTCs
No correlation was found between KRAS mutation and EGFR expression in CTCs (P = 0.459 and 0.646 at Chi square and Fisher exact test, respectively), as well as between KRAS overexpression and EGFR (P = 0.217 and 0.252 at Chi square and Fisher exact test, respectively) (Table 4).
Table 4. Correlation between KRAS mutation/KRAS overexpression and EGFR expression in CTC.
| KRAS CTC | Total | ||||
|---|---|---|---|---|---|
| Wild type | Mutated | ||||
| EGFR CTC | Negative | Count | 7 | 1 | 8 |
| % within EGFR CTC | 87.5% | 12.5% | 100.0% | ||
| % within KRAS CTC | 28.0% | 14.3% | 25.0% | ||
| % of total | 21.9% | 3.1% | 25.0% | ||
| Positive | Count | 18 | 6 | 24 | |
| % within EGFR CTC | 75.0% | 25.0% | 100.0% | ||
| % within KRAS CTC | 72.0% | 85.7% | 75.0% | ||
| % of total | 56.2% | 18.8% | 75.0% | ||
| Total | Count | 25 | 7 | 32 | |
| % within EGFR CTC | 78.1% | 21.9% | 100.0% | ||
| % within KRAS CTC | 100.0% | 100.0% | 100.0% | ||
| % of total | 78.1% | 21.9% | 100.0% | ||
| K-RAS CTC | Total | ||||
| Negative | Positive | ||||
| EGFR CTC | Negative | Count | 3 | 5 | 8 |
| % within EGFR CTC | 37.5% | 62.5% | 100.0% | ||
| % within KRAS overexpression CTC | 16.7% | 35.7% | 25.0% | ||
| % of total | 9.4% | 15.6% | 25.0% | ||
| Positive | Count | 15 | 9 | 24 | |
| % within EGFR CTC | 62.5% | 37.5% | 100.0% | ||
| % within KRAS overexpression CTC | 83.3% | 64.3% | 75.0% | ||
| % of total | 46.9% | 28.1% | 75.0% | ||
| Total | Count | 18 | 14 | 32 | |
| % within EGFR CTC | 56.2% | 43.8% | 100.0% | ||
| % within KRAS overexpression CTC | 100.0% | 100.0% | 100.0% | ||
| % of total | 56.2% | 43.8% | 100.0% | ||
Correlation between KRAS mutation in tissue samples and KRAS overexpression in CTCs
The correlation between KRAS mutation in tissues and KRAS overexpression in CTCs was found not statistically significant (P = 0.368 and 0.508 at Chi square and Fisher exact test, respectively) (Table 5).
Table 5. Correlation between KRAS mutation in tissue samples and KRAS overexpression in CTC.
| KRAS overexpression CTC | Total | ||||
|---|---|---|---|---|---|
| Negative | Positive | ||||
| K-RAS tissue | Wild type | Count | 10 | 10 | 20 |
| % within KRAS tissue | 50.0% | 50.0% | 100.0% | ||
| % within KRAS overexpression CTC | 47.6% | 62.5% | 54.1% | ||
| % of total | 27.0% | 27.0% | 25.0% | ||
| Mutated | Count | 11 | 6 | 17 | |
| % within KRAS tissue | 64.7% | 35.3% | 100.0% | ||
| % within KRAS overexpression CTC | 52.4% | 37.5% | 45.9% | ||
| % of total | 29.7% | 16.2% | 45.9% | ||
| Total | Count | 21 | 6 | 37 | |
| % within KRAS tissue | 56.8% | 43.2% | 100.0% | ||
| % within KRAS overexpression CTC | 100.0% | 100.0% | 100.0% | ||
| % of total | 56.8% | 43.2% | 100.0% | ||
Discussion
The EGFR signaling pathway has been broadly characterized over the last few years and currently represents a therapeutically relevant target in metastatic colorectal cancer. Anti-EGFR monoclonal antibodies have demonstrated clinical benefit in metastatic colorectal cancer patients. Molecular alterations leading to a constitutive activation of the EGFR signal transduction have been associated with resistance to anti-EGFR targeted therapies. Among these, KRAS point mutations, which occur in approximately 40% of mCRC patients, are a well-established negative predictive biomarker for resistance to cetuximab and panitumumab.16,17 Particularly, KRAS codon 12 and 13 mutations are routinely tested to select patients candidate for anti-EGFR targeted therapy. Despite robust clinical data that have demonstrated the negative predictive value of KRAS mutations, a heterogeneous response rate has been observed in patients with KRAS wild-type CRC. Activating mutations in EGFR downstream effectors have been demonstrated as additional determinants of response to anti-EGFR monoclonal antibodies.6,18 Furthermore, KRAS gene amplification, despite being an infrequent event, accounting for only 2% of primary CRC, has been recently proposed as an alternative regulator of KRAS activation and associated with reduced progression free survival in mCRC patients treated with cetuximab.19,20
The success of individualized cancer treatments is furthermore limited by the significant variability of biomarkers expression within primary and metastatic tumors. Increasing evidence for regional and temporal heterogeneity of cancer is indeed emerging and clinical implications of the branched evolutionary tumor model are becoming evident.21,22 To overcome the intrinsic limits of a personalized approach to cancer treatment based on the assessment of biomarkers in the primary tumor at the time of diagnosis, minimally invasive and repeatable methods have been developed to monitor the dynamic evolution of the disease over the course of tumor progression. Circulating tumor cells have a recognized prognostic and predictive value in metastatic colorectal cancer patients and are gathering increasing interest as an easily accessible source of biological information. A real-time biomarkers detection through the molecular analysis of CTCs might allow a dynamic selection of patients and guide the individual therapeutic decision making process. Although attractive, the possibility to use CTCs as therapy-related biomarkers for cancer patients is still limited by a number of technical issues. Ideal markers for the identification of CTCs have not yet been identified and the need to distinguish between different cancer types is gaining growing attention. Stringent criteria by which a CTCs is defined in the CellSearch system manufacturer’s instructions may preclude the identification of subpopulations of cells in which a downregulation of epithelial markers occurred.23
In the present study, using the AdnaTest Colon Cancer, which combines immunomagnetic capture of CTCs with a multiplex expression analysis of the tumor associated mRNA markers EpCAM, CEA and EGFR, CTCs were found in 81% of mCRC patients evaluated. Compared with the lower detection rate of CTCs found using CellSearch in our cohort of patients (21%), the higher proportion of CTC-positive patients seems not surprising and might be attributed to the panel of markers included in the AdnaTest Colon Cancer. The higher expression rate of EGFR in CTCs positive samples, as well as the low EpCAM expression rate, seems to indicate that EGFR is the most accurate marker for the detection of CTCs in metastatic colorectal cancer patients, as demonstrated by the significantly lower detection rate of CTCs in the same cohort of patients with the CellSearch system. Hepatic filtration via the portal circulation has been suggested to explain the relatively low number of CTCs found in patients with metastatic colorectal cancer, compared with patients with other cancer types. As a possible explanation for the downregulation of epithelial markers expression in CTCs from mCRC patients, an activation of the epithelial to mesenchymal transition (EMT) program could be advocated.24 In parallel, the KRAS pathway activation due to gene point mutations, or alternatively to gene overexpression, might be implicated in the induction and maintenance of the EMT program in circulating tumor cells, as suggested by a number of preclinical models.25,26 International guidelines recommend to test KRAS mutations on primary colorectal tumors and/or corresponding metastases, as literature has shown that the KRAS mutations are similar in both specimen types.27 Few studies have explored in small series of mCRC patients the correlation between KRAS mutational status in primary or metastatic tumor and in CTCs, revealing further mutational discordance, possibly complicating the selection of patients candidate for anti-EGFR treatments.28-33 Our results confirm a divergent KRAS status in a large proportion of cases, highlighting that KRAS wild-type CTCs are frequently detected in peripheral blood of patients harboring mutated primary tumors. As potential mechanism to explain the relative prevalence of wild type KRAS CTCs,34 the generation of hypoxia in large advanced tumors or induced by treatments has been evoked. Particularly, hypoxia-induced oxidative stress may exert a negative selection against KRAS mutant cells through higher levels of ERK activation in KRAS mutant cells compared with the wild type counterpart, that cause cell growth arrest.35
Alternatively, the continuous mutagenesis in primary tumors may be proposed. Although codon 12 and 13 KRAS mutations in tumor tissue specimen are routinely tested, we decided to restrict the analysis to codon 12 mutations in CTCs, due to recent data suggesting the unclear association between codon 13 KRAS mutation and response to anti-EGFR monoclonal antibodies.36 A number of possible explanations exists for the reported discrepancy between KRAS mutational status in primary tumor and CTCs. First of all, a sampling bias must be taken into consideration causally related to intratumor heterogeneity, small mutated cell fractions and consequent underestimation of mutation frequency in the analysis of tumor specimen. Tumor heterogeneity also implicates that mixed KRAS wild-type and mutated sub-clones of cells might coexist in the same tumor and compete each other for metastatic dissemination. Finally, dynamic changes in the sub-clonal architecture of tumor due to selective pressure under treatment might increase genetic instability and lead to the emergence of biological determinants for resistance to therapies. KRAS mRNA overexpression in CTCs was in parallel investigated in the present work and emerged as a functionally equivalent and mutually exclusive mechanism of KRAS pathway activation, possibly related to transcriptional activation. The lack of data on KRAS overexpression in tissue samples may represent a major drawback of the present study. The clinical relevance of KRAS gene amplification and mRNA overexpression in predicting response to anti-EGFR targeted therapies is still largely under investigated and deserves further attention.
Although preliminary, our results show that the serial assessment of CTCs may represent an early biomarker of treatment response, providing the opportunity to assess clonal dynamics over the course of a single patient disease and overcoming the intrinsic limit of current molecular biomarkers represented by the intratumor spatial and temporal heterogeneity.
Patients and Methods
A total of 41 stage IV colorectal cancer patients were enrolled in this study. All patients were enrolled at Sapienza University—Policlinico Umberto I of Rome. Clinical characteristics of patients are summarized in Table 6. All patients provided a written informed consent and the study was approved by the institutional review board.
Table 6. Patient’s characteristics.
| Patient’s characteristics | N (%) |
|---|---|
| Age | |
| Range | 45–83 |
| Median | 63.92 |
| Gender | |
| Male | 25/40 (62.5) |
| Female | 15/40 (37.5) |
| Therapy | |
| Bevacizumab | 25/40 (65) |
| Cetuximab | 9/40 (25) |
| No therapy | 6/40 (10) |
| Line of therapy | |
| First | 20/34 (59) |
| Second | 10/34 (29) |
| Third | 4/34 (12) |
KRAS gene mutational status in tissue samples
DNA was extracted from FFPE tissue sections using a DNA minikit (Qiagen), following the manufacturer’s instructions. A 321-bp PCR fragment of the exon 2 KRAS gene, including codons 12 and 13, was amplified by the following primer pair: KRAS F: 5′-TTTGAAATAA TTTTTCATAT AAAGGTGAG-3′ and KRAS R: 5′-TCATGAAAAT GGTCAGAGAA ACC-3′. PCR conditions were as follows: initial denaturation for 5 min at 95 °C, cyclic denaturation at 94 °C for 1 min, annealing at 59 °C for 1 min, elongation at 72 °C for 1 min for 35 cycles, and final extension at 72 °C for 7 min. Following PCR the fragments were purified by Exostar 1-Step (VWR International) according to the manufacturer’s instructions. Sequencing reactions were performed for both DNA strands by the Big Dye Terminator v1.1 (Applied Biosystems) on a total of 10 ng of purified PCR products. Dye purification was performed by Centrisep Spin columns (Princeton Separation) according to the manufacturer’s instructions. Sequence analysis was performed on an Applied Biosystems 3130XL Genetic Analyzer.
Isolation of circulating tumor cells
In order to isolate CTCs from peripheral blood, CellSearch and AdnaTest ColonCancer Select/Detect were used. For AdnaTest, blood samples (5 mL) were taken using AdnaCollect blood collection tubes (AdnaGen) and immediately placed on ice, according to the manufacturer's instructions. For CellSearch analysis, 7.5 mL of blood were drawn in CellSave Vacutainer tubes (Becton Dickinson), kept at room temperature and processed within 96 h, as described.
CellSearch
The CellSearch Circulating Tumor Cell system uses a combination of immunomagnetic labeling and automated digital microscopy to identify and enumerate the number of circulating tumor cells in a peripheral blood specimen. It consists of a CellTracks AutoPrep system which isolates CTCs and a CellTracks Analyzer, which differentiates the tumor cells from nonspecific cells. The CellSearch Epithelial Cell Kit which is used for CTCs capture contains ferrofluids labeled with the epithelial cell adhesion molecule (EpCAM), the staining reagents 2-diamidino-2-phenylindole, dihydrochloride (DAPI), CD45-Allophycocyan (CD45-APC), and cytokeratin 8, 18, and 19 Phycoerythrin (CK-PE). The whole blood specimen is centrifuged and placed on the CellTracks AutoPrep system. The plasma is aspirated and the remaining cellular component is mixed with buffer and ferrofluid reagent conjugated with monoclonal epithelial cell adhesion molecule (EpCAM) antibodies. The ferrofluid/antibody complex attaches specifically to epithelial cells. Magnets then attract the ferrofluid-bound cells to the side of the tube, the remaining fluid and any unlabeled cells are aspirated and the magnets are removed. The remaining cells are then resuspended in buffer. The resulting epithelial-enriched fluid is then placed in a cell presentation device (MagNest) that attracts the magnetically labeled epithelial cells to the surface of the cartridge. The cartridge is placed on the CellTracks Analyzer, a fluorescence-based microscopy system that scans the surface of the cartridge to acquire cell images to visualize DAPI-labeled nuclei, PE-labeled CK, and APC-labeled CD45. A gallery of images is reviewed by a technologist who identifies tumor cells based on the circulating tumor cell phenotype (positive DAPI and CK staining with an absence of CD45 staining)
AdnaTest ColonCancer Select
Colon Select Beads (100 μL) were added to 5 mL of blood and incubated for 30 min at room temperature (5 rpm). After incubation, cells were repeatedly washed with PBS and lysed by adding a Lysis/Binding buffer (AdnaGen). The supernatant was recovered. The AdnaTest ColonCancer provides a specificity of >90% as well as a recovery of 2 CRC cells which has been proven by analyzing healthy donor blood samples as well as CRC cell spiking experiments respectively.37
AdnaTest Colon Cancer Detect
mRNA was subsequently recovered by a magnetic separation using Oligo(dT)25 Dynabeads. The total mRNA/bead mixture (29.5 μL) was reverse transcribed using 0.5 μL of RNase inhibitor (40 UμL−1; Promega), 4 μL of RT buffer, 4 μL of dNTPs, and 2 μL of Sensiscript Reverse Transcriptase (Qiagen). Reverse transcription was performed in a one-step reaction (60 min at 37 °C, 5 min at 93 °C). The mixture was then chilled down on ice and stored at −20 °C. The analysis of tumor-associated mRNA isolated from CTC tumor cells was performed in a multiplex polymerase chain reaction (PCR) for three tumor-associated transcripts (EGFR, CEA, and GA733-2) and one housekeeping gene (β-actin). GA 73.3 refers to the epithelial cell adhesion molecule (EpCAM). The primers generate fragments in positive samples for the GA733-2, 383 bp; CEA, 226 bp; EGFR, 161 bp; β-actin, 114 bp (internal PCR control) sizes.
For the analysis of tumor-associated mRNAs, a multiplex PCR was performed. The primer mixture consisted of four specific primer pairs for the amplification of CEA, EGFR, and GA733-2.
PCR analyses were performed in a final volume of 50 μL PCR mixture, containing 8 μL of cDNA, 4 μL primer mixture (PrimerMix Colon Detect; AdnaGen), 25 μL of Hot Star Taq Master Mix (Qiagen) and 13 μL of distilled water. PCR analyses were performed as follows: pre-denaturation at 95 °C for 15 min, followed by 38 cycles of denaturation at 94 °C for 45 s, annealing at 58 °C for 45 s, extension at 72 °C for 45 s and a final extension step at 72 °C for 10 min. Visualization of the PCR fragments was performed with a 2100 Bioanalyzer (Agilent Technologies Inc.) by using DNA 1000 LabChips and the Expert Software Package (version B.02.03.SI307). The test was considered CTCs-positive if a PCR fragment of at least one tumor-associated transcript (EGFR, GA 773-2, or CEA) and a fragment of the control gene β-actin (internal PCR control) were clearly detected. For negative controls, mRNA and cDNA were replaced by water in the reverse transcription and PCR experiments. The PCR products were then analyzed by electrophoresis on a 4% agarose gel.
KRAS gene mutational status and overexpression in circulating tumor cells
For the KRAS pre-amplification HotStarTaq Master Mix Kit (Qiagen) and self-designed Primers (MWG) for the amplification of the region between exon 2 and exon 4 was used. RT-PCR and KRAS pre-amplification was created with an Arctic Thermocycler (Thermo scientific). Pre-amplification was performed as follows: 95 °C for 15 min, followed by 39 cycles of denaturation at 94 °C for 45 s, annealing at 56 °C for 45 s, extension at 72 °C for 45 s and a final extension step at 72 °C for 10 min. Resulting PCR fragment concentrations were quantified using the Agilent Bioanalyzer 2100 (Agilent). The KRAS expression as observed in the 24 CTCs positive patient samples ranged from 0 to 5.12 ng/μL. Overexpression was defined as all values above 5% of the maximum value identified in this setting 0.255 ng/μL rounded to 0.3 ng/μL. The values excluded by choosing this cut-off ranged from 0 to 0.25 ng/μL (Fig. 2). Following the pre-amplification the detection of G12X mutations was executed with Ampli-set-K-Ras, Version 007 of 06-04-2011 (Diachem s.r.l.).
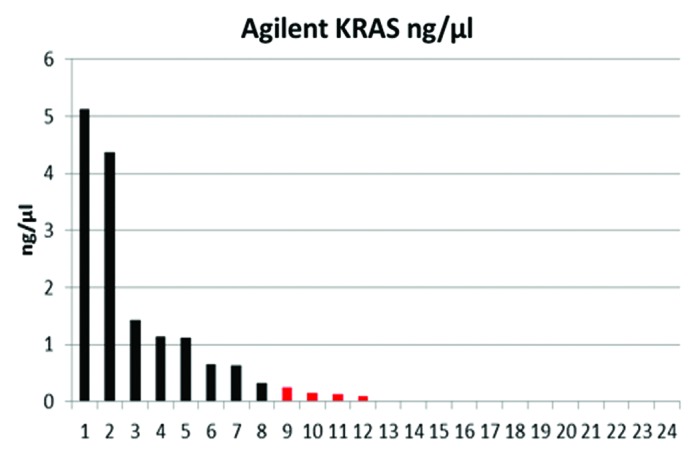
Figure 2. KRAS expression profile in a cohort of 24 CRC patients initially detected to be CTC positive based on the AdnaTest ColonCancer.
The protocol of the G12X amplification was modified. We replaced 28 μL water with template, for a total template volume of 30 μL, instead of original 2 μL template volume + 28 μL water, because of a low cDNA concentration. Amplification was performed as follows: 95 °C for 10 min, followed by 50 cycles of denaturation at 94 °C for 40 s, annealing at 52 °C for 40 s, extension at 72 °C for 30 s and a final extension step at 72 °C for 10 min.
The protocol of the enzymatic digestion with MVA I enzyme was modified. We replaced 3 μL water with template, for a total template volume of 13 μL, instead of original 10 μL template volume + 3 μL water, because of the low concentrations. The MVA I digestion was proceeded overnight and the products of digestion were visualized in 4% agarose gel.
Statistical analysis
Categorical variables were compared with the Fisher exact test. Continuous variables were compared with the Mann–Whitney U test, which does not assume an underlying normal distribution of the dependent variable and is more robust in small and potentially skewed samples than parametric tests. Statistical significance was set at the 2-tailed 0.05 level, and P values unadjusted for multiplicity are reported throughout. Computations were performed with SPSS 20 (IBM).
Disclosure of Potential Conflicts of Interest
No potential conflicts of interest were disclosed.
Glossary
Abbreviations:
- CEA
carcinoembryonic antigen
- CTC
circulating tumor cells
- EpCAM
epithelial cell adhesion molecule
- mCRC
metastatic colorectal cancer
- EGFR
epidermal growth factor receptor
- VEGF
vascular endothelial growth factor
Footnotes
Previously published online: www.landesbioscience.com/journals/cbt/article/28020
References
- 1.Prenen H, Vecchione L, Van Cutsem E. Role of targeted agents in metastatic colorectal cancer. Target Oncol. 2013;8:83–96. doi: 10.1007/s11523-013-0281-x. [DOI] [PubMed] [Google Scholar]
- 2.Newton KF, Newman W, Hill J. Review of biomarkers in colorectal cancer. Colorectal Dis. 2012;14:3–17. doi: 10.1111/j.1463-1318.2010.02439.x. [DOI] [PubMed] [Google Scholar]
- 3.Jancík S, Drábek J, Radzioch D, Hajdúch M. Clinical relevance of KRAS in human cancers. J Biomed Biotechnol. 2010;2010:150960. doi: 10.1155/2010/150960. [DOI] [PMC free article] [PubMed] [Google Scholar]
- 4.Misale S, Yaeger R, Hobor S, Scala E, Janakiraman M, Liska D, Valtorta E, Schiavo R, Buscarino M, Siravegna G, et al. Emergence of KRAS mutations and acquired resistance to anti-EGFR therapy in colorectal cancer. Nature. 2012;486:532–6. doi: 10.1038/nature11156. [DOI] [PMC free article] [PubMed] [Google Scholar]
- 5.Berg M, Soreide K. EGFR and downstream genetic alterations in KRAS/BRAF and PI3K/AKT pathways in colorectal cancer: implications for targeted therapy. Discov Med. 2012;14:207–14. [PubMed] [Google Scholar]
- 6.Yang ZY, Wu XY, Huang YF, Di MY, Zheng DY, Chen JZ, Ding H, Mao C, Tang JL. Promising biomarkers for predicting the outcomes of patients with KRAS wild-type metastatic colorectal cancer treated with anti-epidermal growth factor receptor monoclonal antibodies: a systematic review with meta-analysis. Int J Cancer. 2013;133:1914–25. doi: 10.1002/ijc.28153. [DOI] [PubMed] [Google Scholar]
- 7.Swanton C. Intratumor heterogeneity: evolution through space and time. Cancer Res. 2012;72:4875–82. doi: 10.1158/0008-5472.CAN-12-2217. [DOI] [PMC free article] [PubMed] [Google Scholar]
- 8.Fisher R, Pusztai L, Swanton C. Cancer heterogeneity: implications for targeted therapeutics. Br J Cancer. 2013;108:479–85. doi: 10.1038/bjc.2012.581. [DOI] [PMC free article] [PubMed] [Google Scholar]
- 9.Alix-Panabières C, Pantel K. Circulating tumor cells: liquid biopsy of cancer. Clin Chem. 2013;59:110–8. doi: 10.1373/clinchem.2012.194258. [DOI] [PubMed] [Google Scholar]
- 10.Miller MC, Doyle GV, Terstappen LW. Significance of Circulating Tumor Cells Detected by the CellSearch System in Patients with Metastatic Breast Colorectal and Prostate Cancer. J Oncol. 2010;2010:617421. doi: 10.1155/2010/617421. [DOI] [PMC free article] [PubMed] [Google Scholar]
- 11.Tol J, Koopman M, Miller MC, Tibbe A, Cats A, Creemers GJ, Vos AH, Nagtegaal ID, Terstappen LW, Punt CJ. Circulating tumour cells early predict progression-free and overall survival in advanced colorectal cancer patients treated with chemotherapy and targeted agents. Ann Oncol. 2010;21:1006–12. doi: 10.1093/annonc/mdp463. [DOI] [PubMed] [Google Scholar]
- 12.Sastre J, Maestro ML, Gómez-España A, Rivera F, Valladares M, Massuti B, Benavides M, Gallén M, Marcuello E, Abad A, et al. Circulating tumor cell count is a prognostic factor in metastatic colorectal cancer patients receiving first-line chemotherapy plus bevacizumab: a Spanish Cooperative Group for the Treatment of Digestive Tumors study. Oncologist. 2012;17:947–55. doi: 10.1634/theoncologist.2012-0048. [DOI] [PMC free article] [PubMed] [Google Scholar]
- 13.Cohen SJ, Punt CJ, Iannotti N, Saidman BH, Sabbath KD, Gabrail NY, Picus J, Morse MA, Mitchell E, Miller MC, et al. Prognostic significance of circulating tumor cells in patients with metastatic colorectal cancer. Ann Oncol. 2009;20:1223–9. doi: 10.1093/annonc/mdn786. [DOI] [PubMed] [Google Scholar]
- 14.Cohen SJ, Punt CJ, Iannotti N, Saidman BH, Sabbath KD, Gabrail NY, Picus J, Morse M, Mitchell E, Miller MC, et al. Relationship of circulating tumor cells to tumor response, progression-free survival, and overall survival in patients with metastatic colorectal cancer. J Clin Oncol. 2008;26:3213–21. doi: 10.1200/JCO.2007.15.8923. [DOI] [PubMed] [Google Scholar]
- 15.Bidard FC, Ferrand FR, Huguet F, Hammel P, Louvet C, Malka D, Boige V, Ducreux M, Andre T, de Gramont A, et al. Disseminated and circulating tumor cells in gastrointestinal oncology. Crit Rev Oncol Hematol. 2012;82:103–15. doi: 10.1016/j.critrevonc.2011.05.008. [DOI] [PubMed] [Google Scholar]
- 16.Normanno N, Tejpar S, Morgillo F, De Luca A, Van Cutsem E, Ciardiello F. Implications for KRAS status and EGFR-targeted therapies in metastatic CRC. Nat Rev Clin Oncol. 2009;6:519–27. doi: 10.1038/nrclinonc.2009.111. [DOI] [PubMed] [Google Scholar]
- 17.De Roock W, De Vriendt V, Normanno N, Ciardiello F, Tejpar S. KRAS, BRAF, PIK3CA, and PTEN mutations: implications for targeted therapies in metastatic colorectal cancer. Lancet Oncol. 2011;12:594–603. doi: 10.1016/S1470-2045(10)70209-6. [DOI] [PubMed] [Google Scholar]
- 18.Sartore-Bianchi A, Di Nicolantonio F, Nichelatti M, Molinari F, De Dosso S, Saletti P, Martini M, Cipani T, Marrapese G, Mazzucchelli L, et al. Multi-determinants analysis of molecular alterations for predicting clinical benefit to EGFR-targeted monoclonal antibodies in colorectal cancer. PLoS One. 2009;4:e7287. doi: 10.1371/journal.pone.0007287. [DOI] [PMC free article] [PubMed] [Google Scholar]
- 19.Mekenkamp LJ, Tol J, Dijkstra JR, de Krijger I, Vink-Börger ME, van Vliet S, Teerenstra S, Kamping E, Verwiel E, Koopman M, et al. Beyond KRAS mutation status: influence of KRAS copy number status and microRNAs on clinical outcome to cetuximab in metastatic colorectal cancer patients. BMC Cancer. 2012;12:292. doi: 10.1186/1471-2407-12-292. [DOI] [PMC free article] [PubMed] [Google Scholar]
- 20.Valtorta E, Misale S, Sartore-Bianchi A, Nagtegaal ID, Paraf F, Lauricella C, Dimartino V, Hobor S, Jacobs B, Ercolani C, et al. KRAS gene amplification in colorectal cancer and impact on response to EGFR-targeted therapy. Int J Cancer. 2013;133:1259–65. doi: 10.1002/ijc.28106. [DOI] [PubMed] [Google Scholar]
- 21.Almendro V, Marusyk A, Polyak K. Cellular heterogeneity and molecular evolution in cancer. Annu Rev Pathol. 2013;8:277–302. doi: 10.1146/annurev-pathol-020712-163923. [DOI] [PubMed] [Google Scholar]
- 22.Marusyk A, Polyak K. Cancer. Cancer cell phenotypes, in fifty shades of grey. Science. 2013;339:528–9. doi: 10.1126/science.1234415. [DOI] [PubMed] [Google Scholar]
- 23.Mego M, De Giorgi U, Dawood S, Wang X, Valero V, Andreopoulou E, Handy B, Ueno NT, Reuben JM, Cristofanilli M. Characterization of metastatic breast cancer patients with nondetecTable 3irculating tumor cells. Int J Cancer. 2011;129:417–23. doi: 10.1002/ijc.25690. [DOI] [PubMed] [Google Scholar]
- 24.Gazzaniga P, Raimondi C, Gradilone A, Di Seri M, Longo F, Cortesi E, Frati L. Circulating tumor cells, colon cancer and bevacizumab: the meaning of zero. Ann Oncol. 2011;22:1929–30. doi: 10.1093/annonc/mdr292. [DOI] [PubMed] [Google Scholar]
- 25.Miyazono K. Transforming growth factor-beta signaling in epithelial-mesenchymal transition and progression of cancer. Proc Jpn Acad Ser B Phys Biol Sci. 2009;85:314–23. doi: 10.2183/pjab.85.314. [DOI] [PMC free article] [PubMed] [Google Scholar]
- 26.Morel AP, Hinkal GW, Thomas C, Fauvet F, Courtois-Cox S, Wierinckx A, Devouassoux-Shisheboran M, Treilleux I, Tissier A, Gras B, et al. EMT inducers catalyze malignant transformation of mammary epithelial cells and drive tumorigenesis towards claudin-low tumors in transgenic mice. PLoS Genet. 2012;8:e1002723. doi: 10.1371/journal.pgen.1002723. [DOI] [PMC free article] [PubMed] [Google Scholar]
- 27.National Comprehensive Cancer Network (NCCN). NCCN Clinical Practice Guidelines in Oncology. Colon Cancer Version 2. 2013 [DOI] [PubMed]
- 28.Baldus SE, Schaefer KL, Engers R, Hartleb D, Stoecklein NH, Gabbert HE. Prevalence and heterogeneity of KRAS, BRAF, and PIK3CA mutations in primary colorectal adenocarcinomas and their corresponding metastases. Clin Cancer Res. 2010;16:790–9. doi: 10.1158/1078-0432.CCR-09-2446. [DOI] [PubMed] [Google Scholar]
- 29.Knijn N, Mekenkamp LJ, Klomp M, Vink-Börger ME, Tol J, Teerenstra S, Meijer JW, Tebar M, Riemersma S, van Krieken JH, et al. KRAS mutation analysis: a comparison between primary tumours and matched liver metastases in 305 colorectal cancer patients. Br J Cancer. 2011;104:1020–6. doi: 10.1038/bjc.2011.26. [DOI] [PMC free article] [PubMed] [Google Scholar]
- 30.Yen LC, Yeh YS, Chen CW, Wang HM, Tsai HL, Lu CY, Chang YT, Chu KS, Lin SR, Wang JY. Detection of KRAS oncogene in peripheral blood as a predictor of the response to cetuximab plus chemotherapy in patients with metastatic colorectal cancer. Clin Cancer Res. 2009;15:4508–13. doi: 10.1158/1078-0432.CCR-08-3179. [DOI] [PubMed] [Google Scholar]
- 31.Gasch C, Bauernhofer T, Pichler M, Langer-Freitag S, Reeh M, Seifert AM, Mauermann O, Izbicki JR, Pantel K, Riethdorf S. Heterogeneity of epidermal growth factor receptor status and mutations of KRAS/PIK3CA in circulating tumor cells of patients with colorectal cancer. Clin Chem. 2013;59:252–60. doi: 10.1373/clinchem.2012.188557. [DOI] [PubMed] [Google Scholar]
- 32.Mostert B, Jiang Y, Sieuwerts AM, Wang H, Bolt-de Vries J, Biermann K, Kraan J, Lalmahomed Z, van Galen A, de Weerd V, et al. KRAS and BRAF mutation status in circulating colorectal tumor cells and their correlation with primary and metastatic tumor tissue. Int J Cancer. 2013;133:130–41. doi: 10.1002/ijc.27987. [DOI] [PubMed] [Google Scholar]
- 33.Fabbri F, Carloni S, Zoli W, Ulivi P, Gallerani G, Fici P, Chiadini E, Passardi A, Frassineti GL, Ragazzini A, et al. Detection and recovery of circulating colon cancer cells using a dielectrophoresis-based device: KRAS mutation status in pure CTCs. Cancer Lett. 2013;335:225–31. doi: 10.1016/j.canlet.2013.02.015. [DOI] [PubMed] [Google Scholar]
- 34.Parsons BL, Myers MB. Personalized cancer treatment and the myth of KRAS wild-type colon tumors. Discov Med. 2013;15:259–67. [PubMed] [Google Scholar]
- 35.Zeng M, Kikuchi H, Pino MS, Chung DC. Hypoxia activates the K-ras proto-oncogene to stimulate angiogenesis and inhibit apoptosis in colon cancer cells. PLoS One. 2010;5:e10966. doi: 10.1371/journal.pone.0010966. [DOI] [PMC free article] [PubMed] [Google Scholar]
- 36.De Roock W, Jonker DJ, Di Nicolantonio F, Sartore-Bianchi A, Tu D, Siena S, Lamba S, Arena S, Frattini M, Piessevaux H, et al. Association of KRAS p.G13D mutation with outcome in patients with chemotherapy-refractory metastatic colorectal cancer treated with cetuximab. JAMA. 2010;304:1812–20. doi: 10.1001/jama.2010.1535. [DOI] [PubMed] [Google Scholar]
- 37.Lankiewicz S, Zimmermann S, Hollmann C, Hillemann T, Greten TF. Circulating tumour cells as a predictive factor for response to systemic chemotherapy in patients with advanced colorectal cancer. Mol Oncol. 2008;2:349–55. doi: 10.1016/j.molonc.2008.09.001. [DOI] [PMC free article] [PubMed] [Google Scholar]