

Abstract
We report a novel method of DNA array formation that is electrochemically formed and addressed with a two-electrode platform. Electrochemical activation of a copper catalyst, patterned with one electrode, enables precise placement of multiple sequences of DNA onto a second electrode surface. The two-electrode patterning and detection platform allows for both spatial resolution of the patterned DNA array and optimization of detection through DNA-mediated charge transport with electrocatalysis. This two-electrode platform has been used to form arrays that enable differentiation between well-matched and mismatched sequences, the detection of TATA-binding protein, and sequence-selective DNA hybridization.
Nucleic acid sensors are critical for the detection of many biological markers of disease. Although fluorescence-based hybridization arrays have proven useful for high-throughput screening applications,1,2 they have not shown utility for bench-top clinical diagnostics. Electrochemical assays based on DNA-mediated charge transport (DNA CT) are well suited for point-of-care applications; they require only simple electronic instrumentation and do not require stringent hybridization procedures to report on mutations, protein binding, as well as other π-stack perturbations.3–5
In conventional analytical platforms, electrochemical read-out occurs at the surface onto which the DNA monolayers are assembled. As a result, these assays report on bulk changes that occur over the entire electrode area. Multiplexing has enabled multiple experimental conditions to be run in parallel,7–10 yet these platforms still yield only average changes that occur over the entire surface. Comparing individual electrodes can be misleading, as small variations in monolayer composition can lead to substantial differences in electrochemical responses.
Alternatively, two-electrode detection systems can provide spatial resolution over specifically defined regions on a single electrode surface. The most widely used two-electrode technique is scanning electrochemical microscopy (SECM).11–14 This technique has been used to detect oligonucleotide hybridization events on DNA-modified surfaces.15–18 Here, we report a simplified, macroscopic SECM-like system for both addressing and analyzing DNA arrays composed of different sequences grafted onto a single surface. This platform requires no specialized equipment, only a standard bipotentiostat, microelectrode, and x,y,z-stage. Electrochemical readout is accomplished via amperometric detection at a probe electrode positioned above the substrate surface. As multiple DNA sequences are patterned onto the same surface, different sequences can be examined under identical conditions with redundancy and internal controls.
Our strategy for grafting DNA arrays is shown in Figure 1. Surfaces are prepared by vapor-depositing gold films onto glass microscope slides, forming both square substrate electrodes and a patterning electrode that features interdigitated patterning lines spaced 2-mm apart.19 Next, mixed monolayers are self-assembled onto the substrate electrodes from an ethanolic solution of 12-azidododecane-1-thiol and 11-mercaptoundecylphosphoric acid, producing a surface passivated against ferricyanide and methylene blue, electrochemical reporters of DNA CT. Duplex DNAs20 are then grafted onto the substrate electrodes by sandwiching an aqueous solution of [Cu(phendione)2][SO4] and an alkyne-labeled DNA sequence between the substrate and patterning pads separated by a thin (200 μm) Teflon spacer. Electrochemical reduction of Cu(phendione)22+ at specific working electrodes on the patterning pad yields spatially isolated DNA duplexes covalently bound to the substrate via Cu(I)-catalyzed azide/alkyne coupling (Figure 1B). Using this method, multiple DNA sequences can be grafted onto the same substrate by rinsing the surface following Cu(I) activation, then repeating the procedure with a different DNA sequence.21 While click chemistry has been used previously to prepare DNA-modified electrodes, this has not been accomplished with two-electrode electrochemical activation.22,23 The electrochemical control of the copper catalyst from a secondary electrode offers a unique route to functionalize the surface with DNA under spatial control.
Figure 1.
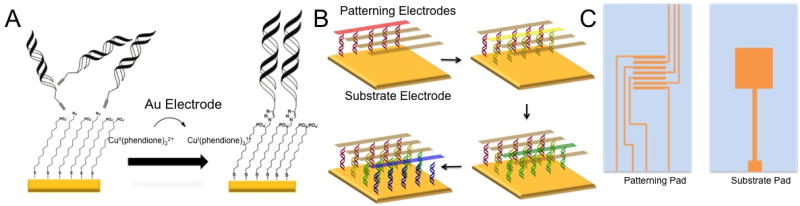
Selective activation for specific covalent attachment of DNA to particular locations. (A) An inert Cu(II) catalyst is electrochemically activated to an active Cu(I) species capable of catalyzing the [3+2] azide-alkyne cycloaddition between alkyne-modified DNA and an azide-terminated thiol monolayer. (B) Four different sequences of DNA are patterned onto a single substrate pad through sequential catalyst activations. (C) Design for patterning electrodes and substrate electrode. The patterning pad (left) contains four working electrodes that are individually addressable interspersed with three reference electrodes. The substrate pad (right) contains a single, large gold pad and a working electrode contact to the pad.
We confirmed attachment of DNA onto the mixed monolayer by recording a cyclic voltammogram (CV) at the substrate pad in the presence of 200 μM ferricyanide and 2 μM methylene blue (MB) (Figure 2). The CV displays a large, irreversible reduction at ~ −0.4 V, characteristic of DNA-mediated electrocatalytic reduction of ferricyanide by methylene blue (Figure 2C).24,25 Although this experiment confirms that DNA is present on the surface, it provides no information on either the homogeneity or the types of DNA present.
FIGURE 2.
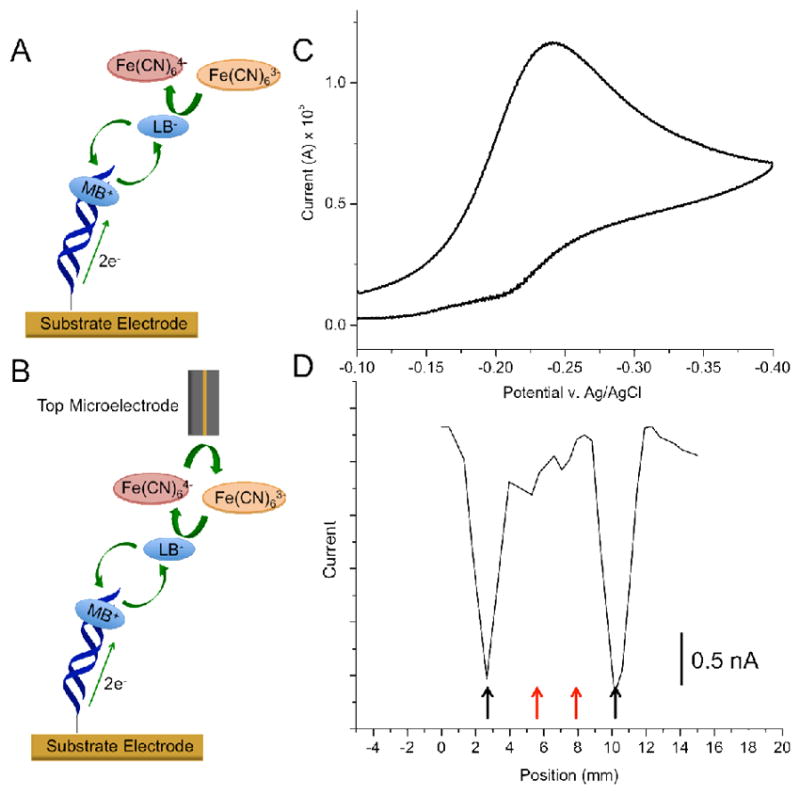
Comparison between bulk versus spatially resolved electrochemical readout. (A) Conventional detection involves measuring electrocatalytic currents at the substrate electrode: (i) intercalated methylene blue (MB) is reduced to leucomethylene blue (LB) through well-matched DNA duplexes; (ii) LB dissociates from the duplex and reduces ferri- to ferrocyanide, and (iii) the resulting MB intercalates back into the DNA duplex to restart the cycle. (B) Two-electrode electrocatalysis. The same chemistry occurs at the substrate electrode, but a probe microelectrode reduces electrochemically-produced ferrocyanide back to ferricyanide, providing amperometric readout via a secondary electrode. (C) Electrocatalytic signal recorded at a substrate pad modified with two strips of well matched and two strips of mismatched DNA (see supporting information for sequences). The bulk electrochemical signal from the substrate pad shows a classic electrocatalytic peak, indicating the presence of some well-matched DNA on the electrode surface. (D) Electrochemical response of the probe electrode as a function of its position over the same substrate surface in (C) using the two-electrode detection method. Here, the existence of two different sequences of DNA: matched (black arrows) and mismatched (red arrows) becomes apparent. The surface was scanned at ~0.6 mm/sec with a 100 μm gold microelectrode. (Analyte solutions contained 2 μM MB and 200 μM ferricyanide in 10 mM Tris buffer with 100 mM KCl, 2.5 mM MgCl2, and 1 mM CaCl2, pH 7.6.)
Indeed, the bulk response shown in Figure 2 was obtained from a surface patterned with two strips of well-matched DNA and two strips of DNA containing a single-base mismatch.
To interrogate the substrate more closely, a 100-μm gold electrode positioned above the substrate electrode using an x,y,z-stage was employed as a secondary electrode to create a detection system that enables spatial resolution in the x-y plane.26 DNA-mediated reduction of ferricyanide (via methylene blue electrocatalysis) occurs only at locations on the substrate electrode addressed with well-matched DNA. As a consequence, amperometric detection of ferrocyanide at the probe electrode signals the presence of intact DNA duplexes at proximal locations on the underlying pad. As shown in Figure 2D, only Watson-Crick paired DNA (black arrows) is detected using this method; sequences containing a mismatch (red arrows) yield no signals, owing to the attenuation of DNA CT by a disruption in the π-stack.27,28 Thus measuring ferrocyanide oxidation at the microelectrode tip as a function of position on the surface allows for spatial differentiation between the passivating layer and regions containing DNA on the substrate. The utilization of a separate top probe electrode, moreover, ensures that the current flow is DNA-mediated and amplified through electrocatalysis. Notably, this method provides reproducible current outputs for multiple strips of a single DNA sequence (Figure S1), demonstrating a high level of reproducibility; the standard deviation for peak currents of DNA of the same sequence is 95 pA, or 1.5%. It should be noted that the full width half max of the DNA peaks is ~1 mm, the width of the patterning electrodes, indicating minimal diffusive spreading of the catalyst upon activation.29
Protein binding was also tested on this platform using the eukaryotic TFIID transcription factor TBP.30 We have shown previously that TBP binding leads to attenuated CT in duplexes containing a TATA-binding sequence but does not affect duplexes lacking the binding site.31 We therefore patterned alternating strips of TBP-binding sequences and non-binding sequences on a substrate surface.32 As shown in Figure 3, in the absence of TBP, four strips of well-matched DNA are detected. When TBP is titrated in, however, a loss of electrochemical signal occurs only at the location of the TBP sequences. At 15 nM, an almost complete signal loss is observed, indicating specific and sensitive protein detection with spatial resolution on this two-electrode platform.
Figure 3.
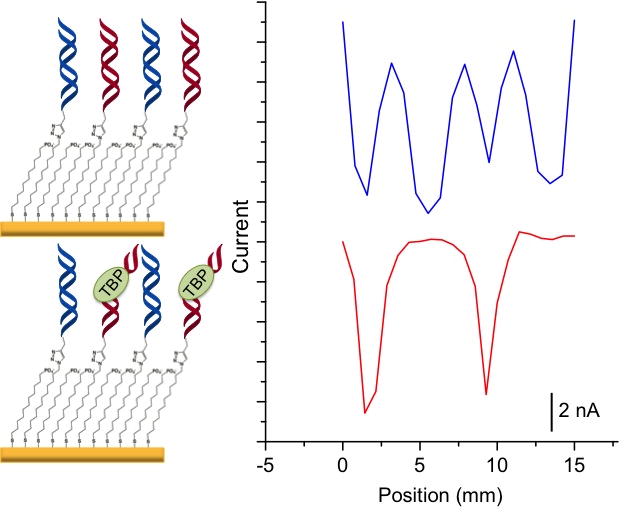
TBP detection on a patterned surface. Current increases negatively down the y-axis. The surface was patterned with four alternating strips of DNA that either lack or contain a TBP binding site. The blue trace is a scan in 2 μM methylene blue and 200 μM ferricyanide before the addition of TBP but after a 30 minute incubation in 100 μM BSA, which controls for non-specific protein binding. The red trace is after a 15-minute incubation with 15 nM TBP protein; the current corresponding to the TBP-binding sequences was diminished, while the current at locations without the protein binding site were unaffected.
This same strategy can be employed also to detect selective DNA hybridization. Alternating strips of well-matched DNA and DNA containing a CA mismatch were patterned onto the electrode surface. Imaging the substrate from the top of the monolayer yields the expected pattern of alternating high and low currents at the probe tip (Figure 4). The DNA on the electrode was then dehybridized by heating the substrate pad in 65°C buffer for fifteen minutes. A strand of DNA fully complementary to the alkynyl strand that was originally mismatched was subsequently incubated on the surface for one hour, resulting in the formerly mismatched sequences being well-matched and vice-versa.33 Rescanning the substrate electrode revealed almost complete reversal of signal locations, indicating that the majority of the DNA helices on the surface were dehybridized and rehybridized to an alternate complement. Our platform effectively differentiates between fully complementary duplexes versus those that contain single-base mismatches, making it ideally suited for assays based on hybridization. Because DNA CT-based assays rely on π-stacking interactions within fully annealed duplexes, they do not require stringent hybridization conditions.
Figure 4.
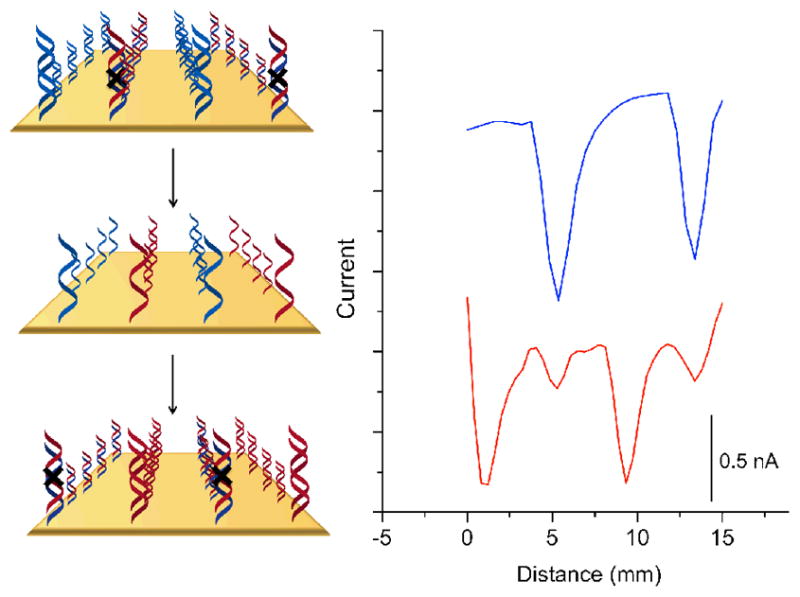
Oligonucleotide detection through dehybridization and hybridization. Current increases negatively down the y-axis. The surface was patterned with two strips of well-matched DNA and two strips that contain a mismatch. The blue trace is a preliminary scan in 2μM methylene blue and 200μM ferricyanide before dehybridization. The surface was subsequently soaked in phosphate buffer (5 mM phosphate, 50 mM NaCl, pH 7) at 65°C for 15 minutes. Single stranded oligonucleotides complementary to the formerly mismatched sequence heated to 65°C were added and allowed to cool to room temperature over 1 hour. The red trace shows the post-rehybridization data, where the mismatched sequences are now well matched and the formerly well matched, now mismatched.
Incorporating selective DNA patterning into a two-electrode platform thus enables sensitive detection of protein binding to DNA, as well as specific hybridization events with spatial resolution on a single surface. Multiple DNA probe sequences can be accurately grafted using readily available alkyne-labeled duplexes and an electrochemically-activated copper complex to initiate click coupling. DNA CT-based electrochemical assays are inherently more sensitive and selective than other DNA-based platforms, and as readout is accomplished at a secondary electrode, bulk surface defects that would otherwise complicate single-electrode measurements are readily detected. Moreover, detection at the secondary electrode insures that the signal is both DNA-mediated and electrocatalytically enhanced, yielding high differential sensitivity, indeed higher than that seen previously. The electrochemical DNA-grafting method reported here is well suited for preparing densely packed arrays of DNA sequences for use in multiple analyte detection on a single surface.
Acknowledgments
We are grateful to the NIH (GM61077) and the Arnold and Mabel Beckman Foundation for support of this work.
Footnotes
The authors declare no competing financial interests.
Supporting Information
Supporting figure S1. This material is available free of charge via the Internet at http://pubs.acs.org.
References
- 1.Chee M, Yang R, Hubbell E, Berno A, Huang XC, Stern D, Winkler J, Lockhart DJ, Morris MS, Fodor SPA. Science. 1996;274:610–614. doi: 10.1126/science.274.5287.610. [DOI] [PubMed] [Google Scholar]
- 2.Lockhart DJ, Winzeler EA. Nature. 2000;405:827–836. doi: 10.1038/35015701. [DOI] [PubMed] [Google Scholar]
- 3.Drummond TG, Hill MG, Barton JK. Nat Biotech. 2003;21:1192–1199. doi: 10.1038/nbt873. [DOI] [PubMed] [Google Scholar]
- 4.Kelley SO, Jackson NM, Hill MG, Barton JK. Angew Chem Int Ed. 1999;38:941–945. doi: 10.1002/(SICI)1521-3773(19990401)38:7<941::AID-ANIE941>3.0.CO;2-7. [DOI] [PubMed] [Google Scholar]
- 5.Boon EM, Ceres DM, Drummond TG, Hill MG, Barton JK. Nat Biotech. 2000;18:1096–1100. doi: 10.1038/80301. [DOI] [PubMed] [Google Scholar]
- 6.Peng XY, Li PCH, Yu HZ, Parameswaran M, Chou WL. Sens Actuators B. 2007;128:64–49. [Google Scholar]
- 7.Kang D, Xia F, Zuo X, White R, Vallee-Belisle A, Plaxco KW. NPG Asia Mat. 2012;4:e1. [Google Scholar]
- 8.Slinker JD, Muren NB, Gorodetsky AA, Barton JK. J Am Chem Soc. 2010;132:2769–2774. doi: 10.1021/ja909915m. [DOI] [PMC free article] [PubMed] [Google Scholar]
- 9.Pheeney CG, Arnold AR, Grodick MA, Barton JK. J Am Chem Soc. 2013;135:11869. doi: 10.1021/ja4041779. [DOI] [PMC free article] [PubMed] [Google Scholar]
- 10.Lam B, Das J, Holmes RD, Live L, Sage A, Sargent EH, Kelley SO. Nat Comm. 2013;4 doi: 10.1038/ncomms3001. [DOI] [PubMed] [Google Scholar]
- 11.Bard A, Fan K. Anal Chem. 1989;61:132–138. [Google Scholar]
- 12.Wittstock G. Solid-Liquid Interfaces (Topics in Applied Physics) Vol. 85. Wiley-VCH; Weinheim: 2003. Imaging Localized Reactivities of Surfaces by Scanning Electrochemical Microscopy; pp. 335–364. [Google Scholar]
- 13.Bard AJ, Denuault G, Friesner RA, Dornblaser BC, Tuckerman LS. Anal Chem. 1991;63:1282–1288. doi: 10.1021/ac00013a019. [DOI] [PubMed] [Google Scholar]
- 14.Zoski C, Luman CR, Fernandez JL, Bard AJ. Scanning Electrochemical Microscopy. 57 doi: 10.1021/ac070021c. [DOI] [PubMed] [Google Scholar]; Anal Chem. 2007;79:4957–4966. doi: 10.1021/ac070021c. [DOI] [PubMed] [Google Scholar]
- 15.Yamashita K, Takagi M, Uchida K, Kondo H, Takenaka S. Analyst. 2001;126:1210–1211. doi: 10.1039/b105097b. [DOI] [PubMed] [Google Scholar]
- 16.Turcu F, Schulte A, Hartwich G, Schuhmann W. Angew Chem Int Ed. 2004;43:3482–3485. doi: 10.1002/anie.200454228. [DOI] [PubMed] [Google Scholar]
- 17.Leasen S, Sritunyalucksana-Dangtip K, Hodak JH, Srisala J, Kulsing C, Veerasia W. Chemistry for Sustainable Development. Springer; Netherlands: 2012. pp. 249–264. [Google Scholar]
- 18.Gorodetsky AA, Hammond WJ, Hill MG, Slowinski K, Barton JK. Langmuir. 2008;24:14282–14288. doi: 10.1021/1a8029243. [DOI] [PMC free article] [PubMed] [Google Scholar]
- 19.Gold evaporation was accomplished using aluminum masks and a CVC Metal Physical Vapor Deposition system. Glass slides were coated in MPS ([3-mercaptopropyl]-trimethoxysilane). Slides were cleaned by boiling at 70° C for 10 minutes in Piranha solution (1:4 hydrogen peroxide: sulfuric acid), followed by baking for 10 minutes. Slides were then boiled in a 1:1:40 MPS: water: isopropyl alcohol solution for 10 minutes and then cured at 107° C for 8 minutes. A 150 nm gold monolayer was formed on the slides with either the patterning or the substrate pattern using aluminum masks and a CVC Metal Physical Vapor Deposition system with 0.5 mm diameter gold wire. See Goss CA, Charych DH, Majda M. Anal Chem. 1991;63:85.
- 20.Oligonucleotides were synthesized on an Applied Biosystems 3400 DNA synthesizer. Terminal C6 alkyne moieties were incorporated into the 5′ end of one of the strands purchased from Glen Research. Complementary unmodified strands were also synthesized. Preparation of all of the oligonucleotides followed a reported protocol. Each oligonucleotide was purified by high-performance liquid chromatography (HPLC) using a gradient of acetonitrile and 50 mM ammonium acetate. Following purification, oligonucleotides were desalted by ethanol precipitation and quantified based on their extinction coefficients at 260 nm (IDT Oligo Analyzer). The following sequences were prepared: well matched: 5′-CC-(CH2)6-GCT CAG TAC GAC GTC GA-3′ with its unmodified complement, a mismatch-containing sequence with a CA mismatch at the 9th base pair, and a TBP-binding sequence: 5′-CC-(CH2)6-GGC GTC TAT AAA GCG ATC GCG A-3′ with its unmodified complement.
- 21.Degassed [Cu(phendione)2]2+ was used as the inert catalytic precursor because of its aqueous solubility. [Cu(phendione)2]2+ was prepared by combining 1,10-phenanthroline-5,6-dione (Sigma Aldrich) (294.3 mg, 1.4 mmol) with CuSO4 (Sigma Aldrich) (111.7 mg, 700 μmol) in 5 mL of deionized water. ESI-MS: 580.2 (calc: 580.0). The complex was isolated as the PF6− salt or used directly in situ. Before application to the electrode surface, the complex was diluted to a final concentration of 50 μM in Tris buffer (10 mM Tris, 100 mM KCl, 2.5 mM MgCl2, 1 mM CaCl2, pH 7.6) and thoroughly degassed. When a sufficiently negative potential is applied to this compound, Cu(II) is reduced to Cu(I). A BAS Epsilon bipotentiostat was used both to apply potentials and record data. A constant potential was applied to the patterning electrodes that is sufficiently negative to continuously activate the copper at that location. For the constant applied potential, −250 mV was used, and application was allowed to proceed for 15 minutes. The 100 μM catalyst (20 μL) with 20 μL 50 μM DNA in Tris buffer was used to pattern each strip. Residual catalyst interaction with DNA was a concern, but no change in duplex melting temperatures in the presence of catalyst was observed. Neither protein binding nor hybridization was affected by catalyst.
- 22.a) Collman JP, Devaraj NK, Chidsey CED. Langmuir. 2004;20:1051–1053. doi: 10.1021/la0362977. [DOI] [PMC free article] [PubMed] [Google Scholar]; b) Devaraj NK, Dinolfo PH, Chidsey CED, Collman JP. J Am Chem Soc. 2006;128:1794–1795. doi: 10.1021/ja058380h. [DOI] [PMC free article] [PubMed] [Google Scholar]; c) Uszczynska B, Ratajczak T, Fryfrych E, Maciejewski H, Figlerowicz M, Markiewicz WT, Chmielewski MK. Lab Chip. 2012;12:1151–1156. doi: 10.1039/c2lc21096g. [DOI] [PubMed] [Google Scholar]; d) Devaraj NK, Miller GP, Ebina W, Kakaradov B, Collman JP, Kool ET, Chidsey CE. J Am Chem Soc. 2005;127:8600–8601. doi: 10.1021/ja051462l. [DOI] [PMC free article] [PubMed] [Google Scholar]
- 23.Electrochemical activation was used in selective formation of ferrocene-containing monolayers. See Devaraj NK, Dinolfo PH, Chidsey CE, Collman JP. J Am Chem Soc. 2006;128:1794. doi: 10.1021/ja058380h.
- 24.Kelley SO, Boon EM, Barton JK, Jackson NM, Hill MG. Nucl Acids Res. 1999;27:4830–4837. doi: 10.1093/nar/27.24.4830. [DOI] [PMC free article] [PubMed] [Google Scholar]
- 25.Chaubey AS, Malhotra BD. Biosensors and Bioelectronics. 2002;17:441–456. doi: 10.1016/s0956-5663(01)00313-x. [DOI] [PubMed] [Google Scholar]
- 26.The height of the probe electrode (z) was adjusted manually by lowering the electrode onto a 100-um teflon spacer placed on the corner of the substrate pad. No attempt was made to control for drift; while the measured currents were remarkably consistent for each substrate pad, the absolute signals varied somewhat from substrate to substrate. Electrochemical images of substrate surface (Figures 2–4, S1) are presented as scans from left to right. In all cases, the scanning origin is indicated by a distance of 0 on the x-axis, and the distance increases positively in the direction of scanning. Additionally, multiple scans can be obtained at different locations on the substrate pad. Variation in current between different locations on the substrate pad enabled calculation of standard deviation.
- 27.Gorodetsky AA, Buzzeo MC, Barton JK. Bioconj Chem. 2008;19:2285–2296. doi: 10.1021/bc8003149. [DOI] [PMC free article] [PubMed] [Google Scholar]
- 28.Muren NB, Olmon ED, Barton JK. Phys Chem Chem Phys. 2012;14:13754–13771. doi: 10.1039/c2cp41602f. [DOI] [PMC free article] [PubMed] [Google Scholar]
- 29.The peak width depends on the speed of scanning, which was optimal at ~0.6 mm/sec. Some inconsistencies are observed because the scanning was performed manually.
- 30.Nikolov DB, Hu SH, Lin J, Gasch A, Hoffmann A, Horikoshi M, Chua NH, Roeder RG, Burley SK. Nature. 1992;360:40. doi: 10.1038/360040a0. [DOI] [PubMed] [Google Scholar]
- 31.a) Gorodetsky AA, Ebrahim A, Barton JK. J Am Chem Soc. 2008;130:2924–2925. doi: 10.1021/ja7106756. [DOI] [PMC free article] [PubMed] [Google Scholar]; b) Boon EM, Salas JW, Barton JK. Nat Biotechnol. 2002;20:282–286. doi: 10.1038/nbt0302-282. [DOI] [PubMed] [Google Scholar]
- 32.TATA-Binding Protein (TBP) was purchased from ProteinOne and stored at −80 C until use. MicroBiospin 6 columns (BioRad) were used to exchange the shipping buffer for Tris buffer (10 mM Tris, 100 mM KCl, 2.5 mM MgCl2, 1 mM CaCl2, pH 7.6). Prior to electrochemical measurements with TBP, electrodes were incubated with 1 μM Bovine serum albumin (BSA) for 30 min, followed by rinsing with Tris buffer. TBP was titrated onto the surface in a range of 1 μM to 25 μM protein, with each concentration allowed to incubate for 15 minutes prior to scanning.
- 33.After a preliminary scan of duplex DNA on the electrode surface, dehybridization was induced through the heating of the surface in phosphate buffer (5 mM phosphate, 50 mM NaCl, pH 7.0) to 65°C for fifteen minutes. Subsequently, the surface was rinsed with 65°C phosphate buffer (pH 7.0). The complementary strand (25 μL of 50 μM strand) was then added to the surface and incubated for an hour while the surface cooled to ambient temperature. The surface was subsequently scanned again.