

Abstract
Purposes
Heart rate characteristics monitoring for early detection of late-onset neonatal sepsis was first described in 2003. This technique, which uses mathematical methods to report the fold-increase in the risk of imminent neonatal sepsis, adds independent information to laboratory tests and clinical findings, and, in a large randomized trial, reduced NICU mortality of very low birth weight infants. Through re-analysis and new secondary analyses of published studies, we have systematically evaluated the utility of this new risk marker for screening the growing population of premature infants.
Methods
We followed the guidelines proposed by Hlatky and coworkers (Circulation 2009), reviewed past works, and re-analyzed data from 1489 patients receiving conventional monitoring alone, 348 of whom had 488 episodes of proven sepsis, in the large randomized trial.
Results
Heart rate characteristics monitoring passed all phases of risk marker development from proof of concept to improvement of clinical outcomes. The predictiveness curve affirmed good calibration, and addition of the heart rate characteristics index to predictive models using standard risk factors favorably impacted the receiver operating characteristic curve area (increase of 0.030), continuous net reclassification index (0.389) and the integrated discrimination index (0.008), and compares well to other modern risk factors.
Conclusion
Heart rate characteristics monitoring is a validated risk marker for sepsis in the NICU.
Keywords: Neonatal sepsis, neonatal intensive care, heart rate variability, entropy, predictive monitoring, randomized clinical trial
Introduction
The modern age of information technology is catching up with bedside clinical monitoring. Database infrastructures, high-speed computer processing, and sophisticated mathematical signal processing algorithms are increasingly brought to bear on the problem of early detection of subacute potentially catastrophic illnesses in Intensive Care Unit patients. New predictive monitoring algorithms have great promise for improving patient outcomes, but are newcomers to standard biostatistical paradigms for assaying the utility of new risk markers for illness.
In 2009, Hlatky and coworkers provided systematic criteria for evaluation of novel markers of cardiovascular risk1. The goal was to provide a frame of reference for evaluation and comparison of new imaging and biomarkers for heart disease, though the principles should be applicable to such tests in other medical settings. The framework is to test the impact of adding the new risk marker to multivariable predictive statistical models that use standard risk factors, and to use statistical tests of the hypothesis that the new risk marker improves the clinical utility of the predictive models. This is an area of rapid research progress 2-14.
More than 10 years ago, we discovered that clinical signs of sepsis in premature infants were preceded by changes in heart rate control 15. Interestingly, the changes were the same as those classically known to accompany fetal distress — reduced heart rate variability and transient decelerations—and they were not apparent using standard NICU bedside monitors. We developed mathematics to detect these abnormal heart rate characteristics (HRC)16-27, which defy conventional time- and frequency domain approaches, and made multivariable predictive statistical models to estimate the risk of imminent illness based only on heart rate analysis. We call this heart rate characteristics monitoring. We finalized the model after external validation28, and, in order to place it in clinical context, related its findings to laboratory tests29, clinical findings30, neurodevelopmental outcome 31, necrotizing enterocolitis 32, and mortality33.
Most importantly, we performed a large randomized clinical trial to test the impact of HRC monitoring34. We randomized 3003 VLBW infants and analyzed 2989, making this the largest RCT of VLBW infants of which we are aware. It was carried out over 6 years at 9 tertiary care NICUs in the eastern US using an FDA-cleared HeRO monitor. It was jointly sponsored by the NIH and Medical Predictive Science Corporation (MPSC, Charlottesville, VA) and was registered at ClinicalTrial.gov (NCT00307333). The major result was a reduction in mortality from 10.2% to 8.1%.
This is the first realization of the promise of improved care of Intensive Care Unit patients by better use of existing bedside monitor data through complex signals bioinformatics, and more are following35,36. As such, it requires careful evaluation to allow comparison with other new strategies such as biomarkers. A novel aspect of HRC monitoring, in contrast to biomarker screening, is its continuous nature. Every hour, an estimate of the fold-increase in risk of imminent illness is shown, and clinicians derive much information from the changing nature of the estimate. For example, two infants with 3.0-fold increase in risk might have very different clinical scenarios – one, say, might have received a parasympatholytic agent to dilate pupils for an eye exam, and the other just beginning to show very subtle clinical signs of illness. For the first, the abnormal score is expected, and should not lead to any new clinical activity. For the other, though, the elevated score – especially if rising – might serve as an additional indicator of illness, and lead to earlier-than-usual evaluation and therapy for sepsis. Since mortality rises with the delay until antibiotic therapy is started, there is intuitive benefit in this early detection – whether as an indicator of truly subclinical illness, or as an early warning once sepsis has taken root.
This is different from other new biomarkers that are measured once or only a few times, and usually when clinical findings suggest that an illness is present. New tools for testing the statistical significance of added information have not been fully developed for continuous bedside monitoring, as a great deal of the information for the clinician might lie in the trends rather than in isolated readings.
Our aim in this work is a systematic evaluation of HRC monitoring as a novel risk marker for neonatal sepsis. We follow recommendations for reporting on novel risk markers using biostatistical tools, some of them new, suggested by Hlatky and coworkers1. We begin with a description of the phases of evaluation of a novel risk marker and retrace development of HRC monitoring.
Phases of evaluation
HeRO monitoring was developed at the University of Virginia beginning in 1999, received FDA 510(k) clearance in 2003, and the randomized trial was started in 2004. Prior to the trial, data sets of up to more than 1000 infants at the University of Virginia and at Wake Forest University were used to develop and to validate the statistical model, and to explore HRC monitoring in its clinical context. These results informed phases 1 to 3 listed below. The randomized clinical trial addressed all the phases either formally or informally.
1. Proof of concept—Do novel marker levels differ between subjects with and without outcome?
The concept of changing degrees of reduced variability and transient decelerations near the time of sepsis diagnosis was demonstrated in 200115, and examples of dynamic changes in the HeRO score near the time of sepsis were given beginning in 200328,37,38. Most importantly, the clinical trial generated a very large database of results and allowed better distinction of the HeRO score in infants with and without sepsis. Figure 1 shows the semi-logarithmic densities of HeRO score for infants in the RCT whose HeRO score was not displayed. For infants who never had sepsis, there is a near-Gaussian distribution centered near 0.5 fold-increase risk. Infants who had sepsis were categorized by time from the episode, either remote or within 1 day. The important finding is that the distributions shift to larger HeRO scores when sepsis is more likely.
Figure 1.
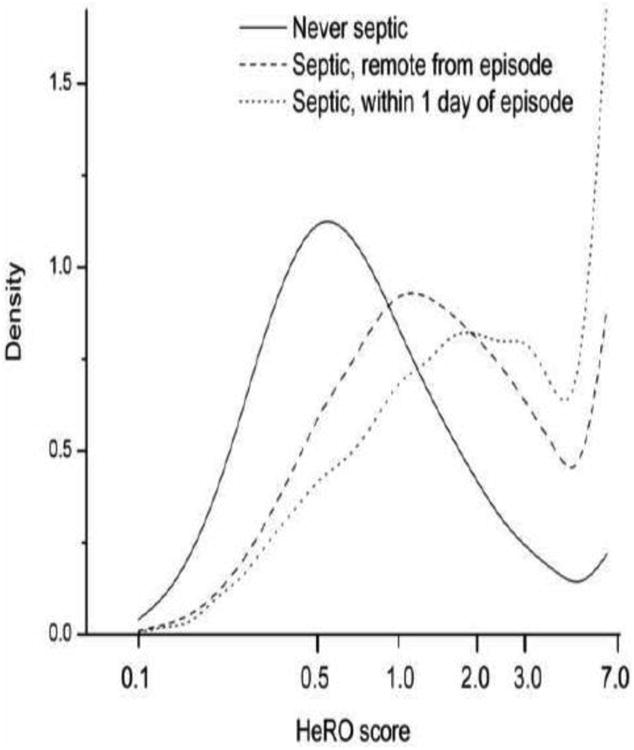
Distributions of HeRO scores in infants receiving conventional monitoring alone in the HeRO RCT. The solid line represents infants who were never septic, the dashed line represents infants who had an episode of sepsis but were not within a week of the event, and the dashed line represents infants within 1 day of sepsis. The numbers of HeRO scores represented are 1.6 × 10⁶, 2.2 × 10⁵ and 1.1 × 10⁴, respectively. Note that the HeRO monitor does not display values >7, and higher values are lumped into the rightmost bin.
2. Prospective validation—Does the novel marker predict development of future outcomes in a prospective cohort or nested case-cohort/case-cohort study?
This was demonstrated in 2003 and 2004, when multivariable regression models developed at the University of Virginia to predict sepsis28 and death33 were validated at Wake Forest University. Figure 2 shows predictiveness curves 39 for HeRO scores in 1022 infants from University of Virginia and Wake Forest University, and for the 1489 infants in 9 hospitals (including new infants at University of Virginia and Wake Forest University) in the RCT whose HeRO scores were not displayed. Thus these results are not biased by the reaction of the clinician to the HeRO score. The curves are superimposable, pointing to unchanging predictive performance.
Figure 2.
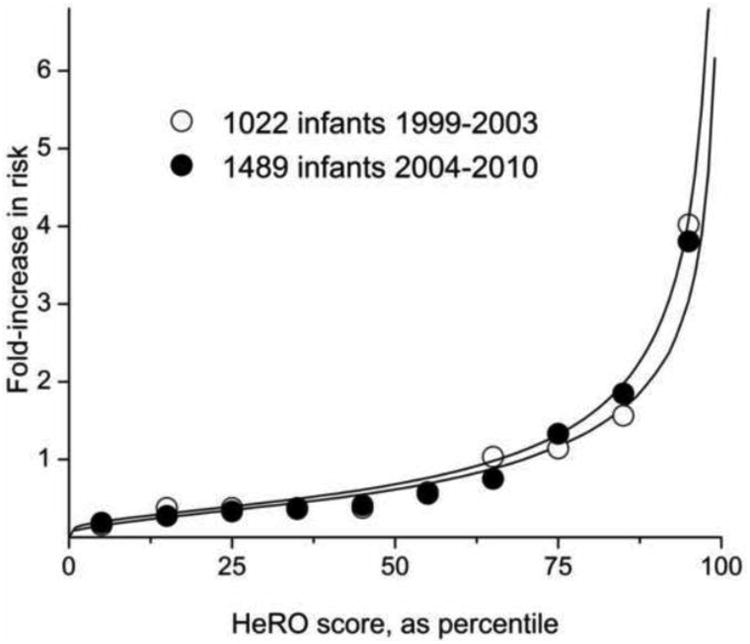
Predictiveness curve for HeRO score in estimating sepsis risk in 2 large populations studied over more than a decade. The solid lines shows measured but non-displayed HeRO scores arrayed from smallest to largest. The circles are the observed fold-increase in risk of sepsis. Open circles are from 1022 patients at 2 NICUs from 1999 to 2003, and filled circles are from 1489 infants at 9 NICUs from 2004 to 2010. Data from 38 and 34.
Moreover, the close fit of the observed to predicted event rates signifies calibration of the model and justifies further analysis of its performance3.
3. Incremental value—Does the novel marker add predictive information to established, standard risk markers?
This was demonstrated in 2005 for laboratory tests40 and in 2007 for clinical signs of illness41. The assay was the p value of the HRC index in multivariable models using test results and clinical findings to predict imminent sepsis. Examples of the diagnosis of neonatal sepsis in asymptomatic patients were shown in 200637 and 200730. In these patients, established and standard risk markers were available to the clinicians, and HeRO scores led to diagnosis in asymptomatic or only very mildly symptomatic patients.
This analysis is extended below in the section “Recommendations for reporting of novel risk markers.”
4. Clinical utility—Does the novel risk marker change predicted risk sufficiently to change recommended therapy?
The RCT showed that more antibiotics were used in the infants whose HRC monitoring results were displayed, though only 5%, a statistically insignificant amount. The finding of improved outcomes, though, implies better timing of therapy as a result of HeRO monitoring. This has been borne out in a secondary analysis of 700 infants in the trial who had sepsis: antibiotic days were 10% higher in infants whose HRC monitoring results were displayed (32 vs 29 days, p<0.05) 42.
5. Clinical outcomes—Does use of the novel risk marker improve clinical outcomes, especially when tested in a randomized clinical trial?
This was formally tested, as noted above, in a large RCT that showed a survival benefit to HeRO monitoring even though no interventions were mandated in response to changes in the scores34.
6. Cost-effectiveness—Does use of the marker improve clinical outcomes sufficiently to justify the additional costs of testing and treatment?
This has not been formally evaluated. The cost of the monitoring is about that of the reagents and technician time to perform a complete blood count, about $10 per day. The RCT showed that 30 lives were saved per 1500 infants having an average NICU stay of about 60 days, or 1 life per about 3000 NICU days.
For the formal risk marker evaluation, we performed new secondary analyses of the data from the RCT.
Materials and Methods
Marker to be tested
The novel marker is the HRC index, or HeRO score, which is reported to the clinician as the fold-increase in risk of imminent illness. It is based on mathematical analysis of heart time series of 4096 beats over the preceding 12 hours, in which the degree of reduced HR variability and transient decelerations are captured by the standard deviation, sample asymmetry and sample entropy28.
Patient population
This analysis makes use of data acquired during the recent RCT of HRC monitoring in VLBW infants34. We focus on the 1489 patients whose HeRO scores were recorded but not displayed to clinicians, and focus further on the 348 of these infants who had 488 episodes of blood culture-positive sepsis.
Statistical analysis
We used methods developed by Cook, Pencina, D'Agostino, Pepe and their coworkers to calculate metrics of reclassification and discrimination 2-14. We analyzed 1.83M individual hourly HeRO scores, 28,318 of which were measured in the 12 hours leading up to the diagnosis of sepsis. We used multivariable logistic regression adjusted for repeated measures using the Huber-White method43. We used our own routines in Matlab. Confidence intervals were determined by bootstrap.
Results
Recommendations for reporting of novel risk markers
Section 1 recapitulates the major results of the RCT of HRC monitoring34. For the following sections, we performed new secondary analyses of data from the 1489 infants who had display of only conventional monitoring. In these patients, the HeRO score was not displayed or used in their care.
1. Report the basic study design and outcomes in accord with accepted standards for observational studies
The RCT was published in 201134. The study design was to make available the HeRO score in 50% of patients, to provide conventional monitoring alone to the other 50%, and to measure time on ventilator and death. No protocol-mandated interventions were made, and clinicians used judgment and experience to integrate the new risk marker into their clinical care. The primary outcome was a composite of days alive and not on a ventilator for the 120 days after randomization, a common kind of outcome for sepsis studies in adults. The study was powered to detect a 2.0 day difference, which we judged to be clinically important. In fact, there was a 2.3 day improvement in the infants whose HRC monitoring results were displayed, but the variance was higher than anticipated, and this result was not statistically significant (p=0.08). In a pre-specified secondary outcome analysis, we found a mortality reduction from 10.2% to 8.1% (p=0.04). In the pre-specified subgroup of extremely low birth weight (ELBW, <1000g), the mortality reduction was larger – 17.6% to 13.2% (p<0.02).
2. Report levels of standard risk factors and the results of risk model using these established factors
Standard risk factors for neonatal sepsis include birth weight (BW), post-menstrual age (PMA), estimated gestational age at birth (GA), and endotracheal intubation 44. We made a risk model for the outcome of sepsis in the next 72 hours using multivariable logistic regression adjusted for repeated measures. The results are shown in Table 3.
Table 3. Regression analyses for early detection of neonatal sepsis.
| Standard risk factors | |||
|---|---|---|---|
| Variable | Normalized coefficient | P-value | Chi-square |
| Intercept | 0.28 | 0.738 | 0.1 |
| PMA | −0.68 | 0.000 | 72.4 |
| Intubated | 0.23 | <0.001 | 19.1 |
| BWT | v0.48 | <0.001 | 24.8 |
| EGA | 0.22 | 0.013 | 6.1 |
| Standard risk factors plus HeRO score | |||
|---|---|---|---|
| Variable | Normalized coefficient | P-value | Chi-square |
| Intercept | 0.22 | 0.774 | 0.1 |
| PMA | −0.48 | <0.001 | 37.0 |
| Intubated | 0.20 | <0.001 | 15.1 |
| BWT | −0.37 | <0.001 | 14.7 |
| EGA | 0.21 | 0.017 | 5.7 |
| HeRO score | 0.42 | <0.001 | 60.6 |
PMA = post-menstrual age
BWT = birth weight
EGA = estimated gestational age at birth
The outputs of the models as well as the HeRO score itself near the time of sepsis are shown in Figure 3. While the predictive performance of the standard risk factor model has a good ROC area 0.745, the output is static near sepsis events. The baseline risk at the time of sepsis is high, about two-fold that for the entire NICU course. This risk is due to the degree of prematurity and to the presence of mechanical ventilation. The clinical utility of a predictive model that uses standard risk factors alone might lie in identifying infants at high risk of sepsis, but it lacks dynamic properties of the HeRO score that can be useful to the clinician in determining the timing of testing and therapy. The predictive performance of the model incorporating standard risk factors and the HeRO score is better, with ROC area 0.775, and increases over the day or so prior to events. Finally, the HeRO score itself, which does not use any standard risk factors but is calculated only from heart rate measures, captures the a priori risk several days prior, and has a sharper increase near sepsis.
Figure 3.
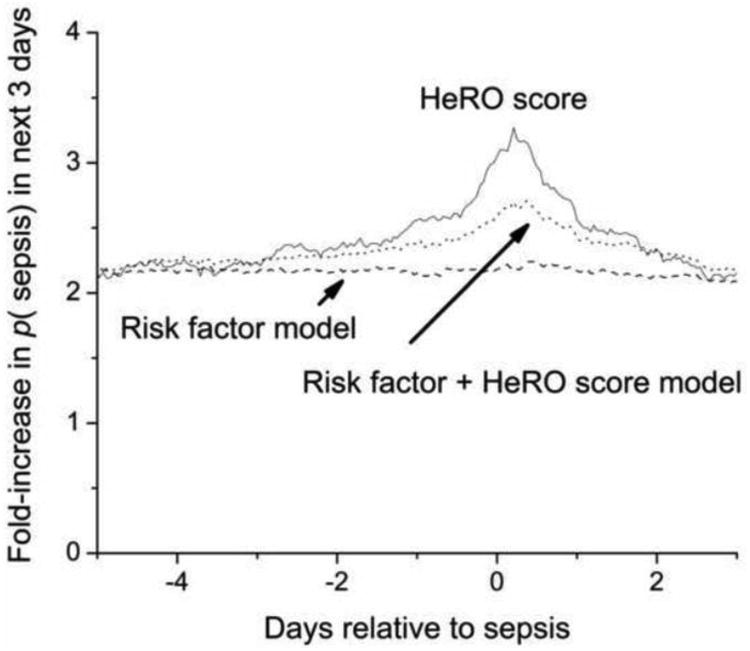
Statistical models for neonatal sepsis measured continuously for 5 days before and 3 days after episodes of proven sepsis in the RCT 34. The lowest line is the risk prediction from standard risk markers, the middle line is the risk prediction after adding the HeRO score to the standard risk factors, and the top line is the HeRO score itself. While all models capture the increased baseline risk of infants who develop sepsis, addition of the HeRO score (and the HeRO score itself) capture dynamical changes in heart rate characteristics near the diagnosis of neonatal sepsis.
3. Evaluate the novel marker in the population, and report
a. Relative risk, odds ratio, or hazard ratio conveyed by the novel marker alone, with the associated confidence limits and P value
For this analysis, we categorized HeRO score into high, intermediate and low risk. These arbitrary thresholds are used only for this statistical analysis, and are not demarcated on the monitor display. They are based on the 2005 study of HRC monitoring in 1022 infants in the University of Virginia and Wake Forest University NICUs38, showing that 70% of scores are 1-fold or less the average risk, and 10% are more than 2-fold. We have suggested that scores of 1-fold or less are low-risk, of 1- to 2-fold are intermediate risk, and of greater than 2-fold are high-risk.
The OR (and 95% CI from bootstrap) of the HeRO score alone in the high- and intermediate-risk zones, compared to the low risk group, were 6.01 (4.94-7.31) and 2.53 (2.11-3.03)(p <0.0001).
b. Relative risk, odds ratio, or hazard ratio for novel marker after statistical adjustment for established risk factors, with the associated confidence limits and P value
We adjusted for the standard clinical risk factors of PMA, BW, EGA and intubation, shown above. The OR of the HeRO score after adjusting for standard risk factors for the high- and intermediate-risk groups compared to low risk group, were 2.38 (1.87-3.02) and 1.47 (1.22-1.78)(p <0.0001).
c. P value for addition of the novel marker to a model that contains the standard risk markers
In this predictive statistical model, shown at the bottom of Table 3, all variables remained statistically significant. HeRO score was the most significant, with the highest chi-square value and lowest p (<10−5).
4. Report the discrimination of the new marker
a and b. C-index and confidence limits for the model with and without the novel risk marker
The C-index and its confidence limits for model with established risk markers were 0.745 (95% CI 0.719 to 0.771). The C-index and its confidence limits for model including novel marker and established risk markers were 0.775 (95% CI 0.751 to 0.798). Thus the C-index improved by 0.030. The C-index for the HeRO score alone was 0.744 (95% CI 0.720 to 0.767).
c. Integrated discrimination index, discrimination slope, or binary R2 for the model with and without the novel risk marker
This integrated discrimination index (IDI) evaluates the difference in mean probabilities of event and non-event using standard risk factor models with and without the candidate risk marker. Figure 4 shows the probability densities for non-events and events for standard risk factor models with and without HRC monitoring. The most apparent difference is the shift of probabilities of illness to the left in the non-event group. Clinically, this translates to more reassurance about infants that are not destined to have imminent events. The effect of HRC monitoring on the distribution of event probabilities in infants who did have events was more subtle because the plot does not take into account more pronounced changes near the time of sepsis. Overall, the value of the IDI was 0.0081 (95% CI 0.0074 to 0.0097).
Figure 4.
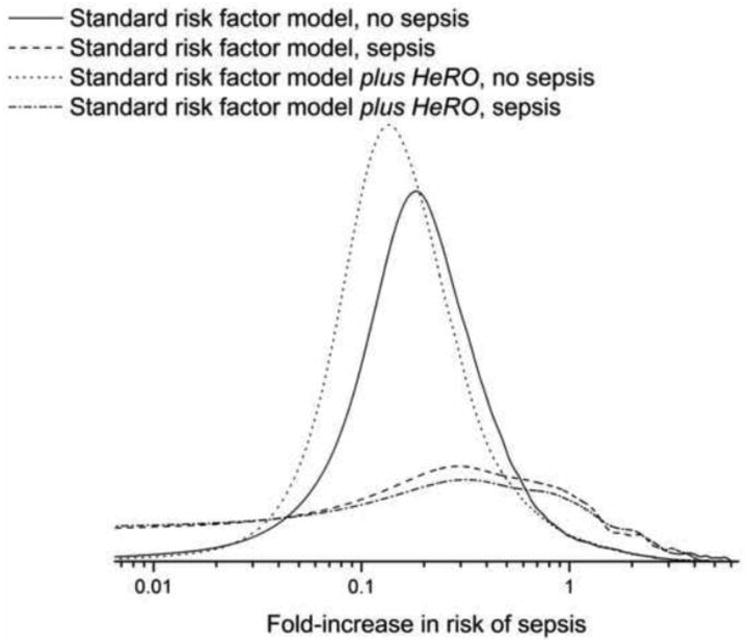
Probability density functions of model predictions. From left to right, the first two lines are risk predictions for infants who did not have sepsis. The dotted line is the risk prediction for standard risk markers plus the HeRO score and the solid line is the risk prediction for standard risk markers alone. The second two lines are for infants who did have sepsis. The dashed line is the risk prediction for standard risk markers plus the HeRO score and the dashed-dotted line is the risk prediction for standard risk markers alone. Addition of the HeRO score shifts the distribution to lower values in infants who did not have sepsis, and has smaller changes in infants who did have sepsis, who generally have higher risk.
d. Graphic or tabular display of predicted risk in cases and non-cases separately, before and after inclusion of the new marker
Figures 5A and B show the values of the standard risk factors plus HeRO score model as a function of the standard risk factors alone model for sepsis and non-sepsis cases, respectively. The most apparent finding is the reduction in event probabilities after incorporation of the HeRO score at times without events – that is, the high frequency of data points below the line of identity in panel A. This is revisited below in section 5b. Clinically, this might lead to increased reassurance about low-risk infants.
Figure 5.
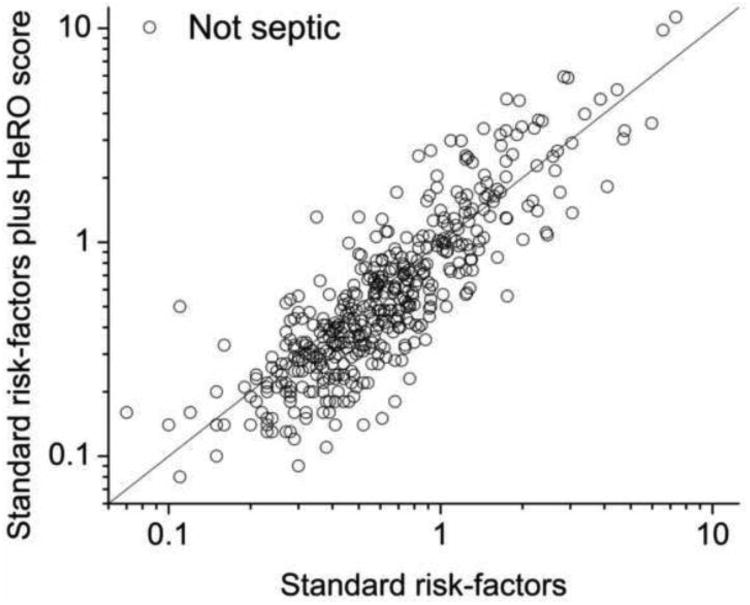
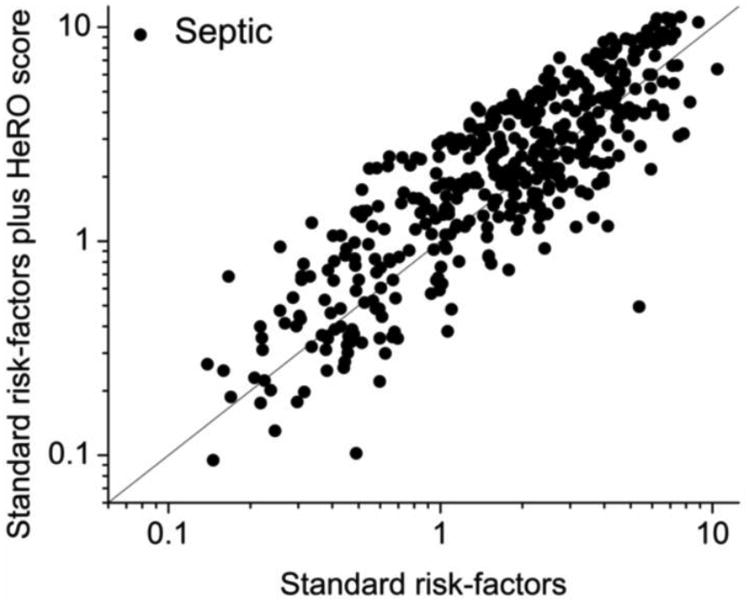

Model predictions with and without HeRO score, for non-cases (panel A) and cases (panel B). Consistent with the probability densities in Figure 4, there is reduction in predicted risk for non-cases when the HeRO score is added. (Panel C). Dependence of the continuous NRI(>x) on the change in HeRO score required for reclassification. More stringent requirements reduced not only the number of reclassified measurements (right-axis, gray steps) but also the NRI (left-axis, solid line and dashed 95% CI).
5. Report the accuracy of the new marker
a. Display observed versus expected event rates across the range of predicted risk for models without and with the novel risk marker
Figure 6 shows observed and expected event rates. We calculated 2 as a measure of goodness of fit, and we found it to be much smaller for the standard risk factor plus HeRO model (422 compared with 1925), confirming the visual impression of better fit, especially in the very low risk ranges. This finding resonates with Figures 5B.
Figure 6.
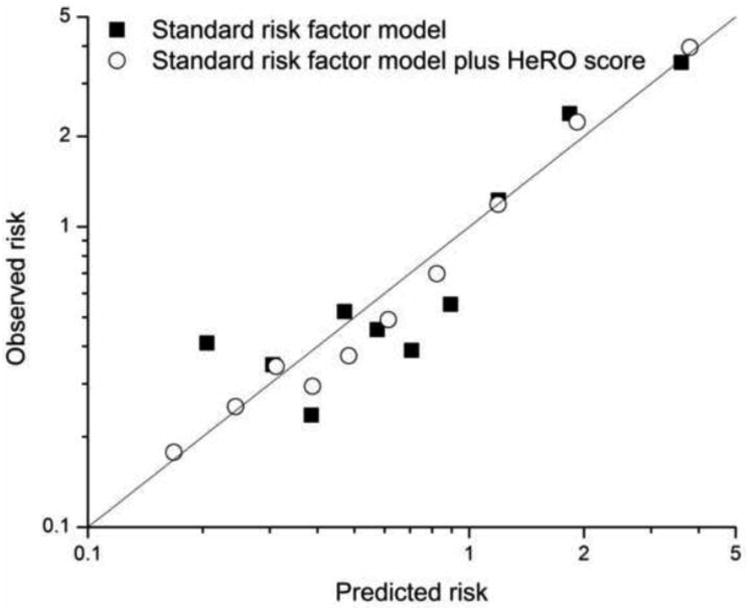
Observed and expected risk rates for models. Addition of HeRO score to standard risk factors yields a model with closer fit to observed event rates.
b. Using generally recognized risk thresholds, report the number of subjects reclassified and the event rates in the reclassified groups
Cook 10 and Pencina and coworkers5 proposed in that models incorporating useful new markers will be able to reclassify subjects to more accurate risk strata. That is, patients who have events should be reclassified into higher risk groups, and patients without events should be reclassified into lower risk groups. They described the net reclassification improvement (NRI) measure as the sum of the proportions of patients that are better classified by the model with the new marker. Pencina and coworkers extended their definitions to different strategies of categorization and introduced a categorical NRI(cutoff1, cutoff2…cutoffn) when n+1 clinically useful categories existed, and a continuous NRI(>0) when any change might be clinically important6.
We first calculated reclassification among categories of risk, using low- (HeRO score<1 fold-increase in p(illness)), intermediate- (1 to 2) and high-risk (2 or greater). Model estimates that were reclassified to high-risk from low or intermediate were associated with a 4.88% rate of sepsis, closer to the overall high-risk sepsis rate of 5.47% than the overall intermediate-risk rate of 2.26%. On the other hand, measures that were reclassified to low-risk from intermediate- or high-risk were associated with a sepsis rate of 1.91%. This was closer to the overall intermediate-risk rate of 2.26% than to the overall low-risk rate of 0.65%. Overall, the categorical NRI(1,2) was 0.08.
Table 4 shows the results of this analysis of individual hourly HeRO scores, using the model of standard risk factors as the original classifier, and the model incorporating HeRO score as the reclassifier. This differs from the technique as originally described by using individual hourly measures rather than individual patients, and testing for statistical significance is confounded by the repeated measures.
Table 4. Reclassification of risk category.
| Category: Standard risk factors plus HeRO score | |||||
|---|---|---|---|---|---|
| Overall | Low | Middle | High | Total | |
| Category: Standard risk factors | Low | 1222343 | 67814 | 1293153 | 2996 |
| Middle | 78226 | 168237 | 58131 | 304594 | |
| High | 1166 | 44502 | 185072 | 230740 | |
| Total | 1301735 | 280553 | 246199 | 1828487 | |
| Sepsis | Low | Middle | High | Total | |
| Low | 7123 | 1066 | 119 | 8308 | |
| Middle | 1323 | 3616 | 2862 | 7801 | |
| High | 70 | 1656 | 10483 | 12209 | |
| Total | 8516 | 6338 | 13464 | 28318 | |
| Sepsis rate | Low | Middle | High | Total | |
| Low | 0.58% | 1.57% | 3.97% | 0.64% | |
| Middle | 1.69% | 2.15% | 4.92% | 2.56% | |
| High | 6.00% | 3.72% | 5.66% | 5.29% | |
| Total | 0.65% | 2.26% | 5.47% | 1.55% | |
| Fold-increase | Low | Middle | High | Total | |
| Low | 0.38 | 1.02 | 2.56 | 0.41 | |
| Middle | 1.09 | 1.39 | 3.18 | 1.65 | |
| High | 3.88 | 2.40 | 3.66 | 3.42 | |
| Total | 0.42 | 1.46 | 3.53 | 1.00 | |
| No sepsis | Low | Middle | High | Total | |
| Low | 1215220 | 66748 | 2877 | 1284845 | |
| Middle | 76903 | 164621 | 55269 | 296793 | |
| High | 1096 | 42846 | 174589 | 218531 | |
| Total | 1293219 | 274215 | 232735 | 1800169 | |
The limitation of this approach is that these risk categories are not brightly defined in the clinical use of HeRO monitoring. The high-risk HeRO scores above 2-fold increase in risk belong to chronically ill infants as well as those in early stages of sepsis, and require bedside evaluation to discriminate. Accordingly, we calculated the continuous NRI, or NRI(>0), for which reclassification takes place regardless of the magnitude of the difference in model predictions. The data plotted in Figures 5A and B underlie these metrics. Each (x,y) data point is the prediction of the model using standard risk factors plus HeRO score as a function of the prediction of the model using standard risk factors plus the HeRO score: the line is y=x. Points above the line signify higher risk prediction after adding HeRO score to standard risk factors; points below the line signify lower risk prediction after adding HeRO score to standard risk factors. Each plot shows 488 points – one from each sepsis episode (panel B), or an equal number of points chosen at random from non-sepsis cases (panel A). The NRI was 0.389.
Clearly, the number of points reclassified will vary depending on how much change is required in the model predictions. For HeRO scores, a small change will not necessarily be considered relevant. A unit change, though, might well raise sufficient concern that the infant is re-examined for signs of illness. Figure 5C plots the NRI(x), where the x-axis values are the changes in HeRO score. For a unit change or larger in HeRO score, which took place 11% of the time, NRI(1) was 0.13.
Discussion
We have evaluated heart rate characteristics monitoring as a risk marker for late-onset neonatal sepsis. Our major findings are that it adds statistically and clinically important information in the management of very low birth weight infants through detection of reduced heart rate variability and transient decelerations. The most powerful argument in favor of its use is the more than 20% relative survival benefit demonstrated in a large randomized clinical trial. We conclude that heart rate characteristics monitoring using the HeRO score meets current criteria as a valid new risk marker for neonatal sepsis.
Statistical evaluation of a continuous risk marker
We employed modern concepts of evaluation of risk markers, and found an increase in C-statistic of 0.030, continuous and categorical net reclassification improvements of 0.389 and 0.08, respectively, and integrated discrimination index 0.008. We interpret these results to mean that the HeRO score has a medium effect size as a predictor8. We note as well that this is an active area of research and development4,7, and that these measures may be supplemented or refined in the future.
It is important to highlight the fundamental difference between bedside continuous predictive monitoring and the more common practice of measuring biomarkers or imaging one time, at first presentation or at first signs of illness. The mission of predictive monitoring such as the HeRO score is to alert clinicians to very early phases of illness, prior to any signs or symptoms. Thus it is measured not once but continuously, and these repeated measures seriously challenge the modern statistical evaluation of novel risk markers. Nonetheless, we analyzed reclassification as both categorical (Table 4) and continuous (Figure 5), and we tested the dependence of the NRI on the magnitude of the change in model prediction after adding HeRO score to standard risk factors. The results seem to be in keeping with other novel risk markers.
New insight into possible mechanisms for the clinical impact of HeRO monitoring
As Figures 5A and 6 show, addition of the HRC index lowered the risk assessment of many infants already considered at low or only intermediate risk. The relevant clinical scenario is the stable infant with low HeRO score and very subtle signs of illness. In this setting, clinicians may opt to defer workup until more signs present, or until the HeRO score rises. In this way, we speculate that some sepsis workups were avoided.
Predictive monitoring in the care of at-risk patients
We foresee a change in the way that medicine is practiced in hospitals through bedside monitoring that predicts subacute potentially catastrophic illness. Clinicians are greatly challenged to make decisions based on current monitoring - only momentary displays of present values and limited, unwieldy views of trends. Doctors suspect, though, that better analysis of the multiple streams of data could detect subclinical deterioration. This would allow earlier diagnosis and therapy, and the promise of improved outcome. Experienced clinicians develop sixth senses about impending disaster, but would be hard-pressed to quantify their intuition or to be present at every bedside all the time.
We envision continuous monitoring that detects physiology going wrong. This requires new alliances between expert clinicians and quantitative scientists, and large-scale computing optimized for testing novel algorithms in very large data sets with meticulous clinical annotation. Numerous efforts are underway 35,36,45-50. Each requires systematic evaluation with the goal of quantifying the degree of information that the new monitoring affords over the old.
Table 1. Phases of Evaluation of a Novel Risk Marker.
| Heart rate characteristics monitoring for neonatal sepsis | Reference | |
|---|---|---|
| 1. Proof of concept—Do novel marker levels differ between subjects with and without outcome? | Yes | 15,28,37,38, Figure 1 |
| 2. Prospective validation—Does the novel marker predict development of future outcomes in a prospective cohort or nested case-cohort/case-cohort study? | Yes | 28,33, Figure 2 |
| 3. Incremental value—Does the novel marker add predictive information to established, standard risk markers? | Yes | 30,37,40,41; This paper section entitled “Recommendations for reporting of novel risk markers” |
| 4. Clinical utility—Does the novel risk marker change predicted risk sufficiently to change recommended therapy? | Yes | 34 |
| 5. Clinical outcomes—Does use of the novel risk marker improve clinical outcomes, especially when tested in a randomized clinical trial? | Yes | 34 |
| 6. Cost-effectiveness—Does use of the marker improve clinical outcomes sufficiently to justify the additional costs of testing and treatment? | Not formally evaluated |
Table 2. Recommendations for Reporting of Novel Risk Markers.
| Heart rate characteristics monitoring for neonatal sepsis | Reference | |
|---|---|---|
| 1. Report the basic study design and outcomes in accord with accepted standards for observational studies | Individually randomized to show monitor or not. Outcomes: days alive and not on ventilator (primary); mortality, hospital stay, antibiotic days (secondary) | 34 |
| 2. Report levels of standard risk factors and the results of risk model using these established factors | This paper, Figure 3 | |
| 3. Evaluate the novel marker in the population, and report: | ||
| a. Relative risk, odds ratio, or hazard ratio conveyed by the novel marker alone, with the associated confidence limits and P value | ORs 6.0 and 2.5 for high- and intermediate risk groups compared to low risk group | This paper |
| b. Relative risk, odds ratio, or hazard ratio for novel marker after statistical adjustment for established risk factors, with the associated confidence limits and P value | ORs 2.4 and 1.5 for high- and intermediate risk groups compared to low risk group | This paper |
| c. P value for addition of the novel marker to a model that contains the standard risk markers | <10−5 | This paper, Table 3 |
| 4. Report the discrimination of the new marker: | ||
| a. C-index and its confidence limits for model with established risk markers | 0.75 (0.72, 0.77) | This paper |
| b. C-index and its confidence limits for model including novel marker and established risk markers | 0.78 (0.75, 0.80) | This paper |
| c. Integrated discrimination index, discrimination slope, or binary R2 for the model with and without the novel risk marker | IDI 0.0081 | This paper, Figure 4 |
| d. Graphic or tabular display of predicted risk in cases and noncases separately, before and after inclusion of the new marker | Figures 5A and 5B | This paper |
| 5. Report the accuracy of the new marker: | ||
| a. Display observed vs expected event rates across the range of predicted risk for models without and with the novel risk marker | Figure 6 | This paper |
| b. Using generally recognized risk thresholds, report the number of subjects reclassified and the event rates in the reclassified groups | Continuous NRI 0.39 | This paper |
Acknowledgments
This work was supported by grant R01-HD48562 from the National Institutes of Health by Medical Predictive Science Corporation, Charlottesville, VA, which provided study hardware and software for heart rate characteristics monitoring and for study data collection and management. Neither of these funding sources had any role in the design of the study, in the analysis and interpretation of the data, in the decision to submit the manuscript, or in the preparation, review, or approval of it.
Footnotes
Financial Disclosure and Conflict of Interest: Drs. Lake and Moorman have consultant agreements and equity shares in Medical Predictive Science Corporation.
References
- 1.Hlatky MA, Greenland P, Arnett DK, et al. Criteria for evaluation of novel markers of cardiovascular risk: a scientific statement from the American Heart Association. Circulation. 2009;119:2408–16. doi: 10.1161/CIRCULATIONAHA.109.192278. [DOI] [PMC free article] [PubMed] [Google Scholar]
- 2.Pepe MS. Problems with risk reclassification methods for evaluating prediction models. Am J Epidemiol. 2011;173:1327–35. doi: 10.1093/aje/kwr013. [DOI] [PMC free article] [PubMed] [Google Scholar]
- 3.Pepe MS, Janes H. Commentary: Reporting standards are needed for evaluations of risk reclassification. Int J Epidemiol. 2011;40:1106–8. doi: 10.1093/ije/dyr083. [DOI] [PMC free article] [PubMed] [Google Scholar]
- 4.Kerr KF, Bansal A, Pepe MS. Further Insight Into the Incremental Value of New Markers: The Interpretation of Performance Measures and the Importance of Clinical Context. Am J Epidemiol. 2012;8 doi: 10.1093/aje/kws210. [DOI] [PMC free article] [PubMed] [Google Scholar]
- 5.Pencina MJ, D'Agostino RB, Sr, D'Agostino RB, Jr, Vasan RS. Evaluating the added predictive ability of a new marker: from area under the ROC curve to reclassification and beyond. Stat Med. 2008;27:157–72. doi: 10.1002/sim.2929. discussion 207-12. [DOI] [PubMed] [Google Scholar]
- 6.Pencina MJ, D'Agostino RB, Sr, Steyerberg EW. Extensions of net reclassification improvement calculations to measure usefulness of new biomarkers. Stat Med. 2011;30:11–21. doi: 10.1002/sim.4085. [DOI] [PMC free article] [PubMed] [Google Scholar]
- 7.Cook NR. Clinically Relevant Measures of Fit? A Note of Caution. Am J Epidemiol. 2012;8 doi: 10.1093/aje/kws208. [DOI] [PMC free article] [PubMed] [Google Scholar]
- 8.Pencina MJ, D'Agostino RB, Pencina KM, Janssens AC, Greenland P. Interpreting Incremental Value of Markers Added to Risk Prediction Models. Am J Epidemiol. 2012;8 doi: 10.1093/aje/kws207. [DOI] [PMC free article] [PubMed] [Google Scholar]
- 9.Pencina MJ, D'Agostino RB, Sr, Demler OV. Novel metrics for evaluating improvement in discrimination: net reclassification and integrated discrimination improvement for normal variables and nested models. Stat Med. 2012;31:101–13. doi: 10.1002/sim.4348. [DOI] [PMC free article] [PubMed] [Google Scholar]
- 10.Cook NR. Use and misuse of the receiver operating characteristic curve in risk prediction. Circulation. 2007;115:928–35. doi: 10.1161/CIRCULATIONAHA.106.672402. [DOI] [PubMed] [Google Scholar]
- 11.Meade MO, Cook DJ, Guyatt GH, et al. Ventilation strategy using low tidal volumes, recruitment maneuvers, and high positive end-expiratory pressure for acute lung injury and acute respiratory distress syndrome: a randomized controlled trial. JAMA. 2008;299:637–45. doi: 10.1001/jama.299.6.637. [DOI] [PubMed] [Google Scholar]
- 12.Cook NR, Ridker PM. Advances in measuring the effect of individual predictors of cardiovascular risk: the role of reclassification measures. Ann Intern Med. 2009;150:795–802. doi: 10.7326/0003-4819-150-11-200906020-00007. [DOI] [PMC free article] [PubMed] [Google Scholar]
- 13.Cook NR, Paynter NP. Performance of Reclassification Statistics in Comparing Risk Prediction Models. Biom J. 2011;53:237–58. doi: 10.1002/bimj.201000078. [DOI] [PMC free article] [PubMed] [Google Scholar]
- 14.Cook NR. Assessing the Incremental Role of Novel and Emerging Risk Factors. Curr Cardiovasc Risk Rep. 2012;4:112–9. doi: 10.1007/s12170-010-0084-x. [DOI] [PMC free article] [PubMed] [Google Scholar]
- 15.Griffin MP, Moorman JR. Toward the early diagnosis of neonatal sepsis and sepsis-like illness using novel heart rate analysis. Pediatrics. 2001;107:97–104. doi: 10.1542/peds.107.1.97. [DOI] [PubMed] [Google Scholar]
- 16.Aghili AA, Rizwan u, Griffin MP, Moorman JR. Scaling and ordering of neonatal heart rate variability. Phys Rev Lett. 1995;74:1254–7. doi: 10.1103/PhysRevLett.74.1254. [DOI] [PubMed] [Google Scholar]
- 17.Nelson JC, Rizwan u, Griffin MP, Moorman JR. Probing the order within neonatal heart rate variability. Pediatr Res. 1998;43:823–31. doi: 10.1203/00006450-199806000-00017. [DOI] [PubMed] [Google Scholar]
- 18.Chang KL, Monahan KJ, Griffin MP, Lake D, Moorman JR. Comparison and clinical application of frequency domain methods in analysis of neonatal heart rate time series. Ann Biomed Eng. 2001;29:764–74. doi: 10.1114/1.1397791. [DOI] [PubMed] [Google Scholar]
- 19.Richman JS, Lake DE, Moorman JR. Sample entropy. Methods Enzymol. 2004;384:172–84. doi: 10.1016/S0076-6879(04)84011-4. [DOI] [PubMed] [Google Scholar]
- 20.Richman JS, Moorman JR. Physiological time series analysis using approximate entropy and sample entropy. American Journal of Physiology. 2000;278:H2039–H49. doi: 10.1152/ajpheart.2000.278.6.H2039. [DOI] [PubMed] [Google Scholar]
- 21.Kovatchev BP, Farhy LS, Cao H, Griffin MP, Lake DE, Moorman JR. Sample asymmetry analysis of heart rate characteristics with application to neonatal sepsis and systemic inflammatory response syndrome. Pediatr Res. 2003;54:892–8. doi: 10.1203/01.PDR.0000088074.97781.4F. [DOI] [PubMed] [Google Scholar]
- 22.Moorman JR, Flower AA, Cao H, Kovatchev BP, Richman JS, Lake DE. Cardiovascular oscillations at the bedside: early diagnosis of neonatal sepsis using heart rate characteristics monitoring. Physiological Measures. 2011;32:1821–32. doi: 10.1088/0967-3334/32/11/S08. [DOI] [PMC free article] [PubMed] [Google Scholar]
- 23.Lake DE, Richman JS, Griffin MP, Moorman JR. Sample entropy analysis of neonatal heart rate variability. American Journal of Physiology. 2002;283:R789–R97. doi: 10.1152/ajpregu.00069.2002. [DOI] [PubMed] [Google Scholar]
- 24.Cao H, Lake DE, Griffin MP, Moorman JR. Increased nonstationarity of neonatal heart rate before the clinical diagnosis of sepsis. Ann Biomed Eng. 2004;32:233–44. doi: 10.1023/b:abme.0000012743.81754.0b. [DOI] [PubMed] [Google Scholar]
- 25.Flower AA, Moorman JR, Lake DE, Delos JB. Dynamical theory of periodic heart rate decelerations in premature infants. Experimental Medicine and Biology. 2010;235:531–8. doi: 10.1258/ebm.2010.009336. [DOI] [PMC free article] [PubMed] [Google Scholar]
- 26.Xiao Y, Griffin P, Lake DE, Moorman JR. Nearest-neighbor and logistic regression analyses of clinical and heart rate characteristics in the early diagnosis of neonatal sepsis. Med Decis Making. 2009;30:258–66. doi: 10.1177/0272989X09337791. [DOI] [PMC free article] [PubMed] [Google Scholar]
- 27.Griffin MP, Scollan DF, Moorman JR. The dynamic range of neonatal heart rate variability. J Cardiovasc Electrophysiol. 1994;5:112–24. doi: 10.1111/j.1540-8167.1994.tb01151.x. [DOI] [PubMed] [Google Scholar]
- 28.Griffin MP, O'Shea TM, Bissonette EA, Harrell FE, Jr, Lake DE, Moorman JR. Abnormal heart rate characteristics preceding neonatal sepsis and sepsis-like illness. Pediatr Res. 2003;53:920–6. doi: 10.1203/01.PDR.0000064904.05313.D2. [DOI] [PubMed] [Google Scholar]
- 29.Griffin MP, Lake DE, Moorman JR. Heart rate characteristics and laboratory tests in neonatal sepsis. Pediatrics. 2005;115:937–41. doi: 10.1542/peds.2004-1393. [DOI] [PubMed] [Google Scholar]
- 30.Griffin MP, Lake D, Moorman JR. Heart rate characteristics and clinical signs in neonatal sepsis. Pediatric Research. 2007;61:222–7. doi: 10.1203/01.pdr.0000252438.65759.af. [DOI] [PubMed] [Google Scholar]
- 31.Addison K, Griffin MP, Moorman JR, Lake DE, O'Shea TM. Heart rate characteristics and neurodevelopmental outcome in very low birth weight infants. J Perinatol. 2009;29:750–6. doi: 10.1038/jp.2009.81. [DOI] [PMC free article] [PubMed] [Google Scholar]
- 32.Stone ML, Tatum PM, Weitkamp JH, et al. Abnormal heart rate characteristics before clinical diagnosis of necrotizing enterocolitis. J Perinatol. 2013;30:63. doi: 10.1038/jp.2013.63. [DOI] [PMC free article] [PubMed] [Google Scholar]
- 33.Griffin MP, O'Shea TM, Bissonette EA, Harrell FE, Jr, Lake DE, Moorman JR. Abnormal heart rate characteristics are associated with neonatal mortality. Pediatr Res. 2004;55:782–8. doi: 10.1203/01.PDR.0000119366.21770.9E. [DOI] [PubMed] [Google Scholar]
- 34.Moorman JR, Carlo WA, Kattwinkel J, et al. Mortality reduction by heart rate characteristics monitoring in very low birthweight neonates: a randomized trial. Journal of Pediatrics. 2011;159:900–6. doi: 10.1016/j.jpeds.2011.06.044. [DOI] [PMC free article] [PubMed] [Google Scholar]
- 35.Saria S, Rajani AK, Gould J, Koller D, Penn AA. Integration of early physiological responses predicts later illness severity in preterm infants. Sci Transl Med. 2010;2:48ra65. doi: 10.1126/scitranslmed.3001304. [DOI] [PMC free article] [PubMed] [Google Scholar]
- 36.Politano AD, Riccio LM, Lake DE, et al. Predicting the need for urgent intubation in a surgical/trauma intensive care unit. Surgery. 2013;25:00270–5. doi: 10.1016/j.surg.2013.05.025. [DOI] [PMC free article] [PubMed] [Google Scholar]
- 37.Moorman JR, Lake DE, Griffin MP. Heart rate characteristics monitoring in neonatal sepsis. IEEE Transactions in Biomedical Engineering. 2006;53:126–32. doi: 10.1109/TBME.2005.859810. [DOI] [PubMed] [Google Scholar]
- 38.Griffin MP, Lake DE, Bissonette EA, Harrell FE, Jr, O'Shea TM, Moorman JR. Heart rate characteristics: novel physiomarkers to predict neonatal infection and death. Pediatrics. 2005;116:1070–4. doi: 10.1542/peds.2004-2461. [DOI] [PubMed] [Google Scholar]
- 39.Pepe MS, Feng Z, Huang Y, et al. Integrating the predictiveness of a marker with its performance as a classifier. Am J Epidemiol. 2008;167:362–8. doi: 10.1093/aje/kwm305. [DOI] [PMC free article] [PubMed] [Google Scholar]
- 40.Griffin MP, Lake DE, Moorman JR. Heart rate characteristics and laboratory tests in neonatal sepsis. Pediatrics. 2005;115:937–41. doi: 10.1542/peds.2004-1393. [DOI] [PubMed] [Google Scholar]
- 41.Griffin MP, Lake DE, O'Shea TM, Moorman JR. Heart rate characteristics and clinical signs in neonatal sepsis. Pediatr Res. 2007;61:222–7. doi: 10.1203/01.pdr.0000252438.65759.af. [DOI] [PubMed] [Google Scholar]
- 42.Fairchild KD, Schelonka RL, Kaufman DA, et al. Septicemia mortality reduction in neonates in a heart rate characteristics monitoring trial. Pediatr Res. 2013;13:136. doi: 10.1038/pr.2013.136. [DOI] [PMC free article] [PubMed] [Google Scholar]
- 43.Harrell FE., Jr . Regression modeling strategies: with applications to linear models, logistic regression and survival analysis. Berlin: Springer; 2001. [Google Scholar]
- 44.Stoll BJ, Hansen N, Fanaroff AA, et al. Late-onset sepsis in very low birth weight neonates: the experience of the NICHD Neonatal Research Network. Pediatrics. 2002;110:285–91. doi: 10.1542/peds.110.2.285. [DOI] [PubMed] [Google Scholar]
- 45.McGregor C, James A, Eklund M, Sow D, Ebling M, Blount M. Real-time Multidimensional Temporal Analysis of Complex High Volume Physiological Data Streams in the Neonatal Intensive Care Unit. Stud Health Technol Inform. 2013;192:362–6. [PubMed] [Google Scholar]
- 46.Bravi A, Green G, Longtin A, Seely AJ. Monitoring and identification of sepsis development through a composite measure of heart rate variability. PLoS One. 2012;7:e45666. doi: 10.1371/journal.pone.0045666. [DOI] [PMC free article] [PubMed] [Google Scholar]
- 47.Seely AJ, Green GC, Bravi A. Continuous Multiorgan Variability monitoring in critically ill patients--complexity science at the bedside. Conf Proc IEEE Eng Med Biol Soc. 2011;2011:5503–6. doi: 10.1109/IEMBS.2011.6091404. [DOI] [PubMed] [Google Scholar]
- 48.Buchan CA, Bravi A, Seely AJ. Variability analysis and the diagnosis, management, and treatment of sepsis. Curr Infect Dis Rep. 2012;14:512–21. doi: 10.1007/s11908-012-0282-4. [DOI] [PubMed] [Google Scholar]
- 49.Hu X, Sapo M, Nenov V, et al. Predictive combinations of monitor alarms preceding in-hospital code blue events. J Biomed Inform. 2012;45:913–21. doi: 10.1016/j.jbi.2012.03.001. [DOI] [PubMed] [Google Scholar]
- 50.Scalzo F, Hu X. Semi-supervised detection of intracranial pressure alarms using waveform dynamics. Physiol Meas. 2013;34:465–78. doi: 10.1088/0967-3334/34/4/465. [DOI] [PubMed] [Google Scholar]