Abstract
This study describes a population pharmacokinetic meta-analysis of propofol to characterize the influence of body size measures and age in morbidly obese and nonobese adults, adolescents, and children. Sixty morbidly obese and nonobese adult patients (55–167 kg; 21–79 years) and 34 morbidly obese and nonobese adolescents and children (37–184 kg; 9–20 years) were included. The results show that clearance increased with total body weight in an allometric function while age was found to influence clearance in a bilinear fashion with two distinct slopes, reflecting an initial increase and subsequent decrease as a result of aging. Using these two functions, the influence of both (over)weight and age on propofol clearance was well characterized, which may provide a basis for dosing across this diverse group of patients.
Background
Although total body weight (TBW) of children and adolescents increases due to growth-related processes across childhood, obesity may also substantially contribute to increases in body weight.1 As a result, morbidly obese children and adolescents may be as heavy as adults, even though growth-related processes have not yet been completed. The question then arises whether TBW, which is commonly used to adjust dosing in children and adolescents, is the appropriate measure to adjust doses of drugs in obese children and adolescents. Similarly for adults, there is a lively discussion about the best size descriptor for changes in pharmacokinetics due to obesity.2,3 As little is known on how key pharmacokinetic parameters such as clearance change in morbidly obese children, adolescents, and adults as compared with their nonobese controls, studies are needed analyzing a wide range of ages and related TBWs.
Propofol is widely used for induction and maintenance of anesthesia in both nonobese and (morbidly) obese adults, adolescents, and children. Recently, the pharmacokinetics of propofol have been compared in premature neonates and adults,4 in morbidly obese and obese adults,5,6 and in (morbidly) obese children and adolescents.7 In all these studies, TBW proved the most predictive covariate for clearance, either by using a standard allometric function5,6,7 or a TBW-dependent exponent allometric function.4 However, a meta-analysis on the basis of all data sets in morbidly obese adults, adolescents, and children together with their nonobese controls in which the influence of obesity and ageing is disentangled has not been performed.
Therefore, the aim of this study was to perform a population pharmacokinetic meta-analysis of propofol combining data from morbidly obese and nonobese adults, adolescents, and children. To study how obesity and age influence pharmacokinetic parameter estimates in this diverse patient group, specific emphasis was placed on the evaluation of the influence of TBW, body mass index, ideal body weight,8 lean body weight (LBW),9,10 and/or age on the different pharmacokinetic parameters.
Results
Subjects
Ninety-four adults, adolescents, and children with a mean TBW of 94 kg (range: 37–184 kg) were included from which 1,652 concentration measurements were available. Demographic characteristics of the morbidly obese and nonobese patients are summarized in Table 1.
Table 1. Baseline characteristics of all morbidly obese and nonobese adults, adolescents, and children included in the current analysis.

Pharmacokinetics
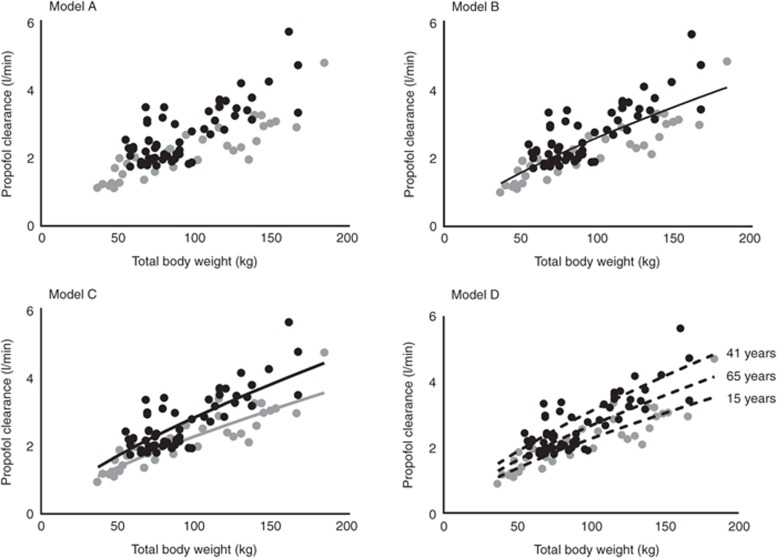
A three-compartment pharmacokinetic model adequately described the time course of the propofol whole-blood concentrations in all morbidly obese and nonobese adults, adolescents, and children. Exploratory plots of the tested covariates TBW, body mass index, ideal body weight, LBW, and age against individual post hoc parameter estimates of the simple model without covariates (model A) showed a potential relation between clearance and TBW, with lower values for children and adolescents across the entire body weight range (Figure 1, model A). In addition, potential relationships were observed between central volume of distribution (V1) and TBW or LBW, and between intercompartmental clearance from the central to the second peripheral compartment (Q3) and TBW (figures not shown). There were no visual trends between the explored covariates and other pharmacokinetic parameters in the simple model without covariates (model A).
Figure 1.
Individual post hoc propofol clearance estimates vs. total body weight for the simple model (model A) and three covariate pharmacokinetic models (B, C, and D) for morbidly obese adults (black circles), adolescents and children (gray circles) and their nonobese controls (n = 94). In model B, the black line indicates the population clearance values for both the adult and adolescent population; in model C, the black line indicates the population clearance values for adults and the gray line the population clearance values for adolescents; and in model D, the black dotted lines indicate the population clearance values for 15, 41, and 65 years.
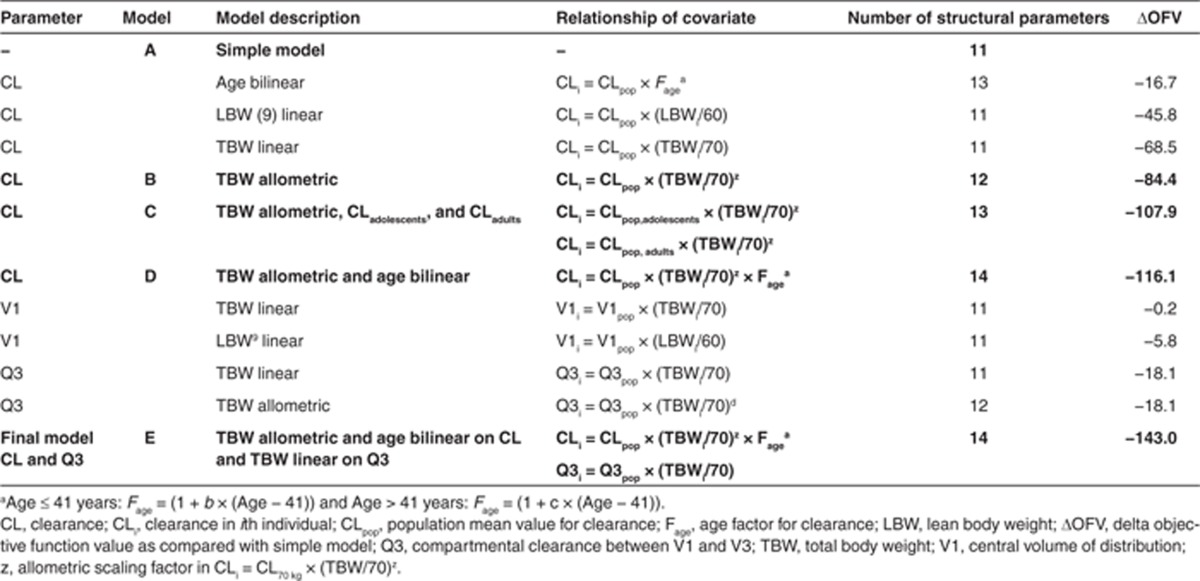
Subsequently, as depicted in Table 2, all body size measures and age were separately incorporated on clearance, V1, and Q3 in the model and tested for significance (see section Covariate analysis). The analysis showed that TBW was the most predictive covariate for propofol clearance when implemented using an allometric function (model B, decrease in objective function value (OFV) of 84.4 points; P < 0.001; Table 2). Figure 1 model B (and model A) shows that adolescents with the same TBW as adults had lower clearance values (gray vs. black symbols, respectively). Therefore, in model C, a separate value for propofol clearance in adolescents vs. adults was estimated. This resulted in another reduction in OFV by 23.5 points (P < 0.001) with individual clearance values for an adolescent of 70 kg and an adult of 70 kg of 1.75 ml/min and 2.18 ml/min, respectively (Table 2, Model C). The nonlinear increase of propofol clearance with TBW proved the same for both groups and was best described using an allometric function with an estimated exponent of 0.73 (coefficients of variation percentage: 6.9) (Figure 1, Model C).
Table 2. Results of covariate analysis for the three-compartment pharmacokinetic model of propofol in the combined data set of morbidly obese and nonobese adults, adolescents, and children.
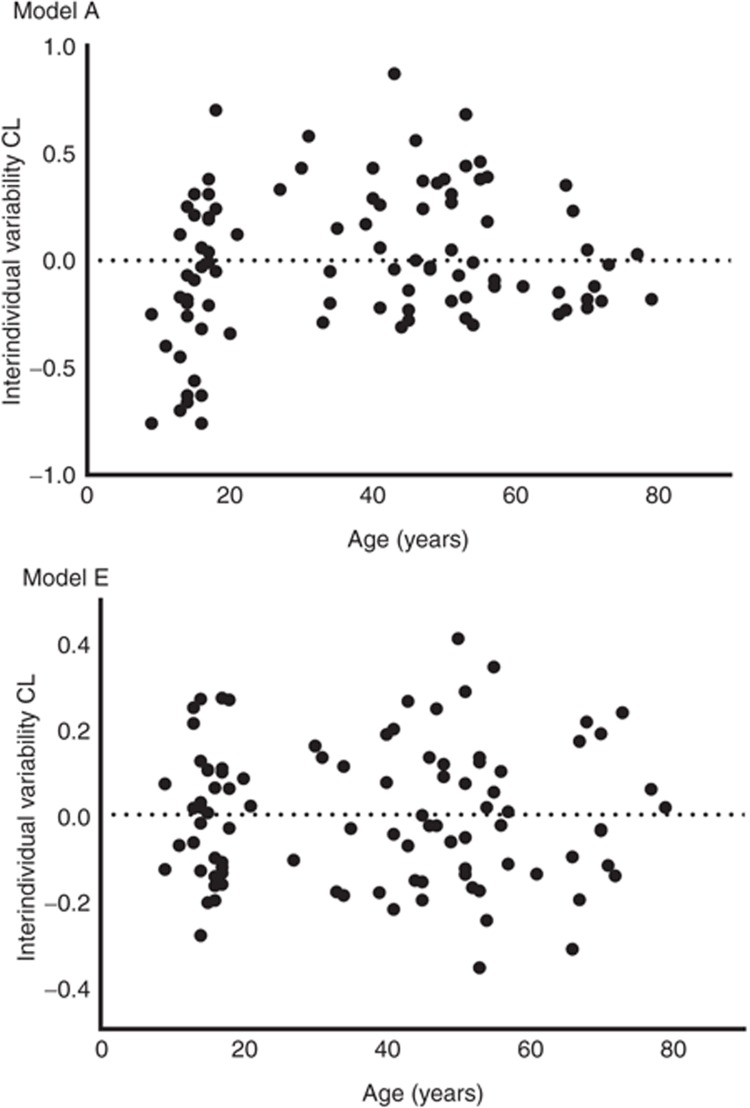
However, when the simple model without covariates was evaluated for the effect of age (Figure 2, model A), it was found that clearance increased until the median age of 41 years after which it decreased. As a result, instead of estimation of two different population values for adolescents vs. adults as in model C, in model D, age was implemented using a bilinear function which significantly reduced the OFV (ΔOFV as compared with model C = −8.2 points; P < 0.005). On the basis of the covariates of model D, the interindividual variability of propofol clearance was reduced by 50%. Figure 2 model E shows that after implementation of age in a bilinear function, interindividual variability was randomly distributed with age. Figure 1, model D shows the post hoc propofol clearance estimates for model D vs. TBW with population predictions for clearance for three different ages (15, 41, and 65 years), illustrating the bilinear relation with age in model D. The final equation for propofol clearance was given as follows (Eq. 1):
 |
Figure 2.
Interindividual variability of propofol clearance vs. age for the simple model without covariates (model A) and the final covariate model including age and total body weight on propofol clearance (model E).
where CLi represents clearance in the ith individual, CLpop is the population mean value for clearance in an individual of 70 kg and of 41 years, TBWi is the TBW of the ith individual, and 70 is the standard body weight in kilograms.
Concerning covariates for V1, Table 2 shows that there was only a modest influence of the body size descriptors on V1 with a trend toward an increase in V1 with LBW (P > 0.005). There was a substantial shrinkage (43%) on V1, which not only renders plots using post hoc parameter estimates less reliable but also indicates that the individual data in the data sets are not rich in information about this parameter.11 Therefore, no covariate on V1 was incorporated in the final model. By contrast, TBW as covariate for Q3 significantly improved the model (ΔOFV = −18.1; P < 0.005; Table 2) and was therefore considered the final model (Table 2, model E). There was no influence of the explored covariates on the other pharmacokinetic parameters (Q2 and V2).
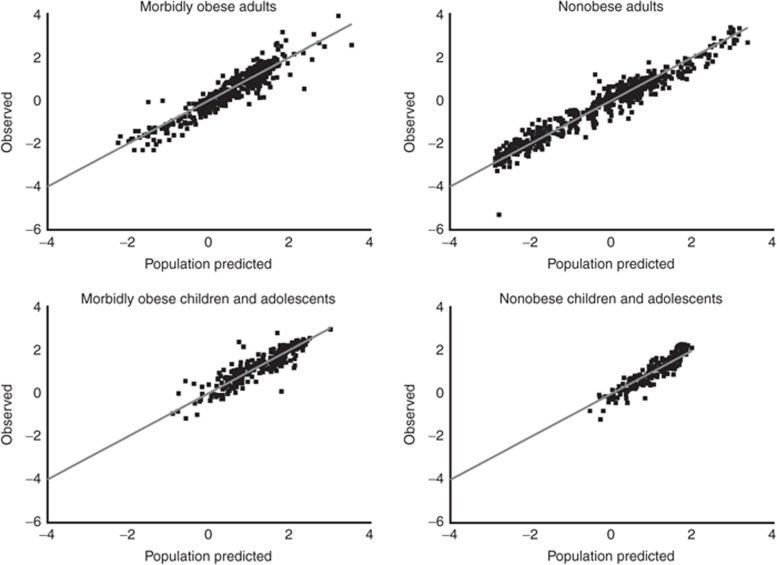
Table 3 lists all parameter estimates including their coefficient of variation values and OFVs of the simple model (model A) and the final model (model E). The observed vs. population-predicted plots stratified by the different cohorts in Figure 3 confirm that the final model describes not only the study population as a whole but also the individual study populations without bias. The stability of the final model was shown by the bootstrap analysis (Table 3).
Table 3. Population pharmacokinetic parameter estimates for the simple and the final pharmacokinetic model for propofol in nonobese and (morbidly) obese children, adolescents, and adults including the bootstrap values of the final model.
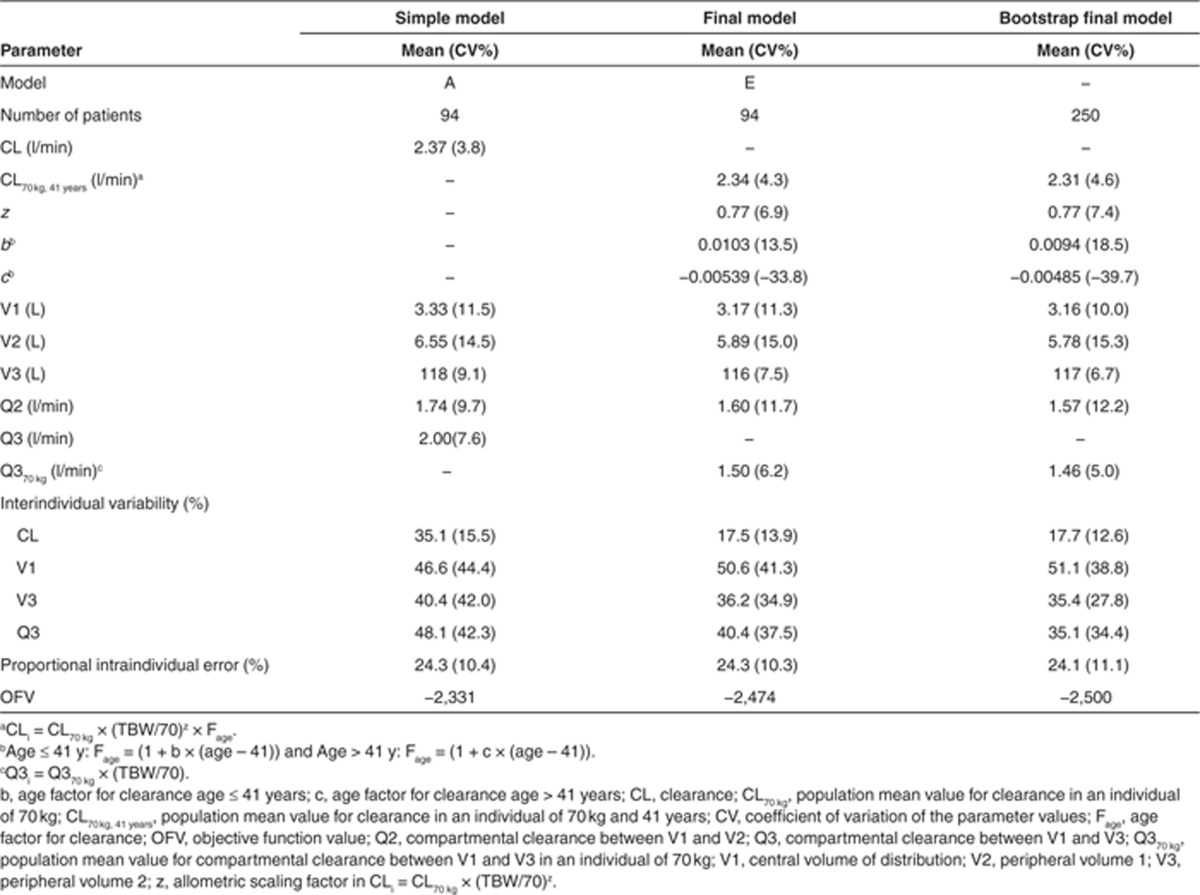
Figure 3.
Observed vs. population-predicted ln propofol concentrations of the final model (model E). Panels represent data of morbidly obese adults, nonobese adults, morbidly obese children and adolescents, and nonobese children and adolescents. The solid gray line represents the line of identity, x = y.
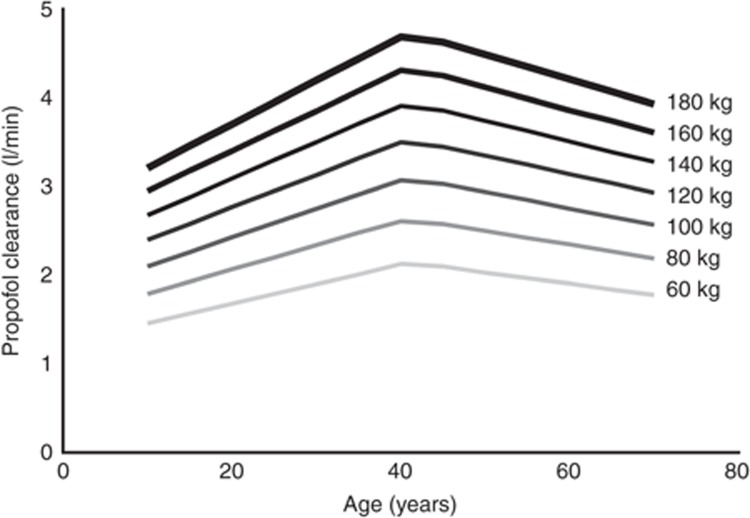
Figure 4 shows population propofol clearance values vs. age for different TBWs using the final model (model E). This figure shows both the allometric increase of propofol clearance with TBW as the distance between the weight classes decreases with increasing TBW, and the bilinear relationship of propofol clearance with age.
Figure 4.
Model-based predictions of population clearance estimates of propofol vs. age for patients with different total body weights.
Discussion
To describe the influence of obesity and age on the pharmacokinetics of propofol, a population pharmacokinetic meta-analysis was performed using data from morbidly obese adults, adolescents, and children and their nonobese controls. In this study, a wide range of TBW (37–184 kg) and age (9–79 years) was studied, with data from (morbidly) obese and nonobese individuals in each age range. The results of the systematic analysis shows that a combination of TBW and age proved to best capture changes in propofol clearance as a result of obesity and ageing. Although it is yet unknown how these results should be put in physiological perspective, the current model seems to provide the best description of the data from these largely divergent patient populations.
In recent reports in (morbidly) obese adults, it was shown that the increase in propofol clearance was related to TBW and could be best described using an allometric function.5,6 In addition, an allometric relationship between TBW and propofol clearance was found in a data set of morbidly obese adolescents (7). Allometric scaling factors of 0.72 (ref. 6) and 0.80 ref. 7 were estimated for morbidly obese adults and children and adolescents, respectively. As these factors are close to the factor of 0.75 predicted by allometry theory,12 this implies that obese individuals can be viewed as “large individuals” (a different body size) instead of individuals “having excess body fat” (a different body composition).2 Although these results were confirmed in the current meta-pharmacokinetic analysis, we also showed that morbidly obese adolescents cannot be viewed as “adults” as their propofol clearance proved lower than that of morbidly obese adults with the same TBW (Figure 1, model A). This difference in propofol clearance could be described with two separate functions for propofol clearance; i.e., one equation for children and adolescents and one equation for adults (model C). Alternatively and significantly better, age was incorporated as covariate on propofol clearance using a bilinear function (models D and E). Therefore, in the final model, the influence of age and obesity on propofol clearance was described using both TBW and age as covariates for propofol clearance. This final equation (Eq. 1) is independent of the definitions for age (e.g., adolescents and adults) and obesity (e.g., obese and morbidly obese) categories and might prove useful for clinical practice.
In this study, there was no significant relationship between body size measures and volumes of distribution. Previously, age and TBW have been identified as covariates for volumes of distribution of propofol in nonobese and obese patients.5,13,14 As a result of the finding that LBW correlated with V1, Ingrande et al.15 suggested to use LBW for the induction of anesthesia with propofol. The lack of significant influence of LBW on volume of distribution in our analysis may be explained by the fact that the studies included in the current analysis mainly contained observations following propofol maintenance infusions. As such, these data sets did not contain sufficient observations just after the induction bolus dose of propofol to adequately describe early (re-)distribution and the influence of covariates on volumes of distribution. It therefore seems that additional research is needed to characterize covariates predictive of volume of distribution that will allow estimation of propofol-loading doses in morbidly obese adults and children.
This study had a few limitations. We investigated a cohort of children and adolescents with a lower age limit of 9 years. In clinical practice, propofol is administrated to even younger children, and therefore, more research is needed to investigate if the current findings are also applicable for children younger than 9 years. In addition, the pharmacodynamics of propofol were not included in the current analysis. Obesity influenced the pharmacodynamics of propofol in children and adolescents using propofol.16 Underlying diseases such as diabetes and a changed (patho)physiology in (morbidly) obese patients may also influence the pharmacodynamics of propofol.17 To develop dosing algorithm for propofol in morbidly obese adults, children, and adolescents, an integrated pharmokinetic and pharmacodynamic meta-analysis is urgently needed.
It remains to be speculated how the influence of TBW on propofol clearance that was found in our study can be explained. Studies have shown that obese patients suffer from low-grade inflammation,18 which is probably the underlying cause of the high prevalence of nonalcoholic steatohepatitis.19 It is known that nonalcoholic steatohepatitis increases fat deposition in the liver causing sinusoidal narrowing and altered functional morphology of the liver.20 By contrast, because of increased blood volume and cardiac output, hepatic blood flow is possibly increased in obese subjects.21 As a result, increased propofol clearance may be anticipated as propofol is a high extraction ratio drug22 mainly metabolized by various UDP-glucuronosyltransferase enzymes.23 Data on other high-extraction drugs and drugs metabolized by UDP-glucuronosyltransferase suggest that both UDP-glucuronosyltransferase activity24,25,26 and liver blood flow27,28 are increased in obese adults. Furthermore, UDP-glucuronosyltransferase activity is increased in obese adolescents as compared with nonobese adolescents.29 Even though this cannot be proven, it can be hypothesized that hepatic blood flow is even more increased due to prolonged duration of obesity in adults as compared with adolescents with the same TBW. This is supported by the fact that age could be incorporated as a covariate on propofol clearance. As propofol clearance is limited by the blood flow through the liver, the effect of both TBW and age on propofol may be explained by changes in liver blood flow.
In this pharmacokinetic meta-analysis, we developed a model for scaling propofol clearance over wide ranges of TBW and age using data from morbidly obese adults, adolescents, and children and their nonobese controls. The results show that TBW was the most predictive covariate for propofol clearance among patients when implemented as an allometric function. In addition, age was incorporated using a bilinear function with two distinct slopes, reflecting an initial increase and subsequent decrease in clearance as a result of age. Using these two functions, the influence of both (over)weight and age on propofol clearance was well characterized, which may provide a basis for dosing across this diverse group of patients.
Methods
Patients. Data of five previously published studies were used for this analysis.6,7,30,31,32 Patient characteristics of the five different studies are provided in Table 1. Details of the studies are briefly summarized when relevant to the current analysis.
Morbidly obese adults. Twenty morbidly obese adults scheduled for bariatric surgery with a mean TBW of 124 kg (range: 98–167 kg) received either a propofol induction dose of 200 or 350 mg. Maintenance propofol infusion rate was initiated at 10 mg/kg times TBW/h and adjusted to keep Bispectral index values between 40 and 60. Remifentanil continuous infusion was administrated 25 µg/h/kg based on ideal body weight. Multiple blood samples were collected before the start of the propofol bolus until 150 min after the end of the infusion.6
Nonobese adults. Forty nonobese adults with a mean TBW of 74 kg (range: 55–98 kg) were included. Twenty-four female patients received a bolus injection of 2.5 mg/kg of propofol for induction of anesthesia while anesthesia was maintained with isoflurane. Following onset of unconsciousness, fentanyl (0.003–0.005 mg/kg) was administrated and as required additional amounts of 50–100 mg. Blood samples were collected from 1 min until 180 min after the induction dose of propofol.30 Of these 24 patients, only 20 patients were in this study because height measure of 4 patients was not available. Another 20 nonobese intensive care patients received continuous propofol infusions for 2–5 days with propofol doses based on the Ramsay six-point-scale morphine administration as an analgesic was given when the patient was considered to be in pain (seven patients; each patient received morphine as a continuous infusion of 40–50 mg/day). Blood samples were collected four times daily during propofol maintenance infusion for 2–5 days.31
Morbidly obese children and adolescents. In 20 morbidly obese adolescents and children scheduled for bariatric surgery with mean TBW of 125 kg (range: 70–184 kg) and mean age of 16 years (range: 9–18 years), propofol was administered using dosing weight calculated according to the method of Servin et al. Fentanyl 100 µg was administered just after the induction, and 50 µg doses were administered in case of inadequate analgesia. Blood samples were collected before the start of the propofol infusion and from 15 min after the start of infusion until 120 min after the end of the infusion.7
Nonobese children and adolescents. In 14 nonobese adolescents and children with mean TBW of 54 kg (range: 37–82 kg) and a mean age of 14 years (range: 9–20 years), anesthesia was induced with a bolus dose of propofol (4 mg/kg) and maintained with propofol by continuous infusion (2–10 mg/kg/h) and remifentanil (0.2–1 µg/kg/min) for scoliosis surgery. Blood samples were taken before induction of anesthesia, and at ~15 or 30 min after the start of propofol infusion until 120 min after the end of the infusion.32
Data analysis and internal validation. The analysis was performed by means of nonlinear mixed-effects modeling using NONMEM (version VI, release 1.1; GloboMax LLC, Hanover, MD)33 with S-plus (version 6.2; Insightful Software, Seattle, WA) to visualize the data. Discrimination between different models was made by comparison of the OFV (−2 log likelihood (OVF)). A value of P < 0.05, representing a decrease of 3.8 in the OVF, was considered statistically significant. In addition, goodness-of-fit plots (observed vs. individually predicted, observed vs. population predicted, conditional weighted residuals vs. time, and conditional weighted residuals vs. population predictions) were used for diagnostic purposes. Furthermore, the confidence interval of the parameter estimates, the correlation matrix, and visual improvement of the individual plots were used to evaluate the model. η-shrinkage as defined by Karlsson et al.34 was calculated for all model parameters for which interindividual variability was estimated. The internal validity of the population pharmacokinetic models was assessed by a per-study stratified bootstrap resampling method using 250 replicates.33 Validation using external data sets was not part of the current analysis.
Pharmacokinetic model. Log-transformed propofol concentration data were described by a three-compartment model (NONMEM VI, ADVAN11, and TRANS4) parameterized in terms of volume of distribution of the central (V1), first (V2), and second peripheral compartments (V3), intercompartmental clearance from the central to the first peripheral compartment (Q2) and from the central to the second peripheral compartment (Q3), and clearance from the central compartment (CL).
The interindividual value (post hoc value) of the parameters of the ith subject was modeled by the following formula:
where θmean is the population mean and ηi is a random variable with mean zero and variance ω2, assuming lognormal distribution in the population.
The intraindividual variability, resulting from assay errors, model misspecifications, and other unexplained sources, was best described with a proportional error model. This means for the jth observed log-transformed propofol concentration of the ith individual, the relation (Yij):
where cpred is the predicted propofol concentration and εij is the random variable with mean zero and variance σ2.
Covariate analysis. Covariates were plotted independently against the individual post hoc parameter estimates of all pharmacokinetic parameters and the conditioned weighted residuals to visualize potential relations. The following covariates were tested: TBW, body mass index, ideal body weight8 and LBW,9,10 gender, and age. Covariates were tested using linear and power equations:
 |
where Pi and Pp represent individual and population parameter estimates, respectively, Cov represents the covariate, and Covstandard represents a standardized (i.e., 70 kg for TBW) or median value of the covariate for the population. z represents the scaling factor, which was fixed to 1 for a linear function or an estimated value for a power equation.
The influence of the covariate age on clearance was also tested using a bilinear function with two distinct slopes, i.e., a linear increase in clearance for age values below the median age and a linear decrease in clearance for age values higher than the median age35 (Eq. 5).
 |
Potential covariates were separately entered into the model and statistically tested by use of the OFV and if applicable the 95% confidence interval of the additional parameter. A P < 0.005 was applied to evaluate the covariates in the forward inclusion (OFV decrease > 7.9), whereas the backward deletion procedure used a stricter criterion (OFV decrease > 10.8; P < 0.001). When more than one significant covariate for the simple model was found, the covariate-adjusted model with the largest decrease in objection function was chosen as a basis to sequentially explore the influence of additional covariates using the same criteria. Finally, after forward inclusion, a backward exclusion procedure was applied to justify the covariate. The choice of the covariate model was further evaluated as discussed under the section Data analysis and internal validation.
Author contributions
J.D., V.C., S.S., B.v.R., E.P.A.v.D., A.A.V., and C.A.J.K. wrote the manuscript. J.D., V.C., S.S., H.J.B.v.O-A., T.I., B.v.R., E.P.A.v.D., A.A.V., and C.A.J.K. designed the research. J.D., V.C., S.S., H.J.B.v.O-A., T.I., and E.P.A.v.D. performed the research. J.D., A.A.V., and C.A.J.K. analyzed the data.
Conflict of interest
The authors declared no conflict of interest.
Study Highlights
References
- Ogden C.L., Carroll M.D., Curtin L.R., Lamb M.M., Flegal K.M. Prevalence of high body mass index in US children and adolescents, 2007-2008. JAMA. 2010;303:242–249. doi: 10.1001/jama.2009.2012. [DOI] [PubMed] [Google Scholar]
- Eleveld D.J., Proost J.H., Absalom A.R., Struys M.M. Obesity and allometric scaling of pharmacokinetics. Clin. Pharmacokinet. 2011;50:751–753; discussion 755. doi: 10.2165/11594080-000000000-00000. [DOI] [PubMed] [Google Scholar]
- Han P.Y., Duffull S.B., Kirkpatrick C.M., Green B. Dosing in obesity: a simple solution to a big problem. Clin. Pharmacol. Ther. 2007;82:505–508. doi: 10.1038/sj.clpt.6100381. [DOI] [PubMed] [Google Scholar]
- Wang C., et al. A bodyweight-dependent allometric exponent for scaling clearance across the human life-span. Pharm. Res. 2012;29:1570–1581. doi: 10.1007/s11095-012-0668-x. [DOI] [PMC free article] [PubMed] [Google Scholar]
- Cortínez L.I., et al. Influence of obesity on propofol pharmacokinetics: derivation of a pharmacokinetic model. Br. J. Anaesth. 2010;105:448–456. doi: 10.1093/bja/aeq195. [DOI] [PubMed] [Google Scholar]
- van Kralingen S., et al. Population pharmacokinetics and pharmacodynamics of propofol in morbidly obese patients. Clin. Pharmacokinet. 2011;50:739–750. doi: 10.2165/11592890-000000000-00000. [DOI] [PubMed] [Google Scholar]
- Diepstraten J., et al. Propofol clearance in morbidly obese children and adolescents: influence of age and body size. Clin. Pharmacokinet. 2012;51:543–551. doi: 10.1007/BF03261930. [DOI] [PubMed] [Google Scholar]
- Pai M.P., Paloucek F.P. The origin of the “ideal” body weight equations. Ann. Pharmacother. 2000;34:1066–1069. doi: 10.1345/aph.19381. [DOI] [PubMed] [Google Scholar]
- Janmahasatian S., Duffull S.B., Ash S., Ward L.C., Byrne N.M., Green B. Quantification of lean bodyweight. Clin. Pharmacokinet. 2005;44:1051–1065. doi: 10.2165/00003088-200544100-00004. [DOI] [PubMed] [Google Scholar]
- Peters A.M., Snelling H.L., Glass D.M., Bird N.J. Estimation of lean body mass in children. Br. J. Anaesth. 2011;106:719–723. doi: 10.1093/bja/aer057. [DOI] [PubMed] [Google Scholar]
- Savic R.M., Karlsson M.O. Importance of shrinkage in empirical bayes estimates for diagnostics: problems and solutions. AAPS J. 2009;11:558–569. doi: 10.1208/s12248-009-9133-0. [DOI] [PMC free article] [PubMed] [Google Scholar]
- Anderson B.J., Holford N.H. Mechanism-based concepts of size and maturity in pharmacokinetics. Annu. Rev. Pharmacol. Toxicol. 2008;48:303–332. doi: 10.1146/annurev.pharmtox.48.113006.094708. [DOI] [PubMed] [Google Scholar]
- Schüttler J., Ihmsen H. Population pharmacokinetics of propofol: a multicenter study. Anesthesiology. 2000;92:727–738. doi: 10.1097/00000542-200003000-00017. [DOI] [PubMed] [Google Scholar]
- Servin F., Farinotti R., Haberer J.P., Desmonts J.M. Propofol infusion for maintenance of anesthesia in morbidly obese patients receiving nitrous oxide. A clinical and pharmacokinetic study. Anesthesiology. 1993;78:657–665. doi: 10.1097/00000542-199304000-00008. [DOI] [PubMed] [Google Scholar]
- Ingrande J., Brodsky J.B., Lemmens H.J. Lean body weight scalar for the anesthetic induction dose of propofol in morbidly obese subjects. Anesth. Analg. 2011;113:57–62. doi: 10.1213/ANE.0b013e3181f6d9c0. [DOI] [PubMed] [Google Scholar]
- Olutoye O.A., et al. The effect of obesity on the ED(95) of propofol for loss of consciousness in children and adolescents. Anesth. Analg. 2012;115:147–153. doi: 10.1213/ANE.0b013e318256858f. [DOI] [PubMed] [Google Scholar]
- Adams J.P., Murphy P.G. Obesity in anaesthesia and intensive care. Br. J. Anaesth. 2000;85:91–108. doi: 10.1093/bja/85.1.91. [DOI] [PubMed] [Google Scholar]
- Wellen K.E., Hotamisligil G.S. Inflammation, stress, and diabetes. J. Clin. Invest. 2005;115:1111–1119. doi: 10.1172/JCI25102. [DOI] [PMC free article] [PubMed] [Google Scholar]
- Guzzaloni G., Grugni G., Minocci A., Moro D., Morabito F. Liver steatosis in juvenile obesity: correlations with lipid profile, hepatic biochemical parameters and glycemic and insulinemic responses to an oral glucose tolerance test. Int. J. Obes. Relat. Metab. Disord. 2000;24:772–776. doi: 10.1038/sj.ijo.0801224. [DOI] [PubMed] [Google Scholar]
- Farrell G.C., Teoh N.C., McCuskey R.S. Hepatic microcirculation in fatty liver disease. Anat. Rec. (Hoboken) 2008;291:684–692. doi: 10.1002/ar.20715. [DOI] [PubMed] [Google Scholar]
- Casati A., Putzu M. Anesthesia in the obese patient: pharmacokinetic considerations. J. Clin. Anesth. 2005;17:134–145. doi: 10.1016/j.jclinane.2004.01.009. [DOI] [PubMed] [Google Scholar]
- Al-Jahdari W.S., Yamamoto K., Hiraoka H., Nakamura K., Goto F., Horiuchi R. Prediction of total propofol clearance based on enzyme activities in microsomes from human kidney and liver. Eur. J. Clin. Pharmacol. 2006;62:527–533. doi: 10.1007/s00228-006-0130-2. [DOI] [PubMed] [Google Scholar]
- Kiang T.K., Ensom M.H., Chang T.K. UDP-glucuronosyltransferases and clinical drug-drug interactions. Pharmacol. Ther. 2005;106:97–132. doi: 10.1016/j.pharmthera.2004.10.013. [DOI] [PubMed] [Google Scholar]
- Abernethy D.R., Divoll M., Greenblatt D.J., Ameer B. Obesity, sex, and acetaminophen disposition. Clin. Pharmacol. Ther. 1982;31:783–790. doi: 10.1038/clpt.1982.111. [DOI] [PubMed] [Google Scholar]
- Van Wart S., et al. Population pharmacokinetics and pharmacodynamics of garenoxacin in patients with community-acquired respiratory tract infections. Antimicrob. Agents Chemother. 2004;48:4766–4777. doi: 10.1128/AAC.48.12.4766-4777.2004. [DOI] [PMC free article] [PubMed] [Google Scholar]
- Abernethy D.R., Greenblatt D.J., Divoll M., Shader R.I. Enhanced glucuronide conjugation of drugs in obesity: studies of lorazepam, oxazepam, and acetaminophen. J. Lab. Clin. Med. 1983;101:873–880. [PubMed] [Google Scholar]
- Sparreboom A., et al. Evaluation of alternate size descriptors for dose calculation of anticancer drugs in the obese. J. Clin. Oncol. 2007;25:4707–4713. doi: 10.1200/JCO.2007.11.2938. [DOI] [PubMed] [Google Scholar]
- Schwartz A.E., Matteo R.S., Ornstein E., Young W.L., Myers K.J. Pharmacokinetics of sufentanil in obese patients. Anesth. Analg. 1991;73:790–793. [PubMed] [Google Scholar]
- Barshop N.J., Capparelli E.V., Sirlin C.B., Schwimmer J.B., Lavine J.E. Acetaminophen pharmacokinetics in children with nonalcoholic fatty liver disease. J. Pediatr. Gastroenterol. Nutr. 2011;52:198–202. doi: 10.1097/MPG.0b013e3181f9b3a0. [DOI] [PMC free article] [PubMed] [Google Scholar]
- Knibbe C.A., et al. Pharmacokinetics, induction of anaesthesia and safety characteristics of propofol 6% SAZN vs propofol 1% SAZN and Diprivan-10 after bolus injection. Br. J. Clin. Pharmacol. 1999;47:653–660. doi: 10.1046/j.1365-2125.1999.00942.x. [DOI] [PMC free article] [PubMed] [Google Scholar]
- Knibbe C.A., Zuideveld K.P., DeJongh J., Kuks P.F., Aarts L.P., Danhof M. Population pharmacokinetic and pharmacodynamic modeling of propofol for long-term sedation in critically ill patients: a comparison between propofol 6% and propofol 1%. Clin. Pharmacol. Ther. 2002;72:670–684. doi: 10.1067/mcp.2002.129500. [DOI] [PubMed] [Google Scholar]
- Peeters M.Y., et al. Prediction of propofol clearance in children from an allometric model developed in rats, children and adults versus a 0.75 fixed-exponent allometric model. Clin. Pharmacokinet. 2010;49:269–275. doi: 10.2165/11319350-000000000-00000. [DOI] [PubMed] [Google Scholar]
- Beal S.L., Sheiner L.B., Boeckmann A. NONMEM User's Guide. University of California; San Francisco; 1999. [Google Scholar]
- Karlsson M.O., Savic R.M. Diagnosing model diagnostics. Clin. Pharmacol. Ther. 2007;82:17–20. doi: 10.1038/sj.clpt.6100241. [DOI] [PubMed] [Google Scholar]
- Jonsson E.N., Karlsson M.O. Automated covariate model building within NONMEM. Pharm. Res. 1998;15:1463–1468. doi: 10.1023/a:1011970125687. [DOI] [PubMed] [Google Scholar]


