

Abstract
Quantitative analysis of cellular responses to drugs is of major interest in pharmaceutical research. Microarray technologies have been widely used for monitoring genome-wide expression changes. However, this approach has several limitations in terms of coverage of targeted RNAs, sensitivity, and quantitativeness, which are crucial for accurate monitoring of cellular responses. In this article, we report an application of genome-wide and quantitative profiling of cellular responses to drugs. We monitored promoter activities in MCF-7 cells by Cap Analysis of Gene Expression using a single-molecule sequencer. We identified a distinct set of promoters affected even by subtle inhibition of the Ras-ERK and phosphatidylinositol-3-kinase-Akt signal-transduction pathways. Furthermore, we succeeded in explaining the majority of promoter responses to inhibition of the upstream epidermal growth factor receptor kinase quantitatively based on the promoter profiles upon inhibition of the two individual downstream signaling pathways. Our results demonstrate unexplored utility of highly quantitative promoter activity profiling in drug research.
In the development of new drugs, monitoring cellular responses to drug candidates is a fundamental approach for assessing the efficacy and safety of using these drugs. A range of molecular profiling approaches, such as mass spectrometry, antibody-based proteomics, quantitative reverse transcriptase–polymerase chain reaction, and DNA microarray, has been used for monitoring responses at the molecular (protein and RNA) level.1,2,3,4 For instance, quantification of mRNA abundance is an effective way for monitoring gene expression changes in response to the drugs.5,6,7,8 Microarray-based technologies have been widely used for monitoring such changes on a genome-wide scale9 also in a context of drug effects on particular signaling pathways.10,11,12 However, microarrays have several limitations in terms of coverage of targeted RNAs, sensitivity, and dynamic quantitative range because they rely on predesigned oligonucleotide probes and hybridization-based detection.13 The quantitative limitation has forced researchers to use semi-quantitative interpretation of gene expression changes, for example, by rank-based analysis.14,15,16,17,18 RNA-seq is one of the latest techniques for profiling the transcriptome19,20 by sequencing random fragments of RNA; here, most of the protocols rely on second-generation sequencers and polymerase chain reaction–based amplification. Cap Analysis of Gene Expression (CAGE) is an alternative method for quantifying the transcriptome by sequencing the 5′-end of RNAs,21 and transcription start site profiles based on a polymerase chain reaction–dependent CAGE protocol are used as a reference of promoter activities in quantitative modeling based on multiple epigenetic marks in the ENCODE consortium.22 Recently, we improved on the CAGE method by adapting it to a third-generation (single-molecule) sequencer, which allowed us to avoid any amplification steps from the library preparation to the sequencing reaction, suggesting that the resulting read counts represent the absolute number of observations of RNA presence.23,24 In this article, we ask whether cellular responses can be modeled quantitatively from the aspect of the transcriptome, in particular, promoter activities. We demonstrate quantitative modeling based on accurate quantification of subtle cellular responses induced by low-dosage drug treatment.
Results
Promoter activity profiling of cellular responses to drugs
We monitored the effects of U0126, wortmannin, and gefitinib on human breast cancer MCF-7 cells using the quantitative and genome-wide promoter profiling method. U0126 and wortmannin are specific inhibitors of the Ras-ERK and phosphatidylinositol-3-kinase (PI3K)-Akt pathways, respectively (Figure 1a). Gefitinib is a potent inhibitor of the epidermal growth factor receptor (EGFR) kinase and mainly inhibits the Ras-ERK and PI3K-Akt pathways located downstream of this receptor. After determination of dosage of these drugs that show significant but not saturating effects on the cells (see Supplementary Figure S1 online), we prepared three replicate samples followed by CAGE profiling. On average, we obtained ~14 million reads mapped on the reference genome per sample. By aggregation of neighboring transcription start sites (see Supplementary Methods online for detailed parameters and thresholds), we defined 10,298 promoters with characteristics consistent with those in a previous research23 (see Supplementary Figures S2–S4 and Table S1 online). Of note, even when we treated with drugs at low concentrations, promoter activities across triplicate samples were highly reproducible (average of three drug samples and standard deviation of Pearson's correlation coefficient = 0.9984 ± 0.0016; a scatter plot of the biological replicates is shown in Figure 1b and Supplementary Figure S5 online). By differential analysis comparing with no drug treatment, we identified 139, 168, and 157 promoters significantly affected by U0126, wortmannin, and gefitinib treatment, respectively (false-discovery rate <2%; see Supplementary Table S2 online). Although drug treatment of the cells induces changes in gene expression, the magnitude of such changes is, in general, not very extraordinary because fundamentally they are of the same cell type.5,6,9 U0126 significantly suppressed EGR1 and FOS, target genes of the Ras-ERK pathway,25 wortmannin upregulated ErbB3, which was previously reported to be upregulated in a PI3K-Akt and FoxO3a-dependent manner,26 and gefitinib suppressed CCND1 promoter activity, one of the target genes of the EGFR pathway.27 Notably, FOS was not detected as a differentially expressed gene following U0126 treatment as by microarray profiling of the same RNA samples (Figure 1c). Taken together, the promoter activity profiles that we generated in this study are highly reproducible across biological replicates, consistent with previous studies, and could quantify modest changes in the transcriptome at submaximal drug dosage.
Figure 1.

Promoter-based expression profiling of drugs targeting the epidermal growth factor receptor (EGFR) pathway. (a) Schematic representation of EGFR pathways and the drug-targeting sites. Ligand-mediated dimerization of the EGFR induces autophosphorylation of the EGFR tyrosine kinase, which activates downstream signal-transduction pathways, mainly Ras-ERK and phosphatidylinositol-3-kinase (PI3K)-Akt, which regulate gene expression. Gefitinib, U0126, and wortmannin directly inhibit the activity of EGFR, ERK, and Akt, respectively. The activation status of EGFR and Ras-ERK and PI3K-Akt pathways were monitored by measurement of the phosphorylation status of EGFR, ERK, and Akt, respectively (marked by orange circles). (b) A scatter plot of promoter activity (tags per million) between two biological replicates of gefitinib-treated MCF-7 cells. (c) Comparison of U0126- and wortmannin-treatment profiles (left panel showing promoter activities monitored by CAGE and right showing gene expressions monitored by microarray). The log2 fold change of each promoter activity (gene expression) against non–drug treatment control is plotted. The promoters (genes) significantly affected by either U0126 or wortmannin treatment are color coded as blue and green, respectively, and by both treatments as red. False-discovery rate (FDR) <2% for Cap Analysis of Gene Expression (CAGE) and B-statistics >4 for microarray were used to select an almost equal number of the affected promoters/genes. EGR1, FOS, and CCND1 are known to be regulated by the Ras-ERK pathway and ErbB3 by the PI3K-Akt pathway. (d) Percentage of promoters significantly affected by either U0126 or wortmannin treatments or both.
Quantitative comparison of drug responses
We compared U0126- and wortmannin-treated profiles. Since they inhibit parallel but distinct pathways, one would expect distinct cellular responses. Figure 1c indicates that the promoter activities emphasize their differences (Pearson's correlation coefficient ~0.60), which are more evident than in gene expression profiles determined by microarray (Pearson's correlation coefficient ~ 0.92). Among the promoters significantly affected by the drugs, ~15% of them are commonly altered (i.e., suppressed or activated), whereas ~84% are affected by only a single drug (Figure 1d). Interestingly, a promoter, designated as chr7_-_74867620 (unannotated promoter), was affected in opposite ways (see Supplementary Table S2 online), even though microarray analysis did not detect significant expression changes at our working drug dosage. Overall, the promoter activity–based cellular response profiling approach successfully identified a distinct set of promoters downstream of individual pathways (~80% of the promoters), as well as a set of commonly affected promoters.
Quantitative explanation of the EGFR inhibitory effect by downstream inhibitors
We asked whether the profile for gefitinib could be explained by using the profiles for U0126 and wortmannin. As EGFR (a gefitinib target) primarily controls both Ras-ERK (target of U0126) and PI3K-Akt (target of wortmannin) pathways (Figure 1a), we hypothesized that EGFR inhibition can be explained by individual inhibition of these two pathways at the transcriptome level. To test this hypothesis, we used multiple linear regression analysis by taking gefitinib profiles as response variables and U0126 and wortmannin profiles as explanatory variables, where only promoters significantly affected by gefitinib are considered. Pearson's correlation coefficient of the regression model to the gefitinib profile, 0.749, is higher than the correlations of either U0126 or wortmannin profiles to the gefitinib profile (0.668 and 0.659, respectively; Figure 2a and Supplementary Figure S6 online). One could speculate that the correlation 0.749 can be achieved by combinatorial regression of any profiles, and thus we tested this possibility by performing the same regression analysis 100,000 times with random permutations of explanatory variables, that is, either U0126 or wortmannin profiles (see Supplementary Method 5.2 online). The correlation coefficients of the result of permutations (green and blue histograms, respectively; see Supplementary Figure S6 online) did not become higher than the one of the regression model based on U0126 and wortmannin with the gefitinib profiles, which indicates P value for the occurrence of such high correlation coefficient is <1 × 10⁻⁵. This result cannot be obtained with microarray analysis because the number of genes whose expression changes at equivalent thresholds are reliably measured is too small at an equivalent threshold (see Supplementary Figure S7 online). Even if we take a different threshold, by considering the result that the microarray profiles of U0126 and wortmannin responses are very close each other as described earlier (correlation coefficients 0.92; Figure 1c), their combination will remain very close to their original profiles rather than to the gefitinib response.
Figure 2.

Linear regression model explaining the gefitinib treatment profile by using U0126 and wortmannin profiles. (a) Promoter activity profiles in gefitinib treatment and the regression model using U0126 and wortmannin profiles. The promoters in which the regression model is consistent with the gefitinib profile (within 0.2-fold) are color coded as black. (b) Content of the promoters affected by gefitinib.
We focused on the promoters that are roughly modeled by using both U0126 and wortmannin profiles. Of the 157 promoters significantly affected by gefitinib treatment, the level of expression changes in 133 (84.7%) promoters is consistent with the regression model (the difference of log2 fold changes in the gefitinib profile to control and the regression model are within 0.2-fold as shown in Figure 2a,b and Supplementary Table S3 online for individual classifications). The remaining 24 promoters (15.3%) can be interpreted by postulating the existence of minor pathways affected by gefitinib only. For example, one of them may be a STAT pathway. It has been reported that two transcription factors, STAT1 and STAT2, are perturbed by gefitinib in a manner independent of the Ras-ERK and PI3K-Akt pathways.28 Two of their target genes identified by ChIP experiments,29 TNFR and KRT23, are included in the 24 promoters (Figure 2a). When focusing on the 133 promoters in which the regression model is consistent with the gefitinib profile, 50 (37.6%) are altered either by U0126 or wortmannin, and 72 (54.1%) are unaffected by either treatment (see Supplementary Table S3 online and Figure 2b). This finding indicates that both U0126 and wortmannin profiles contribute independently to the regression model for majority of the promoters and that even subtle changes identified here reflect the actual perturbation at the transcriptome level.
Discussion
This is the first report on promoter activity profiling of drug responses using nonamplified CAGE libraries followed by single-molecule sequencing. Promoter activity profiles in response to the inhibition of ERK and PI3K kinases by U0126 and wortmannin, respectively, in human breast cancer MCF-7 cells are highly reproducible and consistent with previous studies. The sensitive profiling achieved by single-molecule sequencing allowed us to distinguish modest quantitative changes in the transcriptome even at submaximal drug dosage, which is very difficult to achieve with microarray-based profiling. Furthermore, the quantitative profiling allowed us to propose that both the inhibitory profiles of U0126 and wortmannin were constitutive components of the transcriptome profiles obtained by inhibition of the EGFR kinase, which is located upstream of both ERK and PI3K pathways. Although there are still some unexplained effects when using those two profiles as explanatory variables, our regression model successfully explained the changes in majority promoters significantly altered by gefitinib (Figure 2a,b and Supplementary Table S3 online), and its statistical significance was confirmed by permutation test (see Supplementary Figure S6 online). Lange et al. explained protein phosphorylation in the same pathway by nonlinear model, which could explain the unexplained effect by our linear model presented here complementarily.30 Nevertheless, the results here demonstrated the utility of sensitive and quantitative promoter activity profiling in elucidation of cellular responses to the drug.
Quantitative transcriptome analysis is potentially widely applicable in determining target proteins and action mechanisms of uncharacterized compounds. To further verify the applicability of this approach, additional analysis should be performed for different kinds of drugs with known action mechanisms, for example, herceptin (anti-ErbB2 receptor antibody), tamoxifen (estrogen receptor antagonist), cisplatin (DNA synthesis inhibitor), 5-fluorouracil, methotorexate (metabolome inhibitor), or docetaxicel (microtubule assembly inhibitor), which have been widely used for cancer therapies. Nonetheless, this study paves the way for quantitative analysis of drug responses at the promoter level, and moreover, it is potentially applicable for the evaluation of combinatorial or serial drug treatment in a clinical setting.
Methods
Cell culture and RNA preparation. The MCF-7 human breast cancer cell line was obtained from the American Type Culture Collection and maintained in Dulbecco's modified Eagle's medium (Invitrogen, Carlsbad, CA) supplemented with 10% fetal bovine serum. Before drug treatment, the medium was switched to Dulbecco's modified Eagle's medium supplemented with 2% fetal bovine serum and the cultures were maintained overnight. Gefitinib (ZD1839)31 (1 μM, a generous gift from AstraZeneca, London, UK), U012632 (500 nM, Calbiochem, San Diego, CA), or wortmannin33 (10 nM, Nacalai Tesque, Kyoto, Japan) was added and incubated with the cells for 6 h. Cells treated with dimethyl sulfoxide were used as the no drug treatment control. After the treatment, the cells were washed with phosphate-buffered saline twice, and RNA was isolated using the miRNeasy Mini kit (QIAGEN, Hilden, Germany) and analyzed by Bioanalyzer (Agilent technology, Santa Clara, CA).
Western blot. We confirmed the drug effect on the target proteins at the phosphoprotein level and defined the optimal drug concentrations so as to avoid a saturating effect. Cell lysates clarified by centrifugation were used in western blotting as described previously.34 ERK1/2, phospho-ERK1/2(T202/Y204), Akt, phospho-Akt(S473), phospho-EGFR(Y1068) antibodies were purchased from Cell Signaling Technology (Danvers, MA), and anti-EGFR antibody was purchased from Fitzgerald Industries International (Acton, MA).
Production and analysis of single-molecule CAGE data. CAGE libraries for single-molecule sequencing were constructed as described previously23 and sequenced on HeliScope. Sequenced reads were filtered and mapped to the February 2009 human genome assembly in UCSC (hg19 assembly). We grouped mapped reads overlapping within a few base pairs on the same strand into a single cluster as a promoter, and quantified promoter activities by counting the number of integrated reads in each cluster. Differential expression analysis between the control and the drug-treated samples was performed by using the edgeR package of Bioconductor in the R statistical language.35 False-discovery rate <2% was used as a criterion for the differential expression against control experiments (see Supplementary Methods online).
Microarray analysis. We performed microarray analysis for establishing a baseline of the drug effects caused by our working doses, which was used for comparison with the drug effects of single-molecule CAGE profiles. Five hundred nanograms of total RNA was subjected to the Sentrix Human-6 Expression BeadChip (Illumina) according to the standard Illumina protocols. Variance-stabilizing normalization of Illumina data and B-statistics calculations were carried out using the lumi and limma packages of Bioconductor in the R statistical language.36,37,38 B-statistics >4 was used as criterion for the differential expression against control (see Supplementary Methods online).
Linear regression model of the effect of EGFR inhibition. As a result of the differential analysis of gefitinib treatment against the control condition, we identified 157 promoters that were significantly altered. We then modeled the expression changes of these altered promoters by gefitinib treatment based on U0126- and wortmannin-response profiles. We defined the fold change of promoter activities by drug treatment (Fp,s) as follows:
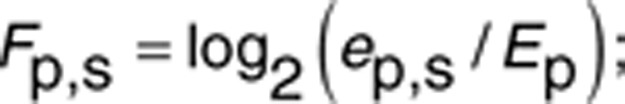 |
where Ep represents the expression of promoter p on the control and ep,s represents the expression in sample s. We used a linear regression analysis to model the response of promoter activities after gefitinib treatment (Fp,gefitinib). The formula of the linear regression is defined with error variable ep as follows:
 |
and optimized the parameters (β1 and β2) by using the least squares approach, 0.7326 and 0.7391, respectively.
All of these analyses totally depend on how to quantify promoter expressions, while we constructed promoters operationally as described in Supplementary Method 3.1 online. One could hypothesize that the regression produces totally different results when we used different definitions of promoter. To examine this possibility, we estimated parameters (β1 and β2) with several definitions of promoter and found that the parameter values estimated above are representative, that is, within 2.5 percentile (0.5690 and 0.5930 for β1 and β2) and 97.5 percentile (0.7892 and 0.8713, respectively) in the promoter sets (see Supplementary Method 5.1 online for details).
Authors contributions
M.O.-H., H.K., and H.S. designed the research. M.O.-H. and H.S. performed the research. K.K. analyzed the data. K.K., M.O.-H., H.K., and H.S. wrote the manuscript.
Conflict of interest
The authors declared no conflict of interest.
Study Highlights
Acknowledgments
The authors thank Noriko Yumoto for western blot analysis and the RIKEN Genome Network Analysis Service for the sequencing of CNhs11141-61 CAGE libraries using the HeliScope (Helicose). This work was funded by Grant-in-Aid for Scientific Research for Challenging Exploratory Research (Drug Promotome) and by a Grant from Takeda Science Foundation to H.S., a Grant of the Innovative Cell Biology by Innovative Technology (Cell Innovation Program) from MEXT to M.O.-H. and Y.H., respectively, a Research Grant from MEXT through RIKEN Preventive Medicine and Diagnosis Innovation Program to YH, a Research Grant for RIKEN Omics Science Center from MEXT and a Grant for RIKEN Center for Life Science Technologies (Division of Genomic Technologies) from MEXT.
Supplementary Material
References
- Hudelist G., Singer C.F., Kubista E., Czerwenka K. Use of high-throughput arrays for profiling differentially expressed proteins in normal and malignant tissues. Anticancer. Drugs. 2005;16:683–689. doi: 10.1097/01.cad.0000168393.12300.01. [DOI] [PubMed] [Google Scholar]
- O'Connell K., et al. The use of LC-MS to identify differentially expressed proteins in docetaxel-resistant prostate cancer cell lines. Proteomics. 2012;12:2115–2126. doi: 10.1002/pmic.201100489. [DOI] [PubMed] [Google Scholar]
- Lohmann S., et al. Gene expression analysis in biomarker research and early drug development using function tested reverse transcription quantitative real-time PCR assays. Methods. 2013;59:10–19. doi: 10.1016/j.ymeth.2012.07.003. [DOI] [PubMed] [Google Scholar]
- Raveendran N.N., et al. Drug-induced alterations to gene and protein expression in intestinal epithelial cell 6 cells suggest a role for calpains in the gastrointestinal toxicity of nonsteroidal anti-inflammatory agents. J. Pharmacol. Exp. Ther. 2008;325:389–399. doi: 10.1124/jpet.107.127720. [DOI] [PubMed] [Google Scholar]
- Solmi R., et al. Displayed correlation between gene expression profiles and submicroscopic alterations in response to cetuximab, gefitinib and EGF in human colon cancer cell lines. BMC Cancer. 2008;8:227. doi: 10.1186/1471-2407-8-227. [DOI] [PMC free article] [PubMed] [Google Scholar]
- Shoulars K., Rodriguez M.A., Thompson T., Markaverich B.M. Regulation of cell cycle and RNA transcription genes identified by microarray analysis of PC-3 human prostate cancer cells treated with luteolin. J. Steroid Biochem. Mol. Biol. 2010;118:41–50. doi: 10.1016/j.jsbmb.2009.09.016. [DOI] [PMC free article] [PubMed] [Google Scholar]
- Kim H.P., et al. Lapatinib, a dual EGFR and HER2 tyrosine kinase inhibitor, downregulates thymidylate synthase by inhibiting the nuclear translocation of EGFR and HER2. PLoS ONE. 2009;4:e5933. doi: 10.1371/journal.pone.0005933. [DOI] [PMC free article] [PubMed] [Google Scholar]
- Weaver D.A., Crawford E.L., Warner K.A., Elkhairi F., Khuder S.A., Willey J.C. ABCC5, ERCC2, XPA and XRCC1 transcript abundance levels correlate with cisplatin chemoresistance in non-small cell lung cancer cell lines. Mol. Cancer. 2005;4:18. doi: 10.1186/1476-4598-4-18. [DOI] [PMC free article] [PubMed] [Google Scholar]
- Inoue R., Matsuyama H., Yano S., Yamamoto Y., Iizuka N., Naito K. Gefitinib-related gene signature in bladder cancer cells identified by a cDNA microarray. Anticancer Res. 2006;26:4195–4202. [PubMed] [Google Scholar]
- Fertig E.J., et al. Gene expression signatures modulated by epidermal growth factor receptor activation and their relationship to cetuximab resistance in head and neck squamous cell carcinoma. BMC Genomics. 2012;13:160. doi: 10.1186/1471-2164-13-160. [DOI] [PMC free article] [PubMed] [Google Scholar]
- Schlicker A., et al. Subtypes of primary colorectal tumors correlate with response to targeted treatment in colorectal cell lines. BMC Med. Genomics. 2012;5:66. doi: 10.1186/1755-8794-5-66. [DOI] [PMC free article] [PubMed] [Google Scholar]
- Ochs M.F., et al. Detection of treatment-induced changes in signaling pathways in gastrointestinal stromal tumors using transcriptomic data. Cancer Res. 2009;69:9125–9132. doi: 10.1158/0008-5472.CAN-09-1709. [DOI] [PMC free article] [PubMed] [Google Scholar]
- Wang Y., et al. Large scale real-time PCR validation on gene expression measurements from two commercial long-oligonucleotide microarrays. BMC Genomics. 2006;7:59. doi: 10.1186/1471-2164-7-59. [DOI] [PMC free article] [PubMed] [Google Scholar]
- Weinstein J.N., et al. An information-intensive approach to the molecular pharmacology of cancer. Science. 1997;275:343–349. doi: 10.1126/science.275.5298.343. [DOI] [PubMed] [Google Scholar]
- Lamb J., et al. The Connectivity Map: using gene-expression signatures to connect small molecules, genes, and disease. Science. 2006;313:1929–1935. doi: 10.1126/science.1132939. [DOI] [PubMed] [Google Scholar]
- Iorio F., et al. Discovery of drug mode of action and drug repositioning from transcriptional responses. Proc. Natl. Acad. Sci. USA. 2010;107:14621–14626. doi: 10.1073/pnas.1000138107. [DOI] [PMC free article] [PubMed] [Google Scholar]
- Barretina J., et al. The Cancer Cell Line Encyclopedia enables predictive modelling of anticancer drug sensitivity. Nature. 2012;483:603–607. doi: 10.1038/nature11003. [DOI] [PMC free article] [PubMed] [Google Scholar]
- Lee J.H., et al. CDA: combinatorial drug discovery using transcriptional response modules. PLoS ONE. 2012;7:e42573. doi: 10.1371/journal.pone.0042573. [DOI] [PMC free article] [PubMed] [Google Scholar]
- Wang Z., Gerstein M., Snyder M. RNA-Seq: a revolutionary tool for transcriptomics. Nat. Rev. Genet. 2009;10:57–63. doi: 10.1038/nrg2484. [DOI] [PMC free article] [PubMed] [Google Scholar]
- Baldwin R.L.T., Wu, S., Li W., Li C., Bequette B.J., Li R.W. Quantification of transcriptome responses of the rumen epithelium to butyrate infusion using RNA-seq technology. Gene Regul Sys Biol. 2012;6:67–80. doi: 10.4137/GRSB.S9687. [DOI] [PMC free article] [PubMed] [Google Scholar]
- Shiraki T., et al. Cap analysis gene expression for high-throughput analysis of transcriptional starting point and identification of promoter usage. Proc. Natl. Acad. Sci. USA. 2003;100:15776–15781. doi: 10.1073/pnas.2136655100. [DOI] [PMC free article] [PubMed] [Google Scholar]
- Dunham I., et al. An integrated encyclopedia of DNA elements in the human genome. Nature. 2012;489:57–74. doi: 10.1038/nature11247. [DOI] [PMC free article] [PubMed] [Google Scholar]
- Kanamori-Katayama M., et al. Unamplified cap analysis of gene expression on a single-molecule sequencer. Genome Res. 2011;21:1150–1159. doi: 10.1101/gr.115469.110. [DOI] [PMC free article] [PubMed] [Google Scholar]
- Itoh M., et al. Automated workflow for preparation of cDNA for cap analysis of gene expression on a single molecule sequencer. PLoS ONE. 2012;7:e30809. doi: 10.1371/journal.pone.0030809. [DOI] [PMC free article] [PubMed] [Google Scholar]
- Boros J., O'Donnell A., Donaldson I.J., Kasza A., Zeef L., Sharrocks A.D. Overlapping promoter targeting by Elk-1 and other divergent ETS-domain transcription factor family members. Nucleic Acids Res. 2009;37:7368–7380. doi: 10.1093/nar/gkp804. [DOI] [PMC free article] [PubMed] [Google Scholar]
- Garrett J.T., et al. Transcriptional and posttranslational up-regulation of HER3 (ErbB3) compensates for inhibition of the HER2 tyrosine kinase. Proc. Natl. Acad. Sci. USA. 2011;108:5021–5026. doi: 10.1073/pnas.1016140108. [DOI] [PMC free article] [PubMed] [Google Scholar]
- Astsaturov I., et al. Synthetic lethal screen of an EGFR-centered network to improve targeted therapies. Sci. Signal. 2010;3:ra67. doi: 10.1126/scisignal.2001083. [DOI] [PMC free article] [PubMed] [Google Scholar]
- Quesnelle K.M., Boehm A.L., Grandis J.R. STAT-mediated EGFR signaling in cancer. J. Cell. Biochem. 2007;102:311–319. doi: 10.1002/jcb.21475. [DOI] [PubMed] [Google Scholar]
- Clarkson R.W., et al. The genes induced by signal transducer and activators of transcription (STAT)3 and STAT5 in mammary epithelial cells define the roles of these STATs in mammary development. Mol. Endocrinol. 2006;20:675–685. doi: 10.1210/me.2005-0392. [DOI] [PubMed] [Google Scholar]
- Lange F., Rateitschak K., Kossow C., Wolkenhauer O., Jaster R. Insights into erlotinib action in pancreatic cancer cells using a combined experimental and mathematical approach. World J. Gastroenterol. 2012;18:6226–6234. doi: 10.3748/wjg.v18.i43.6226. [DOI] [PMC free article] [PubMed] [Google Scholar]
- Ciardiello F., et al. Inhibition of growth factor production and angiogenesis in human cancer cells by ZD1839 (Iressa), a selective epidermal growth factor receptor tyrosine kinase inhibitor. Clin. Cancer Res. 2001;7:1459–1465. [PubMed] [Google Scholar]
- Favata M.F., et al. Identification of a novel inhibitor of mitogen-activated protein kinase kinase. J. Biol. Chem. 1998;273:18623–18632. doi: 10.1074/jbc.273.29.18623. [DOI] [PubMed] [Google Scholar]
- Powis G., et al. Wortmannin, a potent and selective inhibitor of phosphatidylinositol-3-kinase. Cancer Res. 1994;54:2419–2423. [PubMed] [Google Scholar]
- Birtwistle M.R., Hatakeyama M., Yumoto N., Ogunnaike B.A., Hoek J.B., Kholodenko B.N. Ligand-dependent responses of the ErbB signaling network: experimental and modeling analyses. Mol. Syst. Biol. 2007;3:144. doi: 10.1038/msb4100188. [DOI] [PMC free article] [PubMed] [Google Scholar]
- Robinson M.D., McCarthy D.J., Smyth G.K. edgeR: a Bioconductor package for differential expression analysis of digital gene expression data. Bioinformatics. 2010;26:139–140. doi: 10.1093/bioinformatics/btp616. [DOI] [PMC free article] [PubMed] [Google Scholar]
- Smyth G.K., Yang Y.H., Speed T. Statistical issues in cDNA microarray data analysis. Methods Mol. Biol. 2003;224:111–136. doi: 10.1385/1-59259-364-X:111. [DOI] [PubMed] [Google Scholar]
- Huber W., von Heydebreck A., Sültmann H., Poustka A., Vingron M. Variance stabilization applied to microarray data calibration and to the quantification of differential expression. Bioinformatics. 2002;18 suppl. 1:S96–104. doi: 10.1093/bioinformatics/18.suppl_1.s96. [DOI] [PubMed] [Google Scholar]
- Lin S.M., Du P., Huber W., Kibbe W.A. Model-based variance-stabilizing transformation for Illumina microarray data. Nucleic Acids Res. 2008;36:e11. doi: 10.1093/nar/gkm1075. [DOI] [PMC free article] [PubMed] [Google Scholar]
Associated Data
This section collects any data citations, data availability statements, or supplementary materials included in this article.