Abstract
In this work, we demonstrate in vitro detection of glucose by means of a lab-on-chip absorption spectroscopy approach. This optical method allows label-free and specific detection of glucose. We show glucose detection in aqueous glucose solutions in the clinically relevant concentration range with a silicon-based optofluidic chip. The sample interface is a spiral-shaped rib waveguide integrated on a silicon-on-insulator (SOI) photonic chip. This SOI chip is combined with micro-fluidics in poly(dimethylsiloxane) (PDMS). We apply aqueous glucose solutions with different concentrations and monitor continuously how the transmission spectrum changes due to glucose. Based on these measurements, we derived a linear regression model, to relate the measured glucose spectra with concentration with an error-of-fitting of only 1.14 mM. This paper explains the challenges involved and discusses the optimal configuration for on-chip evanescent absorption spectroscopy. In addition, the prospects for using this sensor for glucose detection in complex physiological media (e.g. serum) is briefly discussed.
OCIS codes: (280.1415) Biological sensing and sensors, (250.5300) Photonic integrated circuits, (300.1030) Absorption
1. Introduction
Diabetes is a serious health condition that requires patients to self-monitor their blood glucose levels. Whereas the finger-stick and test-strip measurement is still the medical standard, continuous glucose monitoring (CGM) offers patients a better and safer glycemic control [1]. Many research efforts have shown that it is possible to extract the glucose signature from near-infrared (NIR) absorption spectra [2,3]. This detection method avoids the use of reagents to ensure long-term sensor reliability and additionally, allows the detection of multiple bio-molecules apart from glucose. Therefore, we propose an implantable CGM device that detects glucose based on NIR absorption spectroscopy. The main challenge is the stringent signal-to-noise (SNR) requirement for the sensor as near-infrared light typically probes the weaker and broadband overtone absorption features instead of the strong fundamental molecular vibrations.
To implement the implantable CGM device, we need a miniature spectrometer. This is possible by integrating the spectrometer functionality on a silicon-on-insulator (SOI) photonic chip. Many demonstrations have shown that these integrated miniature spectrometers offer high performance with a footprint of only a few mm2 [4–6]. Next to the spectrometer functionality, the sample-interface can also be integrated on the photonic chip. We use the evanescent field of the transverse-electric (TE) optical waveguide mode to detect the attenuation due to glucose. Evanescent absorption spectroscopy of biomolecules has been demonstrated previously using integrated waveguides [7, 8], especially on the low-loss chalcogenide platform [9–11], and optical cavities [12, 13]. However, typically the mid-infrared wavelengths are probed for which power-efficient integrated sources are lacking. Or, as for the chalcogenide platform, integrated NIR sources (with electrical injection) are missing. In the case of optical cavities, the interaction length and free spectral range are closely related which can compromise the design.
In this paper, we focus on the optimal configuration to exploit this evanescent sensing mechanism in the telecom wavelength range (1540–1610 nm), for which a variety of integrated light sources and detectors exist [14, 15]. In addition, we show how we can optimize the signal-to-noise ratio of our measurement set-up to realize sensitive in vitro glucose detection. An optofluidic chip was fabricated that combines an evanescent sensor integrated on a silicon-on-insulator (SOI) optical chip with microfluidics in poly(dimethylsiloxane) (PDMS). An external light source, tunable filter and photodetectors are used to continuously acquire the transmission spectra of the evanescent sensor, while applying different aqueous glucose solutions alternated with pure water to the opto-fluidic chip. We alternate with water to provide a time reference that allows to eliminate both the water contribution to the measured spectra and the small slow drift effects that are present in our set-up. Analysis of the transmission spectra shows that we can detect glucose in the range from 1 mM to 70 mM. The developed system also demonstrates that sensitive and selective molecular detection is possible without the need of any labeling or selective-binding chemistry which is common practice for on-chip sensors [16]. All of this is a first step towards an in vivo CGM device, but it will be clear from the paper that many challenges remain before a silicon-photonics-based approach will enable CGM.
The remainder of this article is structured as follows: firstly, the sensor principle and design is explained. Secondly, the measurement configuration is discussed after which we present the measurement results and data analysis. Finally, we provide an outlook and conclusion based on the obtained results.
2. Evanescent sensing of glucose
2.1. Sensing principle
We use an optical waveguide integrated onto a silicon-on-insulator (SOI) chip to detect glucose. When this waveguide is immersed with a sample solution, the evanescent tail of the propagating waveguide mode is attenuated according to the absorption spectrum of the applied solution. This absorption spectrum is unique and serves as a fingerprint for molecules. The evanescent sensing principle is based on the law of Beer-Lambert. Thus, the transmission T of the waveguide of length L, immersed in an aqueous glucose solution, can be written as [17]:
| (1) |
| (2) |
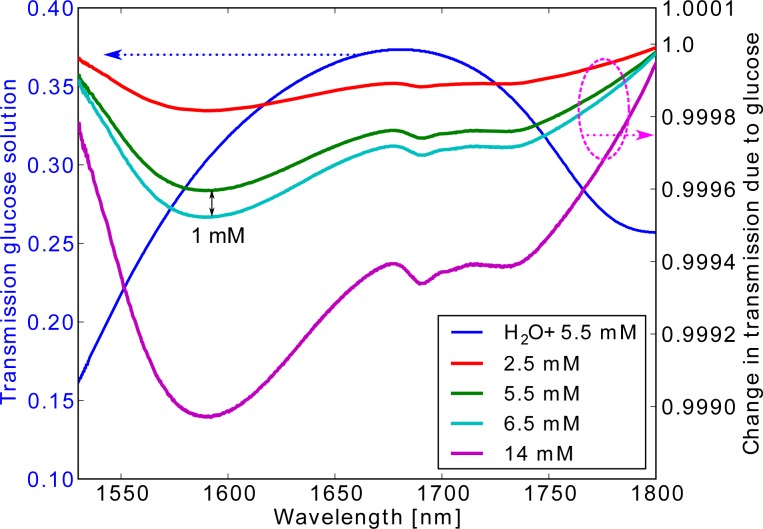
The sample absorbance AsL is multiplied with the confinement factor Γ. The terms εgluc and ε H2O are the wavelength-dependent molar absorptivity of glucose and water respectively and define the shape of the spectrum. Given that the glucose molecules displace a number of water molecules from the optical path, the pure water concentration C H2O is reduced with the glucose concentration by the displacement factor fw. The absorbance due to waveguide losses is denoted with AwgL. The transmission spectrum of a 1 cm long waveguide with a typical confinement factor of 0.1 and 2 dB/cm of waveguide losses, immersed in a 5.5 mM aqueous glucose solution is shown in Fig. 1. In the same Fig. 1, using the right y-axis, the effect of glucose is revealed after elimination of the water absorption. These transmission spectra are calculated using Eqs. (1)–(2) with the values of εgluc, ε H2O, fw and C H2O as reported in [17]. It is clear that the glucose absorption features are very weak and broadband. The change in transmission for the clinically relevant glucose concentrations is on the order of 1e-4. It is thus of paramount importance to optimize the evanescent sensor to enhance the sensitivity. A first parameter that can be optimized is the interaction length L. It can be designed such that the change in transmitted power ΔP, due to the presence of glucose, is maximized. Mathematically, the optimal length Lopt can be derived as:
| (3) |
To reduce the evanescent sensor footprint, the waveguide of length Lopt is typically routed into a spiral. Note that the optimal interaction length is wavelength dependent. The above formula also indicates that a low-loss waveguide is beneficial. In integrated waveguides a large portion of the waveguide losses are caused by sidewall roughness [18]. By reducing the overlap between the waveguide mode and the sidewall, lower propagation losses can be achieved.
Fig. 1.
Blue curve (with left y-axis): Transmission spectrum of a 1 cm long waveguide with a typical confinement factor of 0.1 and waveguide losses of 2 dB/cm, immersed in a 5.5 mM aqueous glucose solution. The other curves (with right y-axis) represents the change in transmission caused by glucose absorption for different glucose concentrations. This graph is based on reference data from [17].
2.2. Silicon-on-insulator design
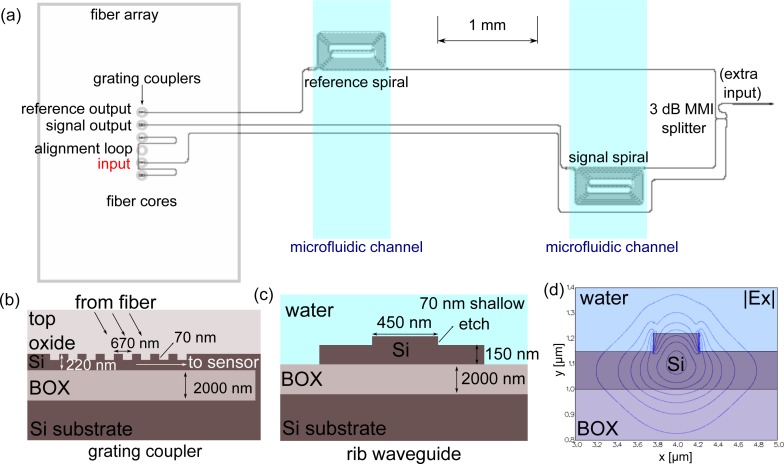
The complete SOI design is shown in Fig. 2(a). The SOI chip is fabricated in a CMOS pilot line on a 200 mm SOI wafer, comprising a 220 nm thick Si waveguide layer on a 2 μm buried oxide layer [19]. The optical circuit comprises both a signal and reference sensor. The signal spiral will be immersed in the glucose solutions while the identical reference signal can account for possible common noise such as source power fluctuations, temperature variations etc. The photonic chip has a planarized 1.35 μm thick top oxide cladding. To allow evanescent sensing, the top oxide above the signal and reference spiral is removed by wet etching with a 40% buffered Hydrogen Fluoride (HF) solution. This way, we also ensure that the only evanescent response is caused by sample absorption at the spiral sensors.
Fig. 2.
(a) SOI chip design with indication of the microfluidic channels (b) design of the grating coupler and (c) rib waveguide design that is used in the sensor circuit. (d) contour plot of the amplitude of the dominant Ex field of the fundamental TE-mode of a 450 nm wide rib waveguide that is used for evanescent sensing.
We only excite the transverse-electric (TE) waveguide mode for evanescent sensing. The transverse-electric (TM) waveguide mode is in principle better suited for evanescent sensing [20] given the high confinement factor. In addition, sidewall roughness has a lower impact as the TM mode is more sensitive to the top surface of the waveguide. Still, the optical circuit insertion loss would increase drastically due to a non-optimized focusing grating coupler design with a low peak efficiency of 13% [21]. In contrast, we can excite the TE mode using straight grating couplers with a measured peak coupling efficiency of 29% (see Fig. 2(b)). The used grating couplers have a designed period of 670 nm, 50% fill factor and 70 nm shallow etch.
Given the etch-depth restrictions imposed by the SOI chip fabrication process, we can use the (fundamental) TE-mode of 220 nm high wire waveguides or rib waveguides with a shallow etch of 70 nm [18]. For the standard waveguide width of 450 nm, the confinement factor of a wire waveguide is higher (≈ 2×) than for a rib waveguide. Still, we opted for rib waveguides as the reduced modal overlap with the waveguide sidewall, induce lower propagation losses and lower distributed backscattering [22]. Distributed backscattering leads to an unwanted interference pattern in the transmission spectrum that is sensitive to environmental parameters and that can mask the glucose signature.
We design the rib waveguide width to be 450 nm to allow a reasonably high confinement factor (see Fig. 2(c,d)). This confinement factor is wavelength dependent. In the wavelength range that we will address (1540–1610 nm), this wavelength dependency is approximately linear with a simulated for a water-clad 450 nm wide rib waveguide. In addition, the confinement factor can vary with the refractive index of the cladding and temperature through the associated change in the electric field profile of the waveguide mode. Using simulations with a fully vectorial mode solver Fimmwave (Photon Design), we calculated that for λ =1590 nm (the peak absorption wavelength of glucose), (RIU: refractive index unit) and using material parameters from [23–25]. These small values show that our spiral sensor is robust against small temperature variations and refractive index changes of the aqueous cladding due to glucose ( ). On the other hand, if a thin layer of material adsorbs to this 450 nm wide rib waveguide, a strong decrease in confinement factor can be expected. A thin uniform layer of 40 nm with a refractive index of 1.45, reduces the confinement factor of a 450 nm wide rib waveguide by 50% at a wavelength of λ =1590 nm. This is a result of the high index contrast of the SOI platform and small waveguide dimensions. The adsorption of material should thus be avoided.
The sensor waveguide length is optimized for λ =1590 nm. The parameters that are used in Eqs. (2)–(3) to calculate this spiral length are: λ =1590 nm, ε H2O=5.77e-6 mM−1, C H2O=55138 mM, Γsimulated =0.08 for an aqueous cladding and Awg=2 dB/cm. This waveguide loss figure was estimated, as we didn’t have the measured loss data for this rib waveguide at the time of the mask design. The calculation yields Lopt = 0.96cm. The length of the fabricated spiral was increased to L=1 cm to account for a potentially 10% smaller confinement factor due to fabrication imperfections (Γfabricated = Γsimulated × 0.9). The 1 cm long waveguide is routed into a spiral to reduce the sensor footprint to 0.28 mm2. Given that the evanescent field is strongly confined to the sensor waveguide, a very small sample volume of a few nL is sufficient to cover the spiral.
3. Experimental set-up
3.1. Microfluidics design and fluid handling
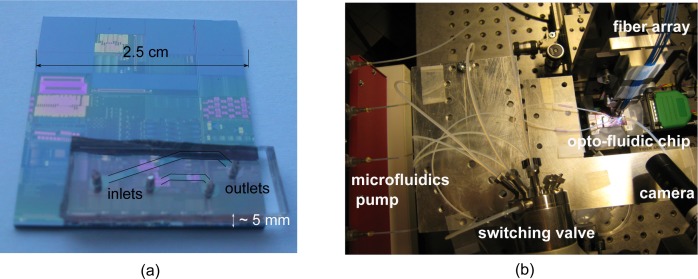
The SOI sensor chip is combined with microfluidics fabricated in poly(dimethylsiloxane) (PDMS) (Sylgard 184, Dow Corning Corporation) using soft lithography [26]. Both the SOI-chip and PDMS are given a short oxygen plasma treatment before applying direct bonding with a flip-chip machine. A close-up of the fabricated optofluidic chip is shown in Fig. 3(a). The fluidic channels are 780 μm wide and 50 μm high. A total of seven different aqueous solutions (0 mM, 1 mM, 5.5 mM, 16 mM, 24 mM, 36 mM and 70 mM) were prepared by adding glucose (D-glucose from Sigma-Aldrich) to de-ionized (DI) water. To efficiently switch between the different glucose solutions, we use a selector valve (Vici, C5C). The output of the valve is connected to the inlet of the PDMS with a flexible PTFE micro-tube. The six available inputs of the valve are connected to syringes (10 mL) containing different glucose solutions. Only one input at a time can be selected and the five other non-selected valve inputs are connected to the common waste output of the valve. A microfluidic pump (TSE systems), loaded with the syringes, is used to pump the solutions at a steady rate of 9μL/min. The measurement set-up is shown in Fig. 3(b).
Fig. 3.
(a) fabricated optofluidic chip (b) measurement set-up (the optical read-out instrumentation is not shown)
3.2. Optical read-out system
As we want to simultaneously measure the signal and reference spiral transmission, we use a fiber array to near-vertically couple the light in and out of the optical chip. The fiber array is glued to the optofluidic chip for mechanical stability. Polarization maintaining fiber (PMF) is used throughout the whole optical path. This ensures the reduction of detected power fluctuations caused by variations in mode coupling in the fiber, which are potentially different from signal to reference path. Finally, the sample is placed onto a temperature controller for thermal stability. Given the high signal-to-noise requirements for glucose absorption spectroscopy (see Fig. 1), we carefully analysed the optimal source-detector configuration. When using higher input power, the glucose detection limit will be lower. A tunable laser source is thus a tempting choice. Still, the coherent nature of a laser source in combination with relatively strong spurious reflections on the chip [22] gives rise to a noise-like ripple in the spectrum due to interference effects. Furthermore, this spectral ripple exhibits time dependence due to small temperature variations as well as vibrations and hence leads to real noise. Therefore, we opt for a less-coherent, broadband SLED followed by a tunable optical filter as the source. The SLED (thorlabs, SLD1005P) is centered at 1570 nm and the tunable optical filter (Finisar, custom WaveShaper 1000s) is scanned from 1540 nm to 1610 nm with a wavelength step δλ of 3 nm. Given the broadband features of the glucose absorption spectrum this δλ is sufficient. The filter is a Gaussian bandpass with a FWHM of 5 nm to ensure higher input power, hence SNR. Although a wider spectral range can increase the selectivity of absorption spectroscopy by probing more molecule-specific features, we are at present limited by the bandwidth of the grating couplers. The stability of our set-up was evaluated by measuring the transmission spectrum of the signal arm during 2 hours while the signal spiral is open to air. The SNR was then calculated for each wavelength as the average value divided by the standard deviation. The average SNR across all wavelengths amounts to 36.59 dB, indicating that the signal varies only by 0.022% during this long period.
4. Measurement results
4.1. Transition from air to water
In a first experiment at room temperature, we measure the transmission spectrum of pure DI water with a resolution of 5 nm. We start from a dry opto-fluidic chip and measure the transmission spectrum of the signal and reference channel Psig,air and Pref,air. Afterwards, DI water is applied to the microfluidic channel above the signal spiral to yield Psig,water. The reference channel stays in a dry state and yields the reference spectrum P ref,air2. The absorption due to water is then easily calculated as:
| (4) |
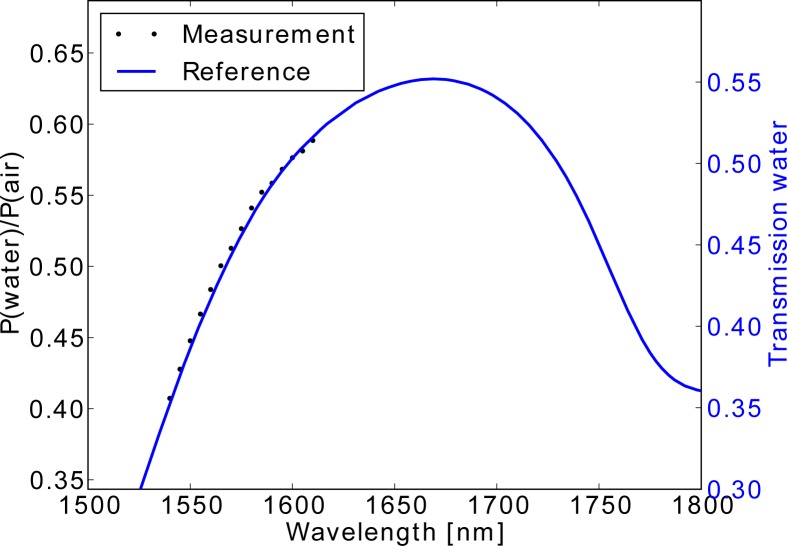
In Fig. 4, we compare the obtained Tmeasurement with the theoretically expected shape Treference. This reference curve is calculated as Treference = 10−AwLΓ with the water absorbance Aw [mm−1], confinement factor Γ and L= 10 mm, the length of our signal spiral. The water absorbance Aw is obtained from a reference measurement with a spectrophotometer (Varian Cary 500) at 20°C. The confinement factor Γ is simulated (with Fimmwave®) in function of wavelength for our rib waveguide design with a water top cladding (nclad=1.31). Note that the y-axis scale is different for Tmeasurement (left y-axis) and Treference(right y-axis). This shows that although the shape is similar, we have a difference in absolute transmission. This difference arises from the change in confinement factor and waveguide losses when changing between an air and water cladding and the small uncertainty about the absolute accuracy of our reference measurement.
Fig. 4.
Measured water transmission spectrum (left y-axis), compared to the theoretically expected water transmission calculated from a reference measurement and simulated confinement factor (right y-axis)
4.2. Switching experiment with 70 mM glucose
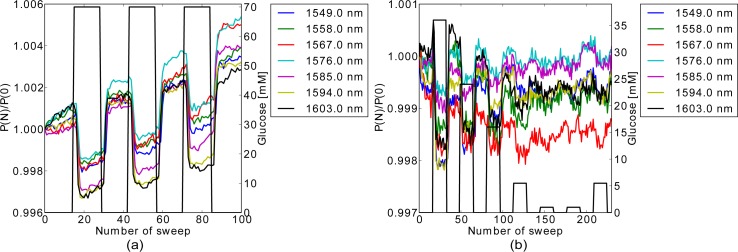
In this experiment, we monitor the signal spiral and switch three times between pure DI water and a glucose solution with a high concentration of 70 mM. This way, we can estimate if we can resolve the glucose spectrum and if our measurements are reproducible. After every 14 spectral sweeps, the selection valve is switched. The result is shown in Fig. 5(a). It shows for every spectral sweep N the transmitted power P(N) from the signal spiral, referenced to its initial value P(N=0). It is clear that the transmission drops when glucose is present, indicating the absorption due to glucose. The small delay δt between the moment of switching and the drop in transmission is due to the finite flow-time between the valve and sensing spiral. Next to the absorption dips, all wavelengths experience a slow upward drift. A different drift was measured in the reference spiral transmission, showing that, although our set-up aims at maximizing the common path, the non-common noise is still larger than the common noise.
Fig. 5.
Evolution of the detected power from the signal spiral at different wavelengths when (a) a 70mM glucose solution is applied three times and (b) when five different glucose solutions are applied. The switching moments are indicated by the black line.
This drift behavior is caused by variations in the outcoupling section of the optofluidic chip. At the fiber array interface, small deformations of the epoxy glue over time [27] due to e.g. small thermal variations, alters the position of the output fibers above the grating couplers slightly. This movement will influence the coupling efficiency from the grating couplers to the output fibers. Unfortunately, the coupling efficiency can vary differently over time for the signal and reference output fibers when a slight asymmetry in the position of the fiber array above the grating coupler array is present. This mechanical instability can be avoided in a future sensor design by directly integrating the photodiodes on top of the output grating couplers of the signal and reference arm [28]. The sensor with photodiodes can then be packaged as in [29] to allow a compact measurement set-up. For the present design, however, these variations in the outcoupling section force us to work single-beam instead of dual-beam. Still, the water absorption should be eliminated from the signal transmission spectrum to reveal the glucose signature. Therefore, we provide a time-reference of the water spectrum at regular time intervals by applying pure DI water alternated with the glucose solution.
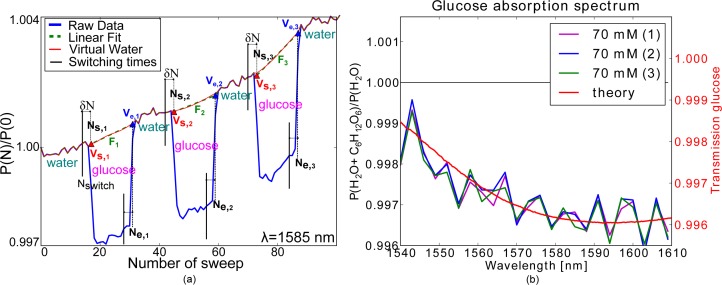
This time-reference of the water spectrum is also used to eliminate the slow drift that is present in the signal spiral. Hereto, we developed a straightforward data-processing procedure that will be explained in section 5. After this procedure, the glucose absorption spectrum can easily be retrieved. The obtained glucose absorption spectrum is shown in Fig. 6(b).
Fig. 6.
(a) Procedure to create the virtual water reference spectrum. (b) Extracted absorption spectrum for the three 70 mM solution measurements with the theoretical fit.
4.3. Experiment with different glucose concentrations
In the third experiment, we switch between five different glucose concentrations (1 mM, 5.5 mM, 16 mM, 24 mM and 36 mM) and pure DI water. The lowest concentration of 1 mM was chosen to show the detection limit. The concentration of 5.5 mM and 16 mM are respectively the mean and high extreme physiological blood glucose levels. The signal spiral transmission spectra are continuously acquired and after every 16 spectral sweeps, the valve is switched between DI water and a glucose solution. The two lowest concentrations (1 mM, 5.5 mM) were measured twice. The measurement result is shown in Fig. 5(b). A clear correlation between the change in power and the applied glucose concentration is present for the various wavelengths.
5. Analysis and discussion
In this section we first show how we process our experimental data to yield the absorption spectrum for a given glucose concentration. Secondly, we compare these extracted absorption spectra with the theoretically expected spectra based on reference data. Finally, we use the extracted absorption spectra to derive a linear regression model for glucose concentration extraction.
5.1. Virtual water absorption extraction procedure
As was explained in section 2.1, the strong water absorption dominates the absorption spectrum of an aqueous glucose solution. The water absorption thus has to be eliminated from our measured spectra to yield the glucose signature. We have access to the water absorption spectrum just before and after applying glucose. But, due to the wavelength dependent slow drift, as shown in Fig. 5, these measured water absorption spectra are not the same. Therefore, we need to create a ’virtual’ water absorption spectrum based on the interpolation of the water absorption spectra as measured before and after applying the glucose solution. The glucose absorption features are then revealed by dividing the measured aqueous glucose solution spectrum by the virtual water absorption spectrum. The algorithm to create the virtual water spectrum is performed for each wavelength individually and is graphically explained in Fig. 6(a). Firstly, we determine the delay δN and add it to the switching times Nswitch to yield the start Ns and end times Ne of the virtual water curve. The start point Vs of the virtual water curve is then calculated as the average of Navg data points with N from Ns − Navg to Ns. The end point Ve of the virtual water is similarly calculated as with N from Ne to Ne + Navg. Secondly, we fit a straight line F between Vs and Ve. We then append to this straight line a number M of data points from the water measurements before and after the glucose dip. Thirdly, this newly constructed curve is now interpolated with a polynomial of the appropriate order O to yield the virtual water curve. This virtual water curve thus accounts for the slow drift effects as evident in the measured water data points.
5.2. Extracted glucose absorption spectra
5.2.1. Switching experiment with 70 mM glucose
We extract the glucose absorption spectra for the experiment with the aqueous 70 mM glucose solution (see 4.2) by dividing the measured glucose solution spectra with the virtual water curve. The virtual water curve was extracted for δN=3 (wavelength sweeps), Navg=4, M=14 (number of used water data points) and O=7 (order of the polynomial interpolation). For each of the three glucose dips we have about 7 glucose absorption spectra which can be averaged to yield one high SNR glucose absorption spectrum. The resulting three curves are plotted in Fig. 6(b) together with the theoretically expected absorption spectrum of a 70 mM glucose solution on top of a 1 cm long spiral, based on reference data from [17] as in section 4.1. Although our measured spectra have a strong, but repeatable, periodic variation in wavelength, we obtain a good match with the theoretically expected glucose absorption. The periodic variations are caused by unwanted optical cavities due to small reflections at e.g. the grating coupler-fiber array interface. The repeatability SNR, calculated as the average of the three absorption curves divided by their standard deviation followed by wavelength-averaging, amounts to 41.95 dB.
5.2.2. Experiment with different glucose concentrations
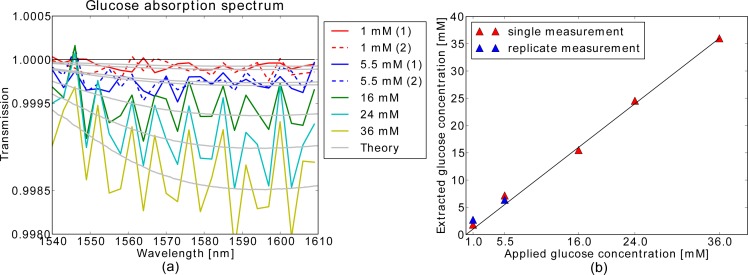
We obtain the glucose absorption spectra for the experiment with different glucose concentrations (see 4.3), by dividing the measured glucose solution spectra with the virtual water curves. The latter are calculated with δN=4 (wavelength sweeps), Navg=4, M=14 and O=7. In addition, we have averaged the various glucose absorption spectra to one high SNR absorption spectrum and this for all of the different applied glucose solutions. The result is plotted in Fig. 7(a). Again, the obtained glucose absorption spectra exhibit a strong periodic ripple. As expected, when the glucose concentration is increased, the glucose absorption is higher and the transmission decreases accordingly. The replicate measurements (1 mM, 5.5 mM) are clearly grouped with the preceding measurements of the 1mM and 5.5mM solutions. Although the absorption dips caused by the 1mM solution are very difficult to discriminate visually on Fig. 5(b), the straightforward data processing allows us to reliably extract the absorption spectrum.
Fig. 7.
(a) Extracted absorption spectrum for the different glucose solutions, compared to the theoretical fit that is obtained when using a linear regression model as shown in (b)
5.3. Linear regression model
Given the weak absorption due to glucose, the transmission is linearly dependent on the glucose concentration (T = exp(−αCgluc) ≈ 1 + αCgluc). Therefore, we derive a linear regression model in which we use the absorbance Ar = log10(T 36 mM) of the 36 mM glucose solution as the regression vector Vr = Ar/36. We do a least-squares fitting between the measured absorption spectra for every applied concentration and 10Vr·Cp, for a range of possible glucose concentrations Cp between 0 and 50 mM. The predicted glucose concentration Cpr is the value of Cp for which the least-squares sum is minimal. The predicted glucose concentrations for every applied glucose solution is plotted in Fig. 7(b). The linear trend is clearly shown. We calculate the error-of-fitting Ê of our model using the predictions Cpr of all six measurements except for 36 mM:
| (5) |
The reference values Cref are the prepared glucose concentrations. Based on the predicted glucose concentrations, we also calculated the theoretically expected absorption spectra based on the reference data from [17]. These are plotted as grey curves in Fig. 7(a). We can see that our measurements are in good agreement with the theoretically expected shape.
The performance of glucose sensors is often compared based on the 95% confidence interval (CI) [30]. If we consider the difference (Cref − Cpr) as a normally distributed variable x, then the 95% confidence interval for the mean μx can be calculated as [31]:
| (6) |
with x̄ the sample mean, s the sample standard deviation, n the number of samples and t n−1=5,α/2=0.025 calculated from the t-distribution with 5 degrees of freedom. The 95% confidence interval for the mean difference between the measured and applied glucose value is μX ∈ 0.86 ± 0.86 mM and is currently limited by the small size of our sample set of aqueous glucose solutions.
6. Prospects for glucose detection in serum
Due to slow drift in the measured power caused by variations in the outcoupling section of the optofluidic chip, we were forced to perform single-beam spectral measurements with regular time-references of the water transmission spectrum. For this experimental setting, we achieved promising results for the detection of low glucose concentrations in aqueous glucose solutions. To enhance the sensitivity of our current set-up, we propose to use integrated photo-detectors that maximize the common path between the signal and reference arm. This way, we can exploit the SNR benefits of a dual-beam system. In addition, we should modify our set-up to allow longer measurements to increase the sample set such that we can derive the true limit of detection of our in vitro glucose sensor. The present data-set is limited by the maximum physical size of the syringes that fit the microfluidics pump. To extend our measurements to more complex media such as human serum, additional modifications are needed. In physiological media, a large variety of biomolecules exist that have absorption features in the same wavelength range as glucose, e.g. urea and lactate. To decrease the influence of these interfering molecules on the glucose prediction, a larger spectral range than 1540–1610 nm needs to be measured. This larger spectral range then covers a larger number of molecule-specific features which helps to distinguish the various molecules. In addition, multivariate modeling can be used to enhance glucose detection. Previous research has shown that multivariate modeling successfully enables the concentration extraction of glucose and other bio-molecules from the near infrared absorption spectra of human serum [32, 33]. For example, a good glucose detection accuracy (RMSEP=1.16 mM) in human serum was obtained by multivariate analysis of the large wavelength range from 1500–2500 nm [33]. Currently, the wavelength range of our sensor is limited by the grating coupler bandwidth (50 nm, 3 dB). To extend the operating range, we can employ a single photonic chip with multiple spectroscopic sensors, each optimized for a certain wavelength range. It is clear that this approach holds a trade-off between technological challenges (e.g. the number of required sources) and the detection limit. It was demonstrated that using SOI technology with BCB-bonded GaSb photodiodes, a single chip can comprise a set of integrated spectrometers that covers the wavelength range from 1510–2300 nm [34]. In addition, each individual spectrometer can have a preceding evanescent sensing spiral. Both the miniature spectrometers and evanescent sensing spiral dimensions can then be optimized for a given wavelength range. Moreover, the use of multiple spiral lengths for a given wavelength range, can also improve the detection limit [35]. In addition, ring resonator sensors can be integrated next to the absorption sensor, to monitor on-chip temperature variations and changes of the flow-condition in the microfluidic channels. Further sensor multiplexing and photodiode integration in combination with advanced multivariate modeling are thus key to realize a sensitive in vitro glucose sensor that can be used for more complex physiological media.
7. Conclusion
We presented our experimental results on a silicon-based lab-on-chip device for the detection of glucose using single-beam evanescent absorption spectroscopy. The optical sensor design and source-detector configuration was optimized to create a stable experimental set-up with a long-term SNR of 36.59 dB. Using this sensor, we have measured the absorption spectrum of pure DI water and of a set of aqueous glucose solutions in a wide concentration range from 0 mM to 70 mM. All the measured spectra are in close agreement with the theoretically expected absorption shape. In addition, a linear regression model was built to correlate the measured spectra with the glucose concentration that is applied to our evanescent sensor. A small error-of-fitting of 1.14 mM is obtained. The current sensor performance is limited by fiber-packaging-induced drift which can be avoided by the use of integrated photodiodes. The integration of photodiodes will also allow for more sensitive dual-beam measurements and further miniaturization of the sensor. Although many challenges remain, the reported results are a first step in the development of an in vivo continuous glucose monitoring device based on silicon photonics.
Acknowledgments
We thank the IWT for the financial support through the SBO-GlucoSens project. Part of this work was supported by the FP7-ERC-MIRACLE and the FP7-ERC-InSpectra project. We also thank Sandeep Sharma and prof. Wouter Saeys from MeBios, KULeuven for fruitful discussions.
References and links
- 1.Ruedy K. J., Tamborlane W. V., “The landmark JDRF continuous glucose monitoring randomized trials: a look back at the accumulated evidence,” J. Cardiovasc. Transl. 5(4), 380–387 (2012) 10.1007/s12265-012-9364-9 [DOI] [PubMed] [Google Scholar]
- 2.Marquardt L. A., Arnold M. A., Small G. W., “Near-infrared spectroscopic measurement of glucose in a protein matrix,” Anal. Chem. 65(22), 3271–3278, (1993) 10.1021/ac00070a018 [DOI] [PubMed] [Google Scholar]
- 3.Yoon G., “Statistical analysis for glucose prediction in blood samples by infrared spectroscopy, inHandbook of Optical Sensing of Glucose in Biological Fluids and Tissues (CRC Press, 2008). 10.1201/9781584889755.ch4 [DOI] [Google Scholar]
- 4.Bogaerts W., Selvaraja S., Dumon P., Brouckaert J., De Vos K., Van Thourhout D., Baets R., “Silicon-on-insulator spectral filters fabricated with CMOS technology,” IEEE J. Sel. Top. Quantum Electron. 16(1), 33–44 (2010) 10.1109/JSTQE.2009.2039680 [DOI] [Google Scholar]
- 5.Velasco A. V., Cheben P., Bock P. J., Delage A., Schmid J. H., Lapointe J., Janz S., Calvo M. L., Xu D., Florjanczyk M., Vachon M., “High-resolution Fourier-transform spectrometer chipwith microphotonic silicon spiral waveguides,” Opt. Lett. 38(5), 706–708 (2013) 10.1364/OL.38.000706 [DOI] [PubMed] [Google Scholar]
- 6.Xia Z., Aftekhar A. A., Soltani M., Momeni B., Li Q., Chamanzar M., Yegnanarayanan S., Adibi A., “High resolution on-chip spectroscopy based on miniaturized microdonut resonators,” Opt. Express 19(13), 12356–12364 (2011) 10.1364/OE.19.012356 [DOI] [PubMed] [Google Scholar]
- 7.Lin P. T., Singh V., Hu J., Richardson K., Musgraves J. D., Luzinov I., Hensley J., Kimerling L. C., Agarwal A., “Chip-scale mid-infrared chemical sensors using air-clad pedestal silicon waveguides,” Lab Chip. 13, 2161–2166 (2013). 10.1039/c3lc50177a [DOI] [PubMed] [Google Scholar]
- 8.Kasberger J., Fromherz T., Saeed A., Jakoby B., “Miniaturized integrated evanescent field IR-absorption sensor: Design and experimental verification with deteriorated lubrication oil,” Vib. Spectrosc. 56, 129–135 (2011). 10.1016/j.vibspec.2011.01.003 [DOI] [Google Scholar]
- 9.Hu J., Tarasov V., Agarwal A., Kimerling L., Carlie N., Petit L., Richardson K., “Fabrication and testing of planar chalcogenide waveguide integrated microfluidic sensor,” Opt. Express 15(5), 2307–2314 (2007). 10.1364/OE.15.002307 [DOI] [PubMed] [Google Scholar]
- 10.Charrier J., Brandily M., Lhermite H., Michel K., Bureau B., Verger F., Nazabal V., “Evanescent wave optical micro-sensor based on chalcogenide glass,” Sens. Actuator B-Chem. 173, 468–476 (2012). 10.1016/j.snb.2012.07.056 [DOI] [Google Scholar]
- 11.Ma P., Choi D., Yu Y., Gai X., Yang Z., Debbarma S., Madden S., Luther-Davies B., “Low-loss chalcogenide waveguides for chemical sensing in the mid-infrared,” Opt. Express 21(24), 29927–29937 (2013). 10.1364/OE.21.029927 [DOI] [PubMed] [Google Scholar]
- 12.Nitkowski A., Chen L., Lipson M., “Cavity-enhanced on-chip absorption spectroscopy using microring resonators,” Opt. Express 16(16), 11930–11936 (2008). 10.1364/OE.16.011930 [DOI] [PubMed] [Google Scholar]
- 13.Hu J., Carlie N., Petit L., Agarwal A., Richardson K., Kimerling L. C., “Cavity-enhanced IR absorption in planar chalcogenide glass microdisk resonators: experiment and analysis,” J. Lightwave Technol. 27(23), 5240–5245 (2009). 10.1109/JLT.2009.2030899 [DOI] [Google Scholar]
- 14.Keyvaninia S., Roelkens G., Van Thourhout D., Jany C., Lamponi M., Le Liepvre A., Lelarge F., Make D., Duan G., Bordel D., Fedeli J., “Demonstration of a heterogeneously integrated III-V/SOI single wavelength tunable laser,” Opt. Express 21(3), 3784–3792 (2013) 10.1364/OE.21.003784 [DOI] [PubMed] [Google Scholar]
- 15.Spuesens T., Mandorlo F., Rojo-Romeo P., Regreny P., Olivier N., Fedeli J. M., Van Thourhout D., “Compact integration of optical sources and detectors on SOI for optical interconnects fabricated in a 200 mm CMOS pilot line,” J. Lightwave Technol. 30(11), 1764–1770 (2012). 10.1109/JLT.2012.2189871 [DOI] [Google Scholar]
- 16.Washburn A. L., Bailey R. C., “Photonics-on-a-Chip: Recent advances in integrated waveguides as enabling detection elements for real-world, Lab-on-a-Chip biosensing applications,” Analyist 136, 227–236 (2011). 10.1039/c0an00449a [DOI] [PMC free article] [PubMed] [Google Scholar]
- 17.Amerov A., Chen J., Arnold M., “Molar absorptivities of glucose and other biological molecules in aqueous solutions over the first overtone and combination regions of the near-infrared spectrum,” Appl. Spectrosc. 58(10), 1195–1204 (2004). 10.1366/0003702042336136 [DOI] [PubMed] [Google Scholar]
- 18.Bogaerts W., Selvaraja S., “Compact single-mode silicon hybrid rib/strip waveguide with adiabatic bends,” IEEE Photon. J. 3(3), 422–432 (2011) 10.1109/JPHOT.2011.2142931 [DOI] [Google Scholar]
- 19.Selvaraja S., Jaenen P., Bogaerts W., Van Thourhout D., Dumon P., Baets R., “Fabrication of photonic wire and crystal circuits in silicon-on-insulator using 193-nm optical lithography,” J. Lightwave Technol. 27(18), 4076–7083 (2009) 10.1109/JLT.2009.2022282 [DOI] [Google Scholar]
- 20.Densmore A., Xu D.-X., Waldron P., Janz S., Cheben P., Lapointe J., Delâge A., Lamontagne B., Schmid J. H., Post E., “A silicon-on-insulator photonic wire based evanescent field sensor,” IEEE Photon. Technol. Lett. 18(23), 2520–2522 (2006) 10.1109/LPT.2006.887374 [DOI] [Google Scholar]
- 21.Vermeulen D., Van Acoleyen K., Ghosh S., Selvaraja S., De Cort W., Yebo N., Hallynck E., De Vos K., Debackere P., Dumon P., Bogaerts W., Van Thourhout D., Baets R., “Efficient tapering to the fundamental quasi-TM mode in asymmetrical waveguides,” in European Conference on Integrated Optics (ECIO, 2010), paper WeP16. [Google Scholar]
- 22.Morichetti F., Canciamilla A., Ferrari C., Torregiani M., Melloni A., Martinelli M., “Roughness induced backscattering in optical silicon waveguides,” Phys. Rev. Lett. 104(3), 033902 (2010) 10.1103/PhysRevLett.104.033902 [DOI] [PubMed] [Google Scholar]
- 23.Harvey A. H., Gallagher J. S., Sengers J. L., “Revised formulation for the refractive index of water and steam as a function of wavelength, temperature and density,” J. Phys. Chem. Ref. Data 27(4), 761–774 (1998) 10.1063/1.556029 [DOI] [Google Scholar]
- 24.Li H. H., “Refractive index of silicon and germanium and its wavelength and temperature derivatives,” J. Phys. Chem. Ref. Data 9(3), 561–658 (1980) 10.1063/1.555624 [DOI] [Google Scholar]
- 25.Tan C. Z., Arndt J., “Temperature dependence of refractive index of glassy SiO2 in the infrared wavelength range,” J. Phys. Chem. Solids 61(8), 1315–1320 (2000) 10.1016/S0022-3697(99)00411-4 [DOI] [Google Scholar]
- 26.McDonald J. C., Duffy D. C., Anderson J. R., Chiu D. T., Wu H., Schueller O. J., Whitesides G. M., “Fabrication of microfluidics systems in poly(dimethylsiloxane),” Electrophoresis 21(1), 27–40 (2000) [DOI] [PubMed] [Google Scholar]
- 27.Feng C., Keong C., Hsueh Y., Wang Y., Sue H., “Modeling of long-term creep behavior of structural epoxy adhesives,” Int. J. Adhes. Adhes. 25(5), 427–436 (2005) 10.1016/j.ijadhadh.2004.11.009 [DOI] [Google Scholar]
- 28.Spuesens T., Mandorlo F., Rojo-Romeo P., Regreny P., Olivier N., Fedeli J. M., Van Thourhout D., “Compact integration of optical sources and detectors on SOI for optical interconnects fabricated in a 200 mm CMOS pilot line,” J. Lightwave Technol. 30(11), 1764–1770 (2012) 10.1109/JLT.2012.2189871 [DOI] [Google Scholar]
- 29.Kopp C., Bernabe S., Bakir B. B., Fedeli J. M., Orobtchouk R., Schrank F., Porte H., Zimmermann L., Tekin T., “Silicon photonic circuits: on-CMOS integration, fiber optical coupling, and packaging,” IEEE J. Sel. Top. Quantum Electron. 17(3), 498–509 (2011). 10.1109/JSTQE.2010.2071855 [DOI] [Google Scholar]
- 30.Langendam M., Luijf Y., Hooft L., DeVries J., Mudde A., Scholten R., “Continuous glucose monitoring systems for type I diabetes mellitus (Review),” The Cochrane Library 2, (John Wiley & Sons, 2012) [DOI] [PMC free article] [PubMed] [Google Scholar]
- 31.Feldman R., Ciriaco V., Applied Probability and Stochastic Processes (Springer, 2010) 10.1007/978-3-642-05158-6 [DOI] [Google Scholar]
- 32.Hazen K. H., Arnold M. A., Small G. W., “Measurement of Glucose and Other Analytes in Undiluted Human Serum with Near-Infrared Transmission Spectroscopy,” Anal. Chim. Acta. 371(1–2), 255–267 (1998) 10.1016/S0003-2670(98)00318-3 [DOI] [Google Scholar]
- 33.Sharma S., Goodarzi M., Delanghe J., Ramon H., Saeys W., “Using experimental data designs and multivariate modelling to assess the effect of glycated serum protein concentration on glucose prediction from near infrared spectra of human serum,” Appl. Spectrosc. (accepted). [DOI] [PubMed]
- 34.Ryckeboer E.M.P., Gassenq A., Muneeb M., Hattasan N., Pathak S., Cerutti L., Rodriguez J.-B., Tournie E., Bogaerts W., Baets R., Roelkens G., “Silicon-on-insulator spectrometers with integrated GaInAsSb photodiodes for wide-band spectroscopy from 1510 to 2300 nm,” Opt. Express 21(5), 6101–6108 (2013) 10.1364/OE.21.006101 [DOI] [PubMed] [Google Scholar]
- 35.Liu R., Xu K., Lu Y., Sun H., “Combined optimal-pathlengths method for near-infrared spectroscopy analysis,” Phys. Med. Biol 49, 1217–1225 (2004) 10.1088/0031-9155/49/7/009 [DOI] [PubMed] [Google Scholar]


