

Abstract
Most previously described immunohistochemical markers of cervical high-grade squamous intraepithelial lesion (HSIL) and squamous cell carcinoma may help to improve diagnostic accuracy but have a minimal prognostic value. The goals of the current study were to identify and validate novel candidate biomarkers that could potentially improve diagnostic and prognostic accuracy for cervical HSIL and squamous cell carcinoma. Microdissected tissue sections from formalin-fixed paraffin-embedded normal ectocervical squamous mucosa, low-grade squamous intraepithelial lesion (LSIL), HSIL and squamous cell carcinoma sections were analyzed by mass spectrometry-based shotgun proteomics for biomarker discovery. The diagnostic specificity of candidate biomarkers was subsequently evaluated by immunohistochemical analysis of tissue microarrays. Among 1750 proteins identified by proteomic analyses, keratin 4 (KRT4) and keratin 17 (KRT17) showed reciprocal patterns of expression in the spectrum of cases ranging from normal ectocervical squamous mucosa to squamous cell carcinoma. Immunohistochemical studies confirmed that KRT4 expression was significantly decreased in squamous cell carcinoma compared with the other diagnostic categories. By contrast, KRT17 expression was significantly increased in HSIL and squamous cell carcinoma compared with normal ectocervical squamous mucosa and LSIL. KRT17 was also highly expressed in immature squamous metaplasia and in endocervical reserve cells but was generally not detected in mature squamous metaplasia. Furthermore, high levels of KRT17 expression were significantly associated with poor survival of squamous cell carcinoma patients (Hazard ratio = 14.76, P = 0.01). In summary, both KRT4 and KRT17 expressions are related to the histopathology of the cervical squamous mucosa; KRT17 is highly overexpressed in immature squamous metaplasia, in HSIL, and in squamous cell carcinoma and the level of KRT17 in squamous cell carcinoma may help to identify patients who are at greatest risk for cervical cancer mortality.
Keywords: cervical cancer, biomarkers, diagnosis, prognosis
Cervical cancer is the second leading cause of death among women worldwide, but is a less common cause of cancer mortality in most industrialized nations, due largely to the success of cervical cancer screening cytology (the ‘Pap test’). In the United States, 12200 new diagnoses and 4200 cancer deaths were reported in 2012.1 In addition, three million cervical cytology specimens have abnormal cytologic findings that require further evaluation by colposcopy.2 Although high-risk human papilloma virus (HPV) testing is widely used to improve the accuracy of cervical cancer screening, positive test results have poor specificity for underlying high-grade squamous intraepithelial lesion (HSIL) or squamous cell carcinoma in patients with a cytologic diagnosis of atypical squamous cells of undetermined significance (ASC-US) or low-grade squamous intraepithelial lesion (LSIL), because most of the HPV infections are transient and are unlikely to result in malignant transformation.3 The histologic classification of HSIL can also be problematic, due to a variety of technical issues or diagnostic challenges that contribute to both false negative or false positive diagnoses. While p16INK4a/Ki-67 dual stain approaches and other biomarkers may provide an objective basis to support the histologic diagnosis of HSIL and squamous cell carcinoma, most are expressed in a high proportion of LSILs.4–8
Therefore, there remains an important clinical need to identify new cervical cancer biomarkers that could improve specificity for the detection of HSIL/squamous cell carcinoma vs normal/LSIL in tissue biopsies, to focus resources on treatment of patients that are most likely to benefit from colposcopy and subsequent treatment intervention, and avoid over-treatment of patients who are likely to have only transient HPV infections.9 Furthermore, the validation of prognostic markers in squamous cell carcinoma patients could improve their clinical management. In clinical practice, most squamous cell carcinoma patients undergo radical hysterectomy and may also undergo post-operative chemotherapy and radiotherapy based on the tumor stage. However, clinical outcomes following treatment of these patients vary significantly.10,11 Few studies have attempted to identify biomarkers to predict overall survival of squamous cell carcinoma patients, but the results are not satisfactory.5–8,12–15 The aims of this study were to identify and validate other candidate biomarkers for HSIL and squamous cell carcinoma, including keratin 4 (KRT4) and keratin 17 (KRT17), and to evaluate KRT17 as a potential prognostic biomarker for patients with cervical squamous cell carcinoma.
Materials and methods
Patient Samples
The study included 124 formalin-fixed paraffin-embedded surgical tissue blocks that were retrospectively selected from the archival collections of the Stony Brook BioBank, in compliance with IRB-approved protocols at Stony Brook Medicine (Table 1). All surgical tissue blocks were obtained from patients who underwent care from 1989 to 2011. The criteria for selection were (i) cases with pathology diagnosis of normal ectocervical squamous or unremarkable normal ectocervical squamous mucosa (normal ectocervical squamous mucosa), LSIL (CIN1), HSIL (CIN2/3), primary squamous cell carcinoma of the cervix; (ii) age of patients ≥18 years at the time of diagnosis. Patients with a diagnosis of cancer at other anatomic sites were excluded from the study. In all cases, histologic review was performed by review of hematoxylin and eosin (H&E) stained slides to confirm that diagnostic tissue, as originally reported, was represented in the residual tissue block. Cases that were initially classified as CIN1 were reclassified as LSIL and cases that were reported as CIN2 or CIN3 were classified as HSIL. All other cases reclassified as originally reported, without revision of the initial diagnoses. Cases that had insufficient residual tissue were excluded from the study. Squamous cell carcinomas were classified by clinical stage,16 tumor grade, and lymph-node status (Table 1). Survival data were obtained from Stony Brook Medicine's Cancer Registry.
Table 1. Demographic and clinical characteristics of cases.
| Biomarker discovery (n=22) |
Diagnostic validation (n=102) |
Survival analysis (n=65) |
|
|---|---|---|---|
| Age at diagnosis | |||
| x (Min – Max) | 37 (19–60) | 39 (19–78) | 51 (28–78) |
| Histology diagnostic category | |||
| Normal cervical mucosa | Total of 22 | 25 | |
| LSIL | 25 | ||
| HSIL | 27 | ||
| SCC | 25 | 65 | |
| Clinical stagea | |||
| TI | 43 | ||
| TII | 4 | ||
| TIII | 18 | ||
| Tumor grade | |||
| Low grade—G1 | 36 | ||
| High grade—G2 and G3 | 29 | ||
| Lymph-node status | |||
| Negative—N0 | 31 | ||
| Positive—N1 | 25 | ||
| Not assessed—NX | 9 |
LSIL, low-grade squamous intraepithelial lesion; HSIL, high-grade squamous intraepithelial lesion; SCC, squamous cell carcinoma.
According to the AJCC cancer staging manual and the future of TNM on Annals of Surgical Oncology 17(6), 1471–1474.
Biomarker Discovery and Analysis
Sample preparation
A total of 22 formalin-fixed paraffin-embedded tissues from all diagnostic categories were used for proteomic analysis. Normal cervical mucosa, LSIL, HSIL, and squamous cell carcinoma from H&E-stained tissue sections were dissected by laser capture microscopy (Zeiss P.A.L.M.), collecting 540 000–650 000 cells from each diagnostic category. Dissected tissues were pooled from each diagnostic category for homogenization (Figure 1). Formalin-fixed, paraffin-embedded tissues were first incubated in 50 mM ammonium bicarbonate (pH 9) with protease cocktails (Roche, Branford, CT, USA) at 65 °C for 3h to facilitate the reverse of protein crosslinking. Then, tissues were homogenized in 4M urea in 50 mM ammonium bicarbonate (pH 7) with Invitrosol™ (Invitrogen, Carlsbad, CA, USA) and RapiGest™ (Waters Corporation, Milford, MA, USA).17 The protein concentration was determined using an EZQ protein assay (Invitrogen).
Figure 1.
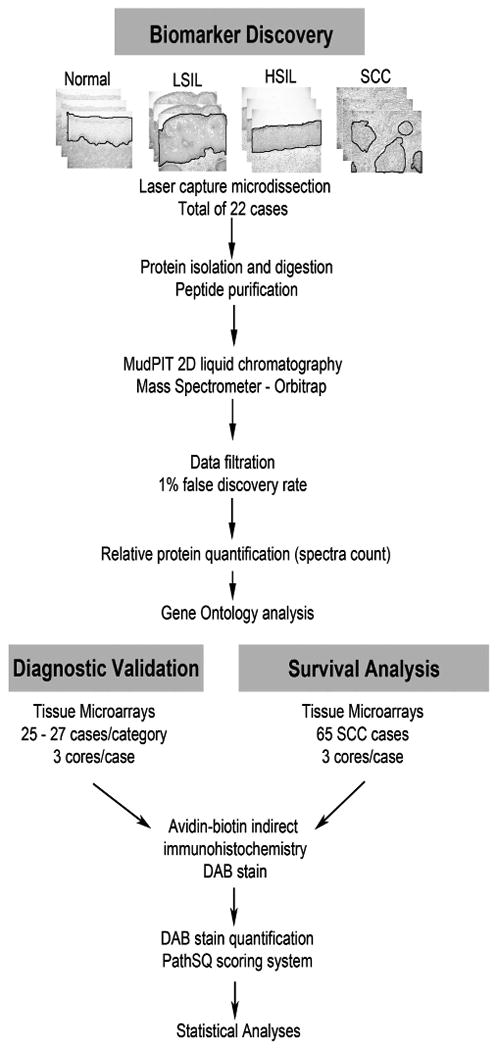
Experimental design for mass spectrometry-based biomarker discovery and immunohistochemical-based biomarker validation. Normal: normal ectocervical squamous mucosa; LSIL: low-grade squamous intraepithelial lesion; HSIL: high-grade squamous intraepithelial lesion; SCC: squamous cell carcinoma.
Trypsin digestion
In all, 10 μg of tissue lysates was diluted in 50 mM ammonium bicarbonate for trypsin digestion. Modified trypsin for sequencing grade (Promega, Fitchburg, WI) was added to each sample at a ratio of 1:30 enzyme/protein along with 2 mM CaCl2 and incubated for 16 h at 37 °C. Following digestion, all reactions were acidified with 90% formic acid (2% final) to stop proteolysis. Then, samples were centrifuged for 30 min at 14 000 r.p.m. to remove insoluble materials. The soluble peptide mixtures were collected for liquid chromatography-tandem mass analysis.
Multidimensional chromatography and tandem mass spectrometry
Peptide mixtures were pressure loaded onto a 250-μm inner diameter (i.d.) fused-silica capillary packed first with 3 cm of 5 μm strong cation exchange material (Partisphere SCX, Whatman), followed by 3 cm of 10 μm C18 reverse phase (RP) particles (Aqua, Phenomenex, CA, USA). Loaded and washed microcapillaries were connected via a 2-μm filtered union (UpChurch Scientific) to a 100-μm i.d. column, which had been pulled to a 5-μm i.d. tip using a P-2000 CO2 laser puller (Sutter Instrument, Novato, CA, USA), then packed with 13 cm of 3 μm C18 RP particles (Aqua, Phenomenex) and equilibrated in 5% acetonitrile, 0.1% formic acid (Buffer A). This split column was then installed in line with a Nano-liquid chromatography Eskigent high-performance liquid chromatography pump. The flow rate of channel 2 was set at 300 nl/min for the organic gradient. The flow rate of channel 1 was set to 0.5 μl/min for the salt pulse. Fully automated 13-step chromatography runs were carried out. Three different elution buffers were used: 5% acetonitrile, 0.1% formic acid (Buffer A); 98% acetonitrile, 0.1% formic acid (Buffer B); and 0.5 M ammonium acetate, 5% acetonitrile, 0.1% formic acid (Buffer C). In such sequences of chromatographic events, peptides are sequentially eluted from the SCX resin to the RP resin by increasing salt steps (increase in Buffer C concentration), followed by organic gradients (increase in Buffer B concentration). The last chromatography step consisted of a high salt wash with 100% Buffer C followed by an acetonitrile gradient. The application of a 2.5-kV distal voltage electrosprayed the eluting peptides directly into an LTQ-Orbitrap XL mass spectrometer equipped with a Nano-liquid chromatography electrospray ionization source (Thermo Finnigan, San Jose, CA, USA). Full mass spectrometry spectra were recorded on the peptides over a 400 to 2000 m/z range by the Orbitrap followed by five tandem mass events sequentially generated by LTQ in a data-dependent manner on the first, second, third, and fourth most intense ions selected from the full mass spectrometry spectrum (at 35% collision energy). Mass spectrometer scan functions and high-performance liquid chromatography solvent gradients were controlled by the Xcalibur data system (Thermo Finnigan).
Database search and interpretation of tandem mass spectrometry data sets
Spectra from triplicate runs were merged from each category for data analysis. Tandem mass spectra were extracted from raw files, and a binary classifier, previously trained on a manually validated data set, was used to remove the low-quality tandem mass spectra. The remaining spectra were searched against a human protein database containing 69711 protein sequences downloaded as FASTA-formatted sequences from UniProtKB18 and 124 common contaminant proteins, for a total of 69835 sequence entries. To calculate confidence levels and false positive rates, we used a decoy database containing the reverse sequences of 69835 proteins appended to the target database,19 and the SEQUEST algorithm20,21 to find the best matching sequences from the combined database. SEQUEST searches were done using the Integrated Proteomics Pipeline (IP2, Integrated Proteomics Applications, San Diego, CA, USA) on Intel Xeon X5450 X/3.0 PROC processor clusters running under the Linux operating system. The peptide mass search tolerance was set to 50 p.p.m. No differential modifications were considered. No enzymatic cleavage conditions were imposed on the database search; therefore, the search space included all candidate peptides whose theoretical mass fell within the 50 p.p.m. mass tolerance window, despite their tryptic status.
The validity of peptide/spectrum matches was assessed in the Scaffold software20 using SEQUEST-defined parameters, the cross-correlation score (XCorr), and normalized difference in cross-correlation scores (DeltaCN). The search results were grouped by charge state (+1, +2, and +3) and tryptic status (fully-, half-, and non-tryptic), resulting in nine distinct subgroups. In each one of the subgroups, the distribution of XCorr and DeltaCN values for (a) direct and (b) decoy database hits was obtained, and the two subsets were separated by quadratic discriminant analysis. Outlier points in the two distributions (eg, matches with very low Xcorr but very high DeltaCN) were discarded. Full separation of the direct and decoy subsets is not generally possible; therefore, the discriminant score was set such that a false positive rate of 1% was determined based on the number of accepted decoy database peptides. This procedure was independently performed on each data subset, resulting in a false positive rate independent of tryptic status or charge state. In addition, a minimum sequence length of seven amino-acid residues was required, and each protein on the final list was supported by at least two independent peptide identifications unless otherwise specified. These additional requirements, especially the latter, resulted in the elimination of most decoy database and false positive hits, as these tended to be overwhelmingly present as proteins identified by single peptide matches. After this last filtering step, the false identification rate was reduced to below 1%. Global normalization was performed by the Scaffold software (Proteome Software, Portland, OR, USA). Gene Ontology22 was used to determine the subcellular localization of identified proteins.
Diagnostic Validation by Immunohistochemical Analysis
To validate the proteomic profile data, we constructed tissue microarrays of 25–27 cases per diagnostic category (Figure 1). Each case contained up to three core replicates, with the exception of 12 LSIL cases, which contained only one core due to the small size of the lesions. Slides were reviewed and areas containing normal cervical mucosa, LSIL, HSIL, and squamous cell carcinoma were marked on glass slides. Three-mm punches were then taken from the corresponding regions of the paraffin blocks and placed into tissue microarray blocks. In addition, a commercial tissue microarray containing 40 additional squamous cell carcinoma cases from HISTO-Array™ tissue arrays (IMGENEX, San Diego, CA, USA) was purchased. After incubation at 60 °C for 1h, tissue microarray slides were deparaffinized in xylene and rehydrated using graded alcohols. Antigen retrieval was performed in citrate buffer (20 mmol, pH 6.0) at 120 °C for 10 min in a decloaking chamber. Endogenous peroxidase was blocked by applying 3% hydrogen peroxide for 5 min. Sections were subsequently blocked in 5% horse serum. Primary antibodies used were mouse monoclonal-[E3] anti-human KRT17 antibody (ab75123, Abcam, Cambridge, MA, USA; 4 °C overnight) and mouse monoclonal-[6B10] anti-human KRT4 antibody (vp-c399, Vector Laboratories, Burlingame, CA; 1:150 1h room temperature). After incubation with the primary antibody, slides were processed by an indirect avidin-biotin-based immunoperoxidase method using biotinylated horse secondary antibodies (R.T.U. Vectastain Universal Elite ABC kit; Vector Laboratories, Burlingame, CA, USA), developed in 3,3′ diaminobenzidine (DAB) (K3468, Dako, Carpentaria, CA, USA), and counterstained with hematoxylin. Negative controls were performed on all cases using an equivalent concentration of a subclass-matched mouse immunoglobulin, generated against unrelated antigens, in place of primary antibody. Slides were scored by PathSQ, a manual semiquantitative scoring system, which quantifies the percentage of strongly stained cells, blinded to the corresponding clinical data.
Statistical Analysis
The unit of measurement for immunohistochemical analysis was each core and the average PathSQ score of all cores was used for statistical analyses. The score differences between diagnostic categories were determined by Kruskal–Wallis or Wilcoxon rank-sum test. Receiver operating curves and the area under the curve were calculated to evaluate the biomarker potential to discriminate different diagnostic categories based on the logistic regression models. The optimal cutoff value from receiver operating curves was determined using Youden's index.23 For KRT4, the optimal cutoff value in the resultant receiver operating curve corresponded to ≥6% of positive cells, whereas for KRT17, the optimal cutoff value in the resultant receiver operating curve corresponded to ≥8% of positive cells for PathSQ score. Sensitivity, specificity, positive predictive value, negative predictive value, and misclassification rates were calculated corresponding to the optimal cutoff values. Pearson's correlation coefficient was used to evaluate the correlation between KRT17 expression and other quantitative variables such as age of patient and time of tissue storage. Overall survival was defined from the time of surgery to death or last follow-up if still alive. The association between KRT17 expression and overall survival was estimated through univariate Cox proportional hazard models. Assumption for Cox proportional hazard model was confirmed. To display Kaplan–Meier curves of overall survival, we further divided the squamous cell carcinoma cases into two groups according to the KRT17 expression level: High KRT17 level vs low KRT17 level, measured by PathSQ. The best cutoff point was chosen according to the lowest Akaike's information criterion from a Cox proportional-hazard regression model. A data-driven cutoff point of 52.5% of positive cells (64th percentile of total cases) was used to classify patients into two groups: high level of KRT17 (high KRT17), PathSQ score ≥52.5% of positive cells and low level of KRT17 (low KRT17) <53% of positive cells. In fact, any cutoff point within the interval of 52–53 (63rd to 65th percentiles) resulted in virtually the same Akaike's information criterion values for Cox proportional hazard models. The midpoint of the Cox proportional hazard model 52.5% (reported here as ≥50%) was used in the Kaplan–Meier curves of overall survival in squamous cell carcinoma patients. Log-rank test was used to compare overall survival between squamous cell carcinoma patients with high KRT17 levels and low KRT17 levels. The association between overall survival and other squamous cell carcinoma factors (age, stage, grade, and lymph-node status) was studied through Kaplan–Meier estimate and log-rank tests. Hazard ratio and 95% CI were calculated based on the Cox proportional hazard regression models. Statistical significance was set at 0.05 and analysis was done using SAS 9.3 (SAS Institute, Cary, NC, USA) and SigmaPlot 11 (Systat Software, San Jose, CA, USA).
Results
Biomarker Discovery and Candidate Selection
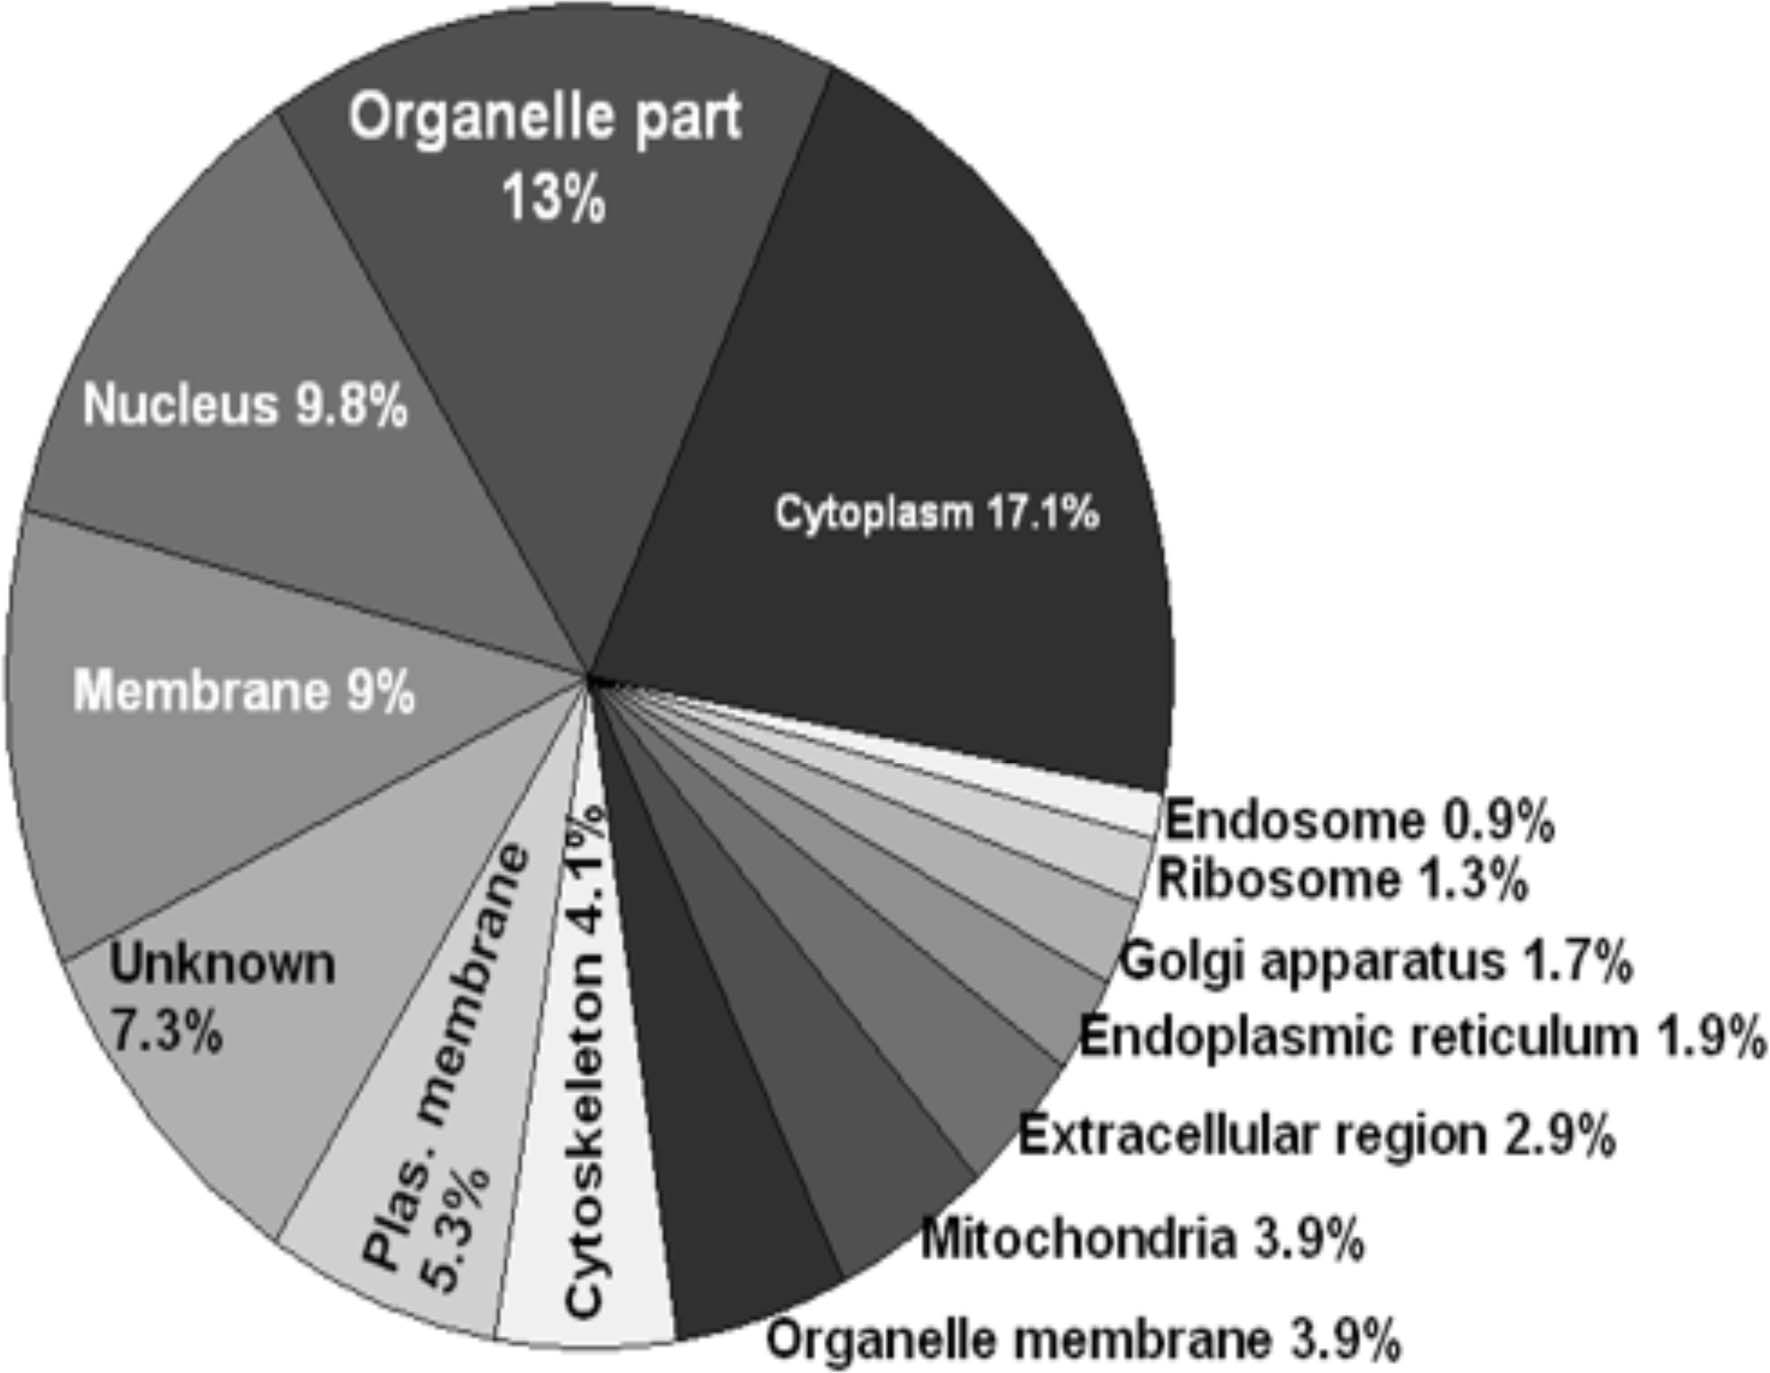
Lesional epithelial cells from 22 formalin-fixed paraffin-embedded tissues, including normal cervical mucosa, LSIL, HSIL, and squamous cell carcinoma were processed by laser capture microdissection for proteomic analysis. Collected cells from multiple patients in each category were pooled to identify the most robust and consistent differences in protein abundance. Proteins were extracted from formalin-fixed paraffin-embedded tissues using mass spectrometry-compatible lysis buffer (see Materials and methods) and analyzed using a high-resolution mass spectrometer, LTQ-OrbitrapXL. Using the 2D liquid chromatography-tandem mass analysis approach, we identified 1750 proteins at 1% false discovery rate and derived relative quantification of these proteins among the categories using the spectral counting method24 (Supplementary Table S1). To examine the comprehensive sampling of formalin-fixed paraffin-embedded tissues by shotgun proteomic analysis, we assessed the cellular localization of identified proteins by the Gene Ontology database and showed that proteins were identified from a diverse range of subcellular locations supporting the utility of analyzing formalin-fixed paraffin-embedded tissues (Supplementary Figure S1). To select candidate biomarkers, we first selected proteins with at least two-fold differences based on the spectral counts among diagnostic categories and narrowed down this list further by selecting protein expression profiles indicative of disease progression. On the basis of these criteria, two candidate biomarkers KRT17 and KRT4 were selected for further validation. These two proteins show an opposite trend in the progression of normal to squamous cell carcinoma. KRT17 shows an increased expression from normal to LSIL, to HSIL, and to squamous cell carcinoma, whereas KRT4 shows a decreased expression in the progression of normal to squamous cell carcinoma (Supplementary Table S1, in bold).
KRT4 and KRT17 as Diagnostic Markers
To determine the diagnostic values of KRT4 and KRT17 in one or more of the diagnostic categories, immunohistochemical staining was performed for KRT4 and KRT17 on tissue microarrays of archived patient tissues from four diagnostic categories: normal, LSIL, HSIL, and squamous cell carcinoma. Immunostained slides were scored by PathSQ, which quantifies the percentage of strong-positively stained cells. Immunohistochemical analysis for KRT4 showed cytoplasmic expression in normal, in LSIL and in some of the HSILs but was significantly reduced in squamous cell carcinomas (Figures 2a and b). The loss of KRT4 had a sensitivity of 68% (95% CI: 46–85%) and a specificity of 61% (95% CI: 49–72%) to distinguish squamous cell carcinoma from other diagnostic categories (Table 2). The positive predictive value, negative predictive value, area under the curve for the receiver operating curve model, and misclassification rate are included in Table 2. According to the PathSQ cutoff value (≥ 6% of positive cells), 84% of normal cases, 44% of LSILs, 55% of HSILs, and 32% of squamous cell carcinoma cases were positive for KRT4.
Figure 2.
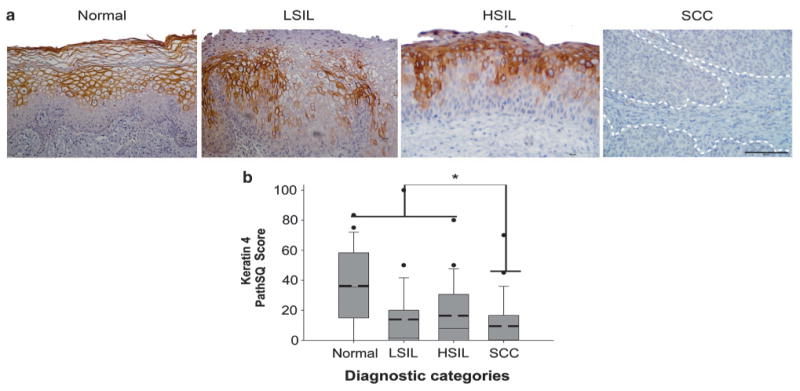
Detection of Keratin 4 expression in squamous cell carcinoma. (a) Keratin 4 (KRT4) immunohistochemical staining in representative cases. Normal: normal ectocervical squamous mucosa; LSIL: low-grade squamous intraepithelial lesion; HSIL: high-grade squamous intraepithelial lesion; SCC: squamous cell carcinoma. The scale bar represents 50 μm. (b) Expression data of KRT4 in each diagnostic category based on the PathSQ immunohistochemical scores, and based on the percentage of positive with strong staining (n = 25–27 cases per diagnostic category). Mean value (bold dashed line) and median (solid line). *P>0.001 by Kruskal–Wallis and Wilcoxon rank-sum test.
Table 2. Keratin 4 and 17 receiver operating curve (ROC) analysis and misclassification rate results between different diagnostic categories according to PathSQ score.
| Biomarker | Grouping | Score | AUC(95% CI) | Sensitivity (95% CI) | Specificity (95% CI) | PPV (95%CI) | NPV (95% CI) | Misclassification error rate (95% CI) |
|---|---|---|---|---|---|---|---|---|
| Keratin 4 | SCC (n = 25) vs other categorical (n = 77) | PathSQ | 66 (55–77) | 68 (46–85) | 61 (49–72) | 36 (23–52) | 85 (72–93) | 37 (27–47) |
| Keratin 17 | HSIL + SCC (n = 52) vs Normal + LSIL (n = 50) | PathSQ | 96 (92–99) | 94 (83–98) | 86 (73–94) | 87 (75–94) | 93 (82–98) | 9 (4–17) |
AUC, area under the curve; CI, confidence interval; PPV, positive predictive value; NPV, negative predictive value; SCC, squamous cell carcinoma; HSIL, high-grade squamous intraepithelial lesion; LSIL, low-grade squamous intraepithelial lesion.
KRT17 immunohistochemical staining demonstrated a reciprocal pattern of cytoplasmic expression compared with that seen in KRT4; KRT17 was detected in most of the HSILs and squamous cell carcinomas but was generally detected at low levels in normal squamous mucosa, including ectocervical squamous mucosa, and LSIL (Figures 3a and b). KRT17 had a sensitivity of 94% (95% CI: 73–94%) and a specificity of 86% (95% CI: 73–94%) to distinguish HSIL/squamous cell carcinoma from normal mucosa/LSIL (Table 2). The positive predictive value, negative predictive value, area under the curve, and misclassification error rate values are included in Table 2. Based on the PathSQ cutoff value (≥8% of positive cells), all normal cases are negative, 27% of LSIL cases were positive, and 96% of HSIL cases and 92% of squamous cell carcinoma cases were positive. Thus, our results suggest that KRT17 expression can distinguish patients with malignant lesions (HSIL or squamous cell carcinoma) with both high sensitivity and specificity from patients with non-malignant transient infections (LSIL) or healthy individuals with normal cervical mucosa.
Figure 3.
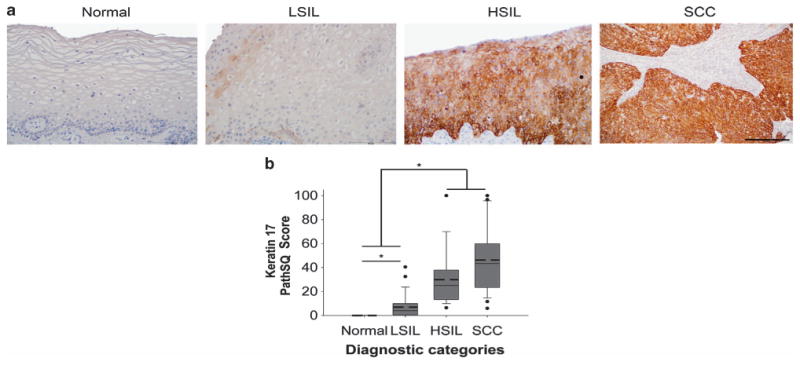
Detection of Keratin 17 in high-grade squamous intraepithelial lesion and squamous cell carcinoma. Normal: normal ectocervical squamous mucosa; LSIL: low-grade squamous intraepithelial lesion; HSIL: high-grade squamous intraepithelial lesion; SCC: squamous cell carcinoma. (a) Keratin 17 (KRT17) immunohistochemical staining in representative cases from each diagnostic category. Note that focal staining of basal cells in normal ectocervical squamous mucosa was seen in 2/25 patients (not shown). The scale bar represents 50 μm. (b) Expression data of KRT17 in each diagnostic category based on the PathSQ immunohistochemical scores, determined by the percentage of positive with strong staining (n = 25–27 cases per diagnostic category). Mean value (bold dashed line) and median (solid line). *P>0.05 by Kruskal–Wallis and Wilcoxon rank-sum test.
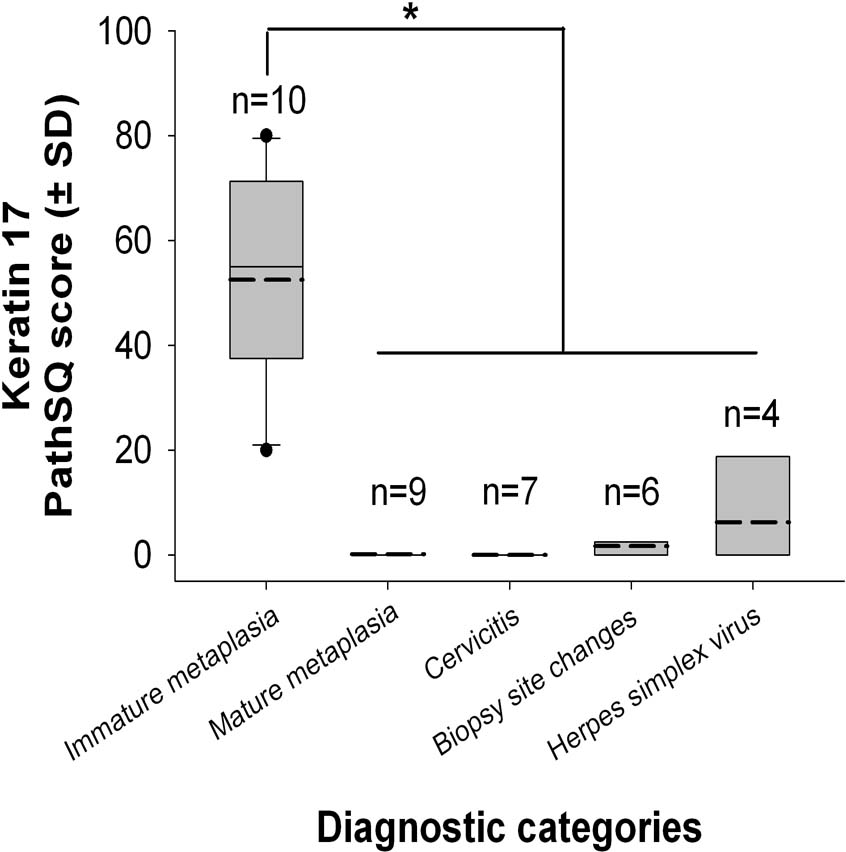
Next, we examined disease-independent parameters, including patient age and storage time of tissues, to determine if any factor influenced the reliability of KRT17 as a biomarker for HSIL and squamous cell carcinoma cases. No significant correlation between KRT17 expression and the age of patients or length of tissue storage was found (r = 0.02 and r = − 0.40, with P-values > 0.05, respectively). Furthermore, no statistically significant change in KRT17 expression was found in cases with cervicitis, mature squamous metaplasia, biopsy site changes (wound healing), or herpes simplex virus infection (Supplementary Figure S2). KRT17, however, was detected in immature squamous metaplasia (Supplementary Figures S2 and S3) and in endocervical reserve cells. From 17 cases with endocervical mucosa, 70% (12/17) had positive staining in reserve cells. Finally, there was no statistically significant correlation between the KRT17 expression and different high-risk HPV types in squamous cell carcinoma patients (Supplementary Figure S4).
Positive Association Between KRT17 Expression and Poor Prognostic Outcome of Squamous Cell Carcinoma Patients
Given the high sensitivity and specificity of KRT17 to distinguish high-grade lesions from normal mucosa and LSIL, we further examined an additional 40 squamous cell carcinoma cases to determine whether KRT17 had a prognostic value for patient survival. On the basis of the Cox proportional hazard model, KRT17 expression was significantly associated with reduced overall survival in squamous cell carcinoma patients (P = 0.009). The midpoint of the Cox proportional hazard models strong staining in ≥50% of tumor cells was used as the threshold to separate squamous cell carcinoma cases for overall patient survival in the Kaplan–Meier curves (Figure 4).
Figure 4.
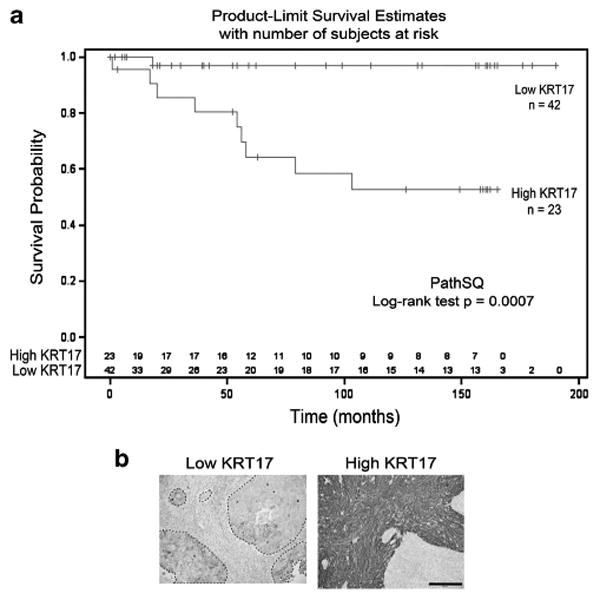
Kaplan–Meier curves of the overall survival of patients diagnosed with squamous cell carcinoma with high or low KRT17 expression. (a) Results are shown for 65 squamous cell carcinoma cases with high-KRT17 vs low-KRT17 PathSQ scores. (b) Immunohistochemical staining of KRT17 in representative squamous cell carcinoma cases with low- or high-KRT17, respectively. Images were taken at × 20 magnification. The scale bar represents 100 μm.
Five-year survival rates of squamous cell carcinoma patients with low KRT17 expression were estimated at 96.97% (95% CI: 80.37–99.57%). Conversely, 5-year survival rates of squamous cell carcinoma patients with high KRT17 expression were estimated at 64.31% (95% CI: 39.2–81.21%). A similar trend was observed at the 10-year survival rates of squamous cell carcinoma patients. Ten-year survival rates of squamous cell carcinoma patients with low KRT17 expression were estimated at 96.97% (95% CI: 80.37–99.57%), but 10-year survival rates of squamous cell carcinoma patients with high KRT17 expression were estimated at 52.61% (95% CI: 28.33–72.11%). Although KRT17 expression was associated with overall patient survival, KRT17 expression was not significantly related to tumor stage, histological grade, or lymph-node status (Supplementary Figure S5). Collectively, our data indicate that high KRT17 expression is associated with poor overall survival of squamous cell carcinoma patients (Hazard ratio = 14.76, 95% CI 1.87–116.58, P = 0.01, Figure 4).
Discussion
Previously described cervical cancer biomarkers, including HPV and proteins, that promote aberrant cell-cycle progression (eg, p16INK4a, Ki-67, mini-chromosome maintenance proteins and topoisomerase IIα) have limited specificity for HSIL/squamous cell carcinoma.4–8,25,26 High-risk HPV DNA testing of cytology specimens has enabled more accurate cervical cancer screening but is generally not used as an adjunct for the histologic diagnosis of squamous cell carcinoma or associated precursor lesions because most of the HSILs and squamous cell carcinomas harbor relatively low copies of the HPV genome/cell. Further, while HPV DNA viral integration into the host genome or other transforming events that result in unregulated overexpression of E6 and E7 may lead to malignant transformation, most of the HPV infections resolve spontaneously within 2 years.3,27 Thus, discovery of new biomarkers for HSIL could be used to better identify patients who are most likely to benefit from aggressive clinical intervention.
This study demonstrates the utility of performing comprehensive proteomic analysis of laser captured microdissected formalin-fixed paraffin-embedded specimens for identifying potential diagnostic and prognostic biomarkers of cervical cancer. Previous studies of large-scale proteomic profiling from whole tumor tissues yielded protein expression profiles based on the heterogeneous cell populations with variability in the proportion of cancer cells vs benign tissue components (including stromal cells, lymphocytes, and other benign mucosal tissue components). In our study, we used microdissected tissues to facilitate the molecular analysis of more homogeneous cell populations that are captured directly from their tissue microenvironment. We chose to use formalin-fixed paraffin-embedded tissues for biomarker discovery, because formalin fixation and paraffin embedding is universally used for the histologic preservation and diagnosis of clinical tissue specimens, and formalin-fixed paraffin-embedded tissues are more readily available in large amounts than fresh or frozen tissues. We also chose clinically relevant categories such as LSILs and HSILs for biomarker discovery. Finally, the use of formalin-fixed paraffin-embedded tissues allows us to access sufficient numbers of patient samples for statistical assessment of potential correlations between the biomarker expression and clinicopathologic parameters.
On the basis of the expression profile from proteomic analysis, we observed that KRT4 expression is lost while there is a reciprocal overexpression of KRT17 in most of the HSILs and squamous cell carcinomas. We noticed that normal ectocervical squamous mucosa (only focal basal cell staining seen in 2/75 sections), mature squamous metaplasia, or benign endocervical cells express low levels of KRT17; however, immature squamous metaplasia and in endocervical reserve cells show high levels of KRT17. Thus, the staining in immature metaplastic or reserve cells could potentially limit the utility of KRT17 as a ‘stand-alone’ marker of HSIL/squamous cell carcinoma. Co-localization with other molecular markers expressed in the transformed cervical mucosa may extend the diagnostic utility of KRT17 for immunohistochemical or immunocytochemical applications. We also notice that 27% of the LSILs were positive for KRT17 expression, similar to the reported level of p16INK4a expression in LSILs.28–30 Thus, further studies are needed to explore the prognostic value of KRT17 expression for patients with CIN1 lesions or its utility of distinguishing CIN1 from CIN2 lesions in patients. Finally, our current findings confirm increased expression of KRT17 in cervical squamous cell carcinomas reported by previous immunohistochemical studies, although the reported KRT17 expression in high-grade dysplasia (CIN2/3 or HSIL) has been inconsistent.31–36 For example, previous studies found that KRT17 is expressed in at least some CIN2/CIN3 lesions, but others reported that KRT17 is not detected in ‘dysplastic cells’ of CIN3.35 In our study, we found clear evidence that KRT17 is positively stained (defined as PathSQ ≥8% of cells) in 96% of HSILs. Thus, inconsistency of KRT17 expression in previous studies may reflect differences in tissue processing, immunohistochemical methods, or in the scoring strategy used to report KRT17 expression in patient samples.
In addition to its utility as a diagnostic marker for HSILs and squamous cell carcinomas, we also showed that high KRT17 expression is significantly associated with poor overall survival in squamous cell carcinoma patients. Although much has been learned about E6 and E7 and the molecular pathogenesis of HSIL,27 little is known about the molecular events that promote aggressive biologic potential in some squamous cell carcinomas while other cases are more likely to be successfully treated by chemotherapeutic intervention. Although the histologic assessment of squamous cell carcinomas provides prognostic data to guide treatment management of patients based on tumor grade, depth of invasion, surgical margin status, involvement of adjacent tissues and local or distant metastases, there is a real clinical need to find other approaches that could provide more accurate prognostic information.6–8 Our data suggest that KRT17 could serve as a prognostic biomarker to predict the overall survival of squamous cell carcinoma patients after surgery. When stratified based on a threshold of strong staining in ≥50% of tumor cells, KRT17 expression could identify patients who were at a greater risk for cancer mortality. Although KRT17 has been reported as a potential prognostic marker in gastric adenocarcinoma37 and breast carcinoma,38–40 to our knowledge our study is the first one that shows a significant association between KRT17 expression and poor prognostic outcome of cervical cancer patients. Future studies will be performed to explore the association of KRT17 expression with patient clinical outcome after adjusting for squamous cell carcinoma stage at diagnosis or other clinically prognostic factors, and a larger cohort of patient samples is needed to solidify the clinical utility of KRT17 staining in cervical cancer.41 Interestingly, Feng et al42 showed recently that CD44+/KRT17+ cells have cervical cancer stemlike properties, including the capacity for cell renewal, chemoresistance, and in vivo tumorigenicity. We also found that KRT17 is expressed in immature squamous metaplasia, reserve cells, HSIL, and in squamous cell carcinoma. Thus, together with our findings, substantial evidence supports the hypothesis that KRT17 expression in squamous cell carcinoma reflects stem cell-like properties of the tumor that could predict treatment failure.
In summary, we show a reciprocal trend of KRT4 and KRT17 expression in the spectrum of cases progressing from normal ectocervical squamous mucosa to squamous cell carcinoma. Our data strongly support the concept that KRT17 expression might be useful as a molecular diagnostic adjunct of HSIL and squamous cell carcinoma. In addition, KRT17 may have a prognostic value for predicting the clinical outcome of cervical squamous cell carcinoma patients and could potentially provide information to help guide individualized therapy.
Supplementary Material
Acknowledgments
We thank Mallory Korman and Saira Mehmood of Stony Brook Medicine for constructing the tissue microarrays and performing the optimization of immunohistochemical staining protocols. This study was supported by the NIAID/NIH 1U19 A1091175-01, NCI R33CA140084, the Stony Brook Research Foundation, Stony Brook Foundation and Targeted Research Opportunities, and the Pohlman Cancer Research Foundation. LFE-H is a Fulbright scholar funded by the US Department of State, Universidad del Cauca-CREPIC-Colombia, and Stony Brook University. Carol Baldwin Breast Cancer Foundation and Manhasset Women's Coalition Against Breast Cancer supported funding for EIC. The mass spectrometer used in this study was funded by the shared instrument grant (NIH/NCRR 1 S10 RR023680-1). We thank the Biostatistical Consulting Core at Stony Brook Medicine for their support in the statistical analysis.
Footnotes
Disclosure/conflict of interest: The authors declare no conflict of interest.
Supplementary Information accompanies the paper on Modern Pathology website (http://www.nature.com/modpathol)
References
- 1.Siegel R, Naishadham D, Jemal A. Cancer statistics, 2012. CA Cancer J Clin. 2012;62:10–29. doi: 10.3322/caac.20138. [DOI] [PubMed] [Google Scholar]
- 2.Schiffman M, Wentzensen N, Wacholder S, et al. Human papillomavirus testing in the prevention of cervical cancer. J Natl Cancer Inst. 2011;103:368–383. doi: 10.1093/jnci/djq562. [DOI] [PMC free article] [PubMed] [Google Scholar]
- 3.Wright TCJ. Natural history of HPV infections. J Fam Pract. 2009;58:S3–S7. [PubMed] [Google Scholar]
- 4.Samarawardana P, Singh M, Shroyer KR. Dual stain immunohistochemical localization of p16INK4A and ki-67: a synergistic approach to identify clinically significant cervical mucosal lesions. Appl Immunohistochem Mol Morphol. 2011;19:514–518. doi: 10.1097/PAI.0b013e3182167c66. [DOI] [PubMed] [Google Scholar]
- 5.Huang LW, Lee CC. P16INK4A overexpression predicts lymph node metastasis in cervical carcinomas. J Clin Pathol. 2012;65:117–121. doi: 10.1136/jclinpath-2011-200362. [DOI] [PubMed] [Google Scholar]
- 6.Yamazaki T, Tomita S, Ichikawa K, et al. P16-immunostaining pattern as a predictive marker of lymph node metastasis and recurrence in early uterine cervical cancer. Pathobiology. 2006;73:176–182. doi: 10.1159/000096018. [DOI] [PubMed] [Google Scholar]
- 7.Masoudi H, Van Niekerk DJ, Gilks CB, et al. Loss of p16 INK4 expression in invasive squamous cell carcinoma of the uterine cervix is an adverse prognostic marker. Histopathology. 2006;49:542–545. doi: 10.1111/j.1365-2559.2006.02510.x. [DOI] [PubMed] [Google Scholar]
- 8.van de Putte G, Holm R, Lie AK, et al. Expression of p27, p21, and p16 protein in early squamous cervical cancer and its relation to prognosis. Gynecol Oncol. 2003;89:140–147. doi: 10.1016/s0090-8258(03)00010-6. [DOI] [PubMed] [Google Scholar]
- 9.Narayan K. Arguments for a magnetic resonance imaging-assisted FIGO staging system for cervical cancer. Int J Gynecol Cancer. 2005;15:573–582. doi: 10.1111/j.1525-1438.2005.00128.x. [DOI] [PubMed] [Google Scholar]
- 10.Schwarz JK, Siegel BA, Dehdashti F, et al. Association of posttherapy positron emission tomography with tumor response and survival in cervical carcinoma. JAMA. 2007;298:2289–2295. doi: 10.1001/jama.298.19.2289. [DOI] [PubMed] [Google Scholar]
- 11.Eifel PJ, Winter K, Morris M, et al. Pelvic irradiation with concurrent chemotherapy versus pelvic and para-aortic irradiation for high-risk cervical cancer: an update of radiation therapy oncology group trial (RTOG) 90-01. J Clin Oncol. 2004;22:872–880. doi: 10.1200/JCO.2004.07.197. [DOI] [PubMed] [Google Scholar]
- 12.He SY, Shen HW, Xu L, et al. FOXM1 promotes tumor cell invasion and correlates with poor prognosis in early-stage cervical cancer. Gynecol Oncol. 2012;127:601–610. doi: 10.1016/j.ygyno.2012.08.036. [DOI] [PubMed] [Google Scholar]
- 13.Li Z, Yu CP, Zhong Y, et al. Sam68 expression and cytoplasmic localization is correlated with lymph node metastasis as well as prognosis in patients with early-stage cervical cancer. Ann Oncol. 2012;23:638–646. doi: 10.1093/annonc/mdr290. [DOI] [PubMed] [Google Scholar]
- 14.Lai CH, Chang CJ, Huang HJ, et al. Role of human papillomavirus genotype in prognosis of early-stage cervical cancer undergoing primary surgery. J Clin Oncol. 2007;25:3628–3634. doi: 10.1200/JCO.2007.11.2995. [DOI] [PubMed] [Google Scholar]
- 15.Birner P, Schindl M, Obermair A, et al. Overexpression of hypoxia-inducible factor 1alpha is a marker for an unfavorable prognosis in early-stage invasive cervical cancer. Cancer Res. 2000;60:4693–4696. [PubMed] [Google Scholar]
- 16.Edge SB, Compton CC. The American Joint Committee on Cancer: the 7th edition of the AJCC cancer staging manual and the future of TNM. Ann Surg Oncol. 2010;17:1471–1474. doi: 10.1245/s10434-010-0985-4. [DOI] [PubMed] [Google Scholar]
- 17.Chen EI, Cociorva D, Norris JL, et al. Optimization of mass spectrometry-compatible surfactants for shotgun proteomics. J Proteome Res. 2007;6:2529–2538. doi: 10.1021/pr060682a. [DOI] [PMC free article] [PubMed] [Google Scholar]
- 18.UniProtConsortium. Reorganizing the protein space at the Universal Protein Resource (UniProt) Nucleic Acids Res. 2012;40:D71–D75. doi: 10.1093/nar/gkr981. [DOI] [PMC free article] [PubMed] [Google Scholar]
- 19.Elias JE, Gygi SP. Target-decoy search strategy for increased confidence in large-scale protein identifications by mass spectrometry. Nat Methods. 2007;4:207–214. doi: 10.1038/nmeth1019. [DOI] [PubMed] [Google Scholar]
- 20.Lundgren DH, Martinez H, Wright ME, et al. Protein identification using Sorcerer 2 and SEQUEST. Curr Protoc Bioinformatics. 2009;Chapter 13 doi: 10.1002/0471250953.bi1303s28. Unit 13.3. [DOI] [PubMed] [Google Scholar]
- 21.Eng JK, McCormack AL, Yates JR., 3rd Method to correlate tandem mass spectra of modified peptides to amino acid sequences in the protein database. Anal Chem. 1995;67:1426–1436. doi: 10.1021/ac00104a020. [DOI] [PubMed] [Google Scholar]
- 22.Ashburner M, Ball CA, Blake JA, et al. Gene ontology: tool for the unification of biology. The Gene Ontology Consortium. Nat Genet. 2000;25:25–29. doi: 10.1038/75556. [DOI] [PMC free article] [PubMed] [Google Scholar]
- 23.Youden WJ. Index for rating diagnostic tests. Cancer. 1950;3:32–35. doi: 10.1002/1097-0142(1950)3:1<32::aid-cncr2820030106>3.0.co;2-3. [DOI] [PubMed] [Google Scholar]
- 24.Liu H, Sadygov RG, Yates JR., 3rd A model for random sampling and estimation of relative protein abundance in shotgun proteomics. Anal Chem. 2004;76:4193–4201. doi: 10.1021/ac0498563. [DOI] [PubMed] [Google Scholar]
- 25.Shroyer KR, Homer P, Heinz D, et al. Validation of a novel immunocytochemical assay for topoisomerase II-alpha and minichromosome maintenance protein 2 expression in cervical cytology. Cancer. 2006;108:324–330. doi: 10.1002/cncr.22171. [DOI] [PubMed] [Google Scholar]
- 26.Siddiqui MT, Hornaman K, Cohen C, et al. ProEx C immunocytochemistry and high-risk human papillomavirus DNA testing in papanicolaou tests with atypical squamous cell (ASC-US) cytology: correlation study with histologic biopsy. Arch Pathol Lab Med. 2008;132:1648–1652. doi: 10.5858/2008-132-1648-PCIAHH. [DOI] [PubMed] [Google Scholar]
- 27.Doorbar J, Quint W, Banks L, et al. The biology and life-cycle of human papillomaviruses. Vaccine. 2012;30(Suppl 5):F55–F70. doi: 10.1016/j.vaccine.2012.06.083. [DOI] [PubMed] [Google Scholar]
- 28.Redman R, Rufforny I, Liu C, et al. The utility of p16-(Ink4a) in discriminating between cervical intraepithelial neoplasia 1 and nonneoplastic equivocal lesions of the cervix. Arch Pathol Lab Med. 2008;132:795–799. doi: 10.5858/2008-132-795-TUOPID. [DOI] [PubMed] [Google Scholar]
- 29.Ordi J, Garcia S, del Pino M, et al. p16 INK4a immunostaining identifies occult CIN lesions in HPV-positive women. Int J Gynecol Pathol. 2009;28:90–97. doi: 10.1097/PGP.0b013e31817e9ac5. [DOI] [PubMed] [Google Scholar]
- 30.Klaes R, Benner A, Friedrich T, et al. p16INK4a immunohistochemistry improves interobserver agreement in the diagnosis of cervical intraepithelial neoplasia. Am J Surg Pathol. 2002;26:1389–1399. doi: 10.1097/00000478-200211000-00001. [DOI] [PubMed] [Google Scholar]
- 31.Smedts F, Ramaekers F, Troyanovsky S, et al. Basal-cell keratins in cervical reserve cells and a comparison to their expression in cervical intraepithelial neoplasia. Am J Pathol. 1992;140:601–612. [PMC free article] [PubMed] [Google Scholar]
- 32.Maddox P, Sasieni P, Szarewski A, et al. Differential expression of keratins 10, 17, and 19 in normal cervical epithelium, cervical intraepithelial neoplasia, and cervical carcinoma. J Clin Pathol. 1999;52:41–46. doi: 10.1136/jcp.52.1.41. [DOI] [PMC free article] [PubMed] [Google Scholar]
- 33.Carrilho C, Alberto M, Buane L, et al. Keratins 8, 10, 13, and 17 are useful markers in the diagnosis of human cervix carcinomas. Hum Pathol. 2004;35:546–551. doi: 10.1016/j.humpath.2004.01.021. [DOI] [PubMed] [Google Scholar]
- 34.Ikeda K, Tate G, Suzuki T, et al. Coordinate expression of cytokeratin 8 and cytokeratin 17 immunohistochemical staining in cervical intraepithelial neoplasia and cervical squamous cell carcinoma: an immunohistochemical analysis and review of the literature. Gynecol Oncol. 2008;108:598–602. doi: 10.1016/j.ygyno.2007.11.042. [DOI] [PubMed] [Google Scholar]
- 35.Regauer S, Reich O. CK17 and p16 expression patterns distinguish (atypical) immature squamous metaplasia from high-grade cervical intraepithelial neoplasia (CIN III) Histopathology. 2007;50:629–635. doi: 10.1111/j.1365-2559.2007.02652.x. [DOI] [PMC free article] [PubMed] [Google Scholar]
- 36.Moll R, Divo M, Langbein L. The human keratins: biology and pathology. Histochem Cell Biol. 2008;129:705–733. doi: 10.1007/s00418-008-0435-6. [DOI] [PMC free article] [PubMed] [Google Scholar]
- 37.Ide M, Kato T, Ogata K, et al. Keratin 17 expression correlates with tumor progression and poor prognosis in gastric adenocarcinoma. Ann Surg Oncol. 2012 doi: 10.1245/s10434-012-2437-9. [DOI] [PubMed] [Google Scholar]
- 38.Malzahn K, Mitze M, Thoenes M, et al. Biological and prognostic significance of stratified epithelial cytokeratins in infiltrating ductal breast carcinomas. Virchows Arch. 1998;433:119–129. doi: 10.1007/s004280050226. [DOI] [PubMed] [Google Scholar]
- 39.van de Rijn M, Perou CM, Tibshirani R, et al. Expression of cytokeratins 17 and 5 identifies a group of breast carcinomas with poor clinical outcome. Am J Pathol. 2002;161:1991–1996. doi: 10.1016/S0002-9440(10)64476-8. [DOI] [PMC free article] [PubMed] [Google Scholar]
- 40.Thike AA, Iqbal J, Cheok PY, et al. Triple negative breast cancer: outcome correlation with immunohistochemical detection of basal markers. Am J Surg Pathol. 2010;34:956–964. doi: 10.1097/PAS.0b013e3181e02f45. [DOI] [PubMed] [Google Scholar]
- 41.Concato J, Peduzzi P, Holford TR, et al. Importance of events per independent variable in proportional hazards analysis. I. Background, goals, and general strategy. J Clin Epidemiol. 1995;48:1495–1501. doi: 10.1016/0895-4356(95)00510-2. [DOI] [PubMed] [Google Scholar]
- 42.Feng D, Peng C, Li C, et al. Identification and characterization of cancer stem-like cells from primary carcinoma of the cervix uteri. Oncol Rep. 2009;22:1129–1134. doi: 10.3892/or_00000545. [DOI] [PubMed] [Google Scholar]
Associated Data
This section collects any data citations, data availability statements, or supplementary materials included in this article.