

Abstract
The heart is a muscular organ with a wrapping, laminar structure embedded with neural and vascular networks, collagen fibrils, fibroblasts, and cardiac myocytes that facilitate contraction. We hypothesized that these non-muscle components may have functional benefit, serving as important structural alignment cues in inter- and intra-cellular organization of cardiac myocytes. Previous studies have demonstrated that alignment of engineered myocardium enhances calcium handling, but how this impacts actual force generation remains unclear. Quantitative assays are needed to determine the effect of alignment on contractile function and muscle physiology. To test this, micropatterned surfaces were used to build 2-dimensional myocardium from neonatal rat ventricular myocytes with distinct architectures: confluent isotropic (serving as the unaligned control), confluent anisotropic, and 20 μm spaced, parallel arrays of multicellular myocardial fibers. We combined image analysis of sarcomere orientation with muscular thin film contractile force assays in order to calculate the peak sarcomere-generated stress as a function of tissue architecture. Here we report that increasing peak systolic stress in engineered cardiac tissues corresponds with increasing sarcomere alignment. This change is larger than would be anticipated from enhanced calcium handling and increased uniaxial alignment alone. These results suggest that boundary conditions (heterogeneities) encoded in the extracellular space can regulate muscle tissue function, and that structural organization and cytoskeletal alignment are critically important for maximizing peak force generation.
Keywords: Cardiac tissue engineering, Cardiomyocyte, Fibronectin, Polydimethylsiloxane, Micropatterning
1. Introduction
The striated muscle of the heart is organized into anisotropic laminae that wrap around the ventricular cavities [1]. Embedded within these layers are several different non-muscle structures including capillaries, nerve networks, fibroblasts, ventricular sinuses, cleavage planes and extracellular protein fibrils in a tightly regulated demographic balance [2–5]. In the diseased heart, perturbation of these cell populations and the extracellular matrix (ECM) is commonly associated with maladaptive remodeling, resulting in decreased cardiac output [6] and arrhythmogenesis [7,8]. However, it remains unclear whether these structural changes are causative or correlative with contractile function and dysfunction.
Tissue engineered, in vitro systems provide a platform for studying these types of structure–function relationships in cardiac muscle. Previous work in modeling cardiac microenvironments experimentally by Kleber and colleagues demonstrated that patterned, in vitro cardiac myocyte cultures that constrain the cell monolayer in two dimensions (2D) can regulate source–sink relationships, resulting in unique propagation of action potential wavefronts [9]. Additional work using microcontact printing showed that alignment of the ECM on cell culture substrates potentiated the alignment of cultured myocytes into anisotropic monolayers that propagated excitation wavefronts faster in the longitudinal direction as compared to the transverse direction [10]. Additional studies have exploited topographical micropatterning of substrates to direct the self-organization of cardiac myocytes into muscle tissue with a hypertrophic phenotype [11,12]. Similarly, we have reported that geometric cues in the ECM act as boundary conditions that regulate myofibrillogenesis [13–15] and that the bundled, parallel alignment of myofibrils enhances myocyte contraction strength [16]. These reports suggest that boundary conditions imposed on muscle cells in the heart may be an important regulator of cardiac tissue form and function.
We reasoned that by controlling extracellular boundary conditions within 2D laminar tissues, we could direct the organization of the cytoskeleton and modulate the contractility of cardiac muscle. To test this, we engineered 2D myocardium with increasing degrees of myofibrillar alignment and measured the resulting stress generation at peak systole. Three types of 2D myocardium were engineered; isotropic (ISO) with random cell alignment, anisotropic (ANISO) with uniaxial cell alignment and 20 μm wide, 20 μm spaced multicellular strands (LINES) with uniaxial cell alignment. To determine cytoskeletal organization, we used a new image processing technique that enables quantification of the orientation of all sarcomeres within the cardiac myocytes. Thus, we can analyze the actual force-generating component of the cardiac myocytes and determine the fraction of sarcomeres aligned in the direction of contraction. Further, we can measure the true stress generated by the engineered 2D myocardium using the muscular thin film (MTF) contractility assay.
2. Materials and methods
2.1. Micropatterned substrate and muscular thin film fabrication
MTFs were fabricated via a multi-step spin coating process according to published methods [17]. Briefly, poly(N-isopropylacrylamide) (PIPAAm, Polysciences, Warrington, PA, USA) was dissolved at 10 wt% in 99.4% 1-butanol (w/v) and spin coated onto 25 mm diameter glass cover slips. Sylgard 184 (Dow Corning, Midland, MI, USA) polydimethylsiloxane (PDMS) elastomer was mixed at a 10:1 base to curing agent ratio, spin coated onto the PIPAAm coated glass cover slips and cured at 65 °C for 4 h. The time at which each cover slip was spin coated with PDMS was recorded and every third sample was retained for subsequent thickness measurement of the PDMS layer using a stylus profilometer (Dektak 6M, Veeco Instruments Inc., Plain-view, NY, USA). Once cured, the PDMS/PIPAAm coated cover slips were UV ozone treated (Model No. 342, Jelight Company, Irvine, CA, USA.) and then functionalized with the ECM protein fibronectin (FN) according to one of three conditions; (i) isotropic myocytes randomly arrayed in a continuous monolayer (ISO), (ii) anisotropic myocytes aligned in a continuous monolayer (ANISO) or (iii) lines where multicellular muscle strands are arranged in parallel without lateral coupling between the strands (LINES). Isotropic FN was deposited by placing a 1 mL droplet of 25 μg/mL of FN in sterile deionized (DI) water on the PDMS and incubating for 15 min. To micropattern FN, PDMS stamps with 20 μm wide, 20 μm spaced ridges were used to transfer FN to the PDMS surface creating 20 μm wide, 20 μm spaced FN lines. Either 1% Pluronics F-127 (BASF Group, Florham Park, NJ, USA) or 2.5 μg/mL of FN in DI water was incubated on the cover slip surface for 15 min, creating the lines or anisotropic FN micropatterns respectively. For the immunostained samples used in the sarcomere analysis, PDMS coated cover slips were fabricated using the identical process except the layer of PIPAAm was omitted.
2.2. Cardiac myocyte harvest, seeding and culture
Neonatal rat ventricular cardiac myocytes were isolated from 2-day old neonatal Sprague–Dawley rats based on published methods [17,18]. Ventricles were extracted and homogenized by washing in Hanks balanced salt solution followed by digestion with trypsin and collagenase with agitation overnight at 4 °C Cells were re-suspended in M199 culture medium supplemented with 10% (v/v) heat-inactivated fetal bovine serum (FBS), 10 mm HEPES, 3.5 g/L glucose, 2 mM l-glutamine, 2 mg/L vitamin B-12, and 50 U/ml penicillin and seeded at a density of 1 million cells per cover slip. Samples were incubated under standard conditions at 37 °C and 5% CO2. Streptomycin was not added to the media in order to prevent interference with stretch activated ion channels. Media was exchanged with maintenance media (2% FBS) every 48 h until use. All procedures were approved by the Harvard University animal care and use committee.
2.3. Muscular thin film contractility assay
The MTFs were cultured for a period of 4–6 days and then used in the contractility assay to measure force generation. To release the MTFs, cover slips were removed from the incubator and transferred to a Petri dish filled with 37 °C normal Tyrode's solution (1.192 g of HEPES, 0.901 g of glucose, 0.265 g of CaCl2, 0.203 g of MgCl2, 0.403 g of KCl, 7.889 g of NaCl and 0.040 g of NaH2PO4 per liter of deionized water). The Petri dish was placed on a stereomicroscope (Model MZ6 with darkfield base, Leica Microsystems Inc., Buffalo Grove, IL, USA) and rectangles ∼2 mm wide and 5 mm long were cut out using a straight-blade razor with tissue alignment of the 2D myocardium aligned longitudinally. Cooling the Tyrode's solution to room temperature caused the PIPAAm to dissolve, releasing the MTF from the cover slip into solution. Individual MTFs were transferred to a 35 mm Petri dish filled with Tyrodes solution in a custom-built organ bath system at room temperature for experiments. The MTFs were mounted in a PDMS clamp (∼ 5 × 5 × 10 mm) such that the stereomicroscope looking down on the organ bath viewed the MTF edge on. Parallel platinum wire electrodes spaced ∼1 cm apart were lowered directly into the Petri dish. Digital video of MTF contractions was recorded at 130 frames-per-second using a Basler A601f camera and custom Lab-View image acquisition software. An external field stimulator (Myopacer, IonOptix Corp, Milton, MA, USA) was used to apply a 10 ms duration square pulse between the electrodes at pacing rates from 0.1 to 10 Hz for durations of 10 s up to 30 min. Stimulation voltage was typically 10 V, but was determined for each MTF. The digital video was converted to a binary skeleton representation using ImageJ and then loaded into MATLAB (Mathworks, Inc., Natick, MA, USA) where the average radius of curvature was found and used to calculate the stress generated by the engineered myocardium for each video frame.
2.4. Optical mapping experiments
Optical recordings of transmembrane potential were performed on culture days 4 and 5. Cover slips were transferred from the incubator to the heated bath of a custom-built optical mapping system integrated into an inverted epifluor-escence microscope (Axiovert 200, Carl Zeiss Microimaging, Thornwood, NY, USA), similar to previously published methods [19]. All optical measurements and dye incubations were performed in normal Tyrode's solution at 35 °C and a pH of 7.4. Cardiac myocytes were incubated in 4–8 μm of the voltage sensitive dye RH237 (Invitrogen, Carlsbad, CA, USA) for 5 min, washed 3 times, with Tyrode's and then incubated in 10 μm Blebbistatin (an excitation–contraction uncoupler, EMD Chemicals, Gibbstown, NJ, USA) [20] for the duration of the experiment. Samples were mounted in a temperature controlled bath on an inverted microscope with a 40× objective (Zeiss EC Plan-NEOFLUAR, numerical aperture 1.3). Cells were exposed to excitation light (530–585 nm) for 2 s and the emitted light was longpass filtered at 615 nm and focused onto a hexagonal array of 124, 1 mm diameter optical fibers coupled to photodiodes. Photocurrents were converted to voltages, amplified and digitized at 12-bit resolution at 5 kHz. Pacing was applied via bipolar point stimulation from platinum wires located approximately 1 mm above the monolayer. A single recording was made from each field of view located at least 2 mm from the pacing electrode. Calculation of conduction velocity and action potential duration (APD) were based on a minimum of three recordings at 2 Hz pacing. Then, pacing frequency was increased in steps of 0.5 Hz. The inverse of the highest pacing frequency maintained was defined as the functional refractory period (FRP).
To estimate conduction velocity, fluorescence signals from each optical fiber were low-pass filtered at 500–1000 Hz and normalized. Activation times were calculated as the time to reach one-half the maximum action potential amplitude. To minimize the effects of photo-bleaching and photo-toxicity, conduction velocities (CV) were estimated from the first activation in each recording, and their vector fields calculated from interpolated activation maps [21]. For isotropic tissue, the velocity was calculated as the average magnitude of all vectors. For anisotropic tissue, the fiber direction was aligned horizontally and the longitudinal and transverse conduction velocities averaged the velocity magnitude along the horizontal and vertical axes, respectively. For LINES, the fiber direction was aligned horizontally ensuring each line (20 μm wide) was overlaid on a row of fiber optic cables (25 μm diameter). The activation only spread horizontally along the line and signals corresponding to the regions between lines were not analyzed further. CV was obtained by dividing the distance between the centers of neighboring optical fibers (25 μm) by the difference in activation time. Velocity was calculated in this manner for each optical fiber along the length of each line and averaged. To determine action potential duration (APD), the same recordings used for CV were low-pass filtered at 100 Hz and APD at 50% and 80% repolarization (APD50 and APD80) were found.
2.5. Calcium transient measurements
Neonatal rat ventricular cardiac myocytes were incubated with 2.3 μm fluo-4 AM (Invitrogen) and 0.1% Pluronic F-127 for 15 min at 35 °C. Cardiac myocytes were subsequently washed 3 times in modified Tyrodes solution to allow de-esterification. Engineered tissues were electrically paced at 2 Hz using field stimulation (10 V, 10 ms square wave) and the calcium transients were imaged using a laser scanning confocal microscope (LSM 5 LIVE, Carl Zeiss Microimaging, Thornwood, NY, USA) with a 40× objective lens and 488 nm diode laser. The frame scan mode (1081 fps) was used for quantitative analysis of Ca2+ transients. Fluorescence (F) was normalized by dividing by the basal cell fluorescence after dye loading (F0). Data were collected from 3 to 5 different cardiac myocyte harvests.
2.6. Immunohistochemistry
PDMS coated cover slips with engineered cardiac muscle tissue were fixed and stained at time points concurrent with MTF experiments. Cardiac myocytes were fixed in a solution of 4% paraformaldehyde and 0.25% Triton X-100 for 15 min, washed 3x with PBS and then fluorescently stained. The sarcomere Z-disks were stained with monoclonal mouse anti-(sarcomeric α-actinin) primary antibody (Sigma–Aldrich, St. Louis, MO, USA) at 1:200 dilution in PBS for 1.5 h at 37 °C. Samples were subsequently washed 5× with PBS and then concurrently stained with goat anti-mouse secondary antibody conjugated to tetramethylrhodamine (Sigma–Aldrich), 4′,6-diamidino-2-phenylindole (DAPI) (Sigma–Aldrich) and phalloidin conjugated to Alexa-Fluor 488 (Invitrogen). Epifluorescent images were captured on a Leica DMI 6000B inverted light microscope using a CoolSNAP HQ digital camera (Photometrics, Tucson, AZ, USA). Confocal images were captured on a Zeiss Axio Observer equipped with an LSM 5 Live line scanning confocal attachment.
2.7. Sarcomere image analysis
A modified ridge detection algorithm based on fingerprint enhancement methods was used to quantify the sarcomere structure [22–24]. Grayscale images were normalized (Fig. 1 A), and then an orientation vector map was created based on pixel intensity gradients (Fig. 1B). These orientation vectors were found parallel to the Z-disks and then rotated by π/2 to create a vector map orthogonal to the Z-disks. This is the direction of sarcomere force generation along the myofibril. The sarcomere orientation map was used in combination with the known ∼2 μm sarcomere Z-disk spacing to create a spatial frequency map to restore poorly resolved sarcomeres in the image (Fig. 1D). This restored image of sarcomeres was binarized and then skeletonized to create a 1-pixel wide representation of the Z-disks (Fig. 1E), which was manually cleaned-up to remove false-sarcomeres associated with cell borders (Fig. 1F). The sarcomere orientation vector map was multiplied by the skeletonized Z-disk image to find the orientation vector for each Z-disk pixel. A histogram of orientation angles was used to determine cytoskeletal isotropy/ anisotropy with a distinct peak at specific angle indicative of alignment (Fig. 1G). To quantify alignment, a 2D orientation order parameter (OOP) was defined as the largest eigenvalue of the orientational order tensor [25]. The OOP is an established metric for quantifying alignment in biological systems [26,27]. The OOP scales from 0 to 1 with 0 indicating complete isotropic orientation and 1 indicating perfect anisotropic orientation. The average uniaxial component of the sarcomere orientation vector, rTissue Type, was quantified by projecting a normal unit vector for each Z-disk pixel onto the mean orientation axis and dividing by the total number of Z-disk pixels. The angle between each individual sarcomere orientation vector in an image and the mean orientation axis is θ, so ri = cos(θi) is the component of each orientation vector of sarcomere i onto the mean orientation vector of all sarcomeres (Fig. 2). To determine the average uniaxial component of the sarcomere orientation vectors at the tissue scale, we summed r for each Z-disk pixel and then divide by the total number of Z-disk pixels (Equation (1)),
Fig. 1.
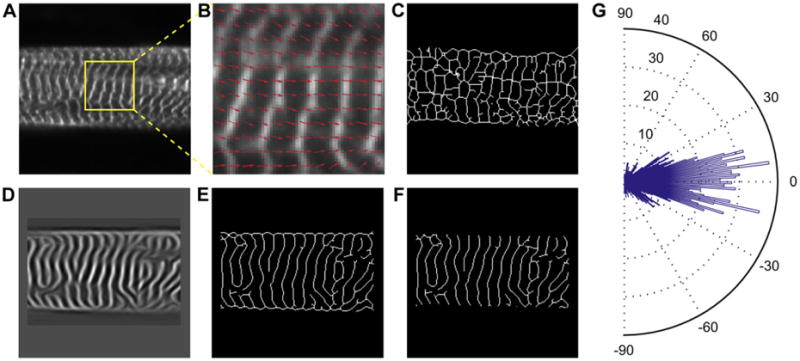
Example images representing the procedure used to quantify sarcomere alignment in cardiac myocytes. (A) Grayscale images of immunofluorescently labeled Z-disks allow the sarcomeres to be visualized. (B) Zoomed in region of (A) with an overlay of orientation vectors (red arrows) orthogonal to Z-disks, based on the intensity gradients of the grayscale image. (C) Example of binary threshold and skeletonization of (A) without any image restoration. (D) Frequency map of image in (A) based on known sarcomere spacing of 2 μm (see Methods for details). (E) Enhanced binary skeleton of Z-disks based on restored sarcomere information. (F) Manual removal of image restoration artifacts, primarily at the borders of cells. (G) Rose plot histogram of sarcomere orientation in (A) calculated using the sarcomere analysis, with the mean orientation direction centered on 0°. (For interpretation of the references to colour in this figure legend, the reader to the web version of this article.)
Fig. 2.
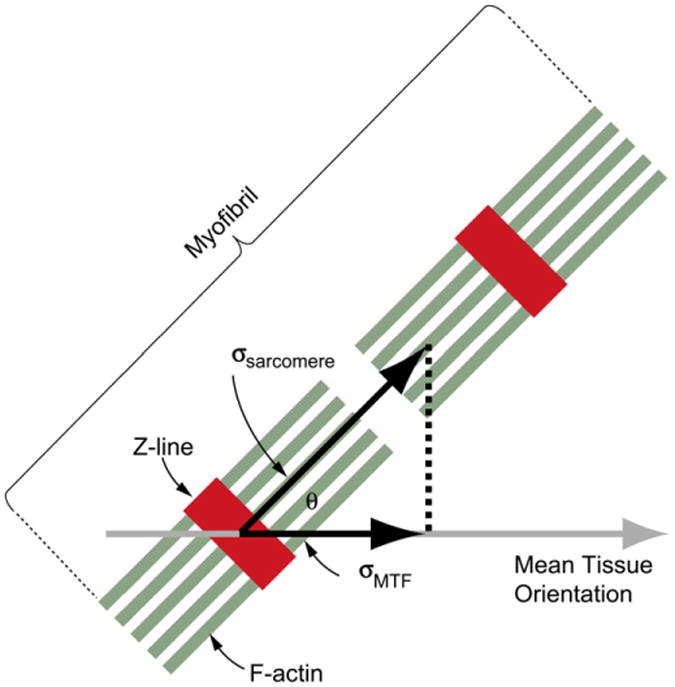
This diagram represents a myofibril (green actin filaments, red Z-disks) from the engineered myocardium. The stress actually generated along the myofibril is σsarcomere, while the stress measured by the MTF contractility assay is σMTF. Since only a fraction of sarcomeres are aligned in the direction of mean tissue orientation, σsarcomere is greater than σMTF. (For interpretation of the references to colour in this figure legend, the reader is referred to the web version of this article.)
| (1) |
Thus, rTissue Type = 1 corresponds to all sarcomeres aligned in the direction of contraction and rTissue Type = 2/π corresponds to completely random, isotropic sarcomere orientations with no net direction of alignment. The density of sarcomeres was calculated by dividing the number of skeletonized Z-disk pixels by the total number of α-actinin positive pixels (cardiac myocyte positive pixels). To calculate the thickness of the engineered cardiac tissue samples were imaged in 3-dimensions using confocal microscopy (LSM 5 Live). The α-actinin staining was used to determine the thickness of the cells based on the myofibrils, as they are the force-generating component of the muscle tissue. We used a 2D, XY projection of the sarcomeres for this analysis because as a thin tissue monolayer, the myofibrils were predominantly oriented within the plane of the tissue, constrained by the PDMS substrate on the basal membrane and the culture media on the apical membrane [13]. This was confirmed by applying the sarcomere analysis to a 2D, XZ projection of engineered cardiac tissue, which showed >95% of the sarcomeres were aligned within the tissue plane.
2.8. Calculating sarcomere-generated stress
The stress calculated by the MTF assay is the stress along the longitudinal axis of the rectangular MTF cantilever, defined as σMTF (Fig. 2). However, the contractile force is generated by the sarcomeres, only a fraction of which are aligned in the direction measured by the MTF assay. The sarcomere-generated stress, σSarcomere, is therefore greater than the measured σMTF. Quantitative sarcomere alignment (Fig. 1) can determine the fractional alignment of sarcomeres, rTissue Type, in the direction of MTF measured contraction. From this we can estimate the stress generated by the sarcomeres using the linear relationship σSarcomere = σMTF/rTissue Type.
2.9. Statistical procedures
Substrate coverage, tissue thickness, fraction aligned sarcomeres (rTissue Type), longitudinal CV, APD50, APD80 and calcium wave rise time, peak amplitude and decay constant (τ) were each statistically analyzed by one-way ANOVA as a function of tissue type followed by Tukey's multiple pairwise comparisons. Peak systolic stress as a function of tissue type and pacing frequency was statistically analyzed using two-way ANOVA followed by Holm–Sidak method multiple pairwise comparisons. Percent sarcomeres as a function of tissue type were statistically analyzed by Kruskal–Wallis one-way ANOVA on Ranks. The anisotropy ratio of the conduction velocities and the transverse CVs were statistically analyzed using a Mann–Whitney Rank Sum test. Statistical significance was based on P < 0.05.
3. Results
3.1. Electrophysiological properties of engineered 2D myocardium
The in vitro patterning of cardiac myocytes into aligned cardiac tissues has been shown previously to produce sheets of cells with anisotropic AP conduction [10]. To provide effective comparison between our engineered tissues and these previous studies, we performed a similar analysis of tissue structure and electrophysiology. Neonatal rat ventricular myocytes were seeded and cultured for four days on engineered surfaces patterned with FN. These cells self-organized based on the underlying geometric patterning of FN into contiguous isotropic (ISO) (Fig. 3A) and anisotropic (ANISO) (Fig. 3B) monolayers and aligned, multicellular fibers (LINES) (Fig. 3C), comparable to previously published results [10,17,28–31]. Connectivity between adjacent myocytes was visualized by the formation of cell–cell junctions (Fig. 3A, B and C) and electrical coupling confirmed during microscale optical mapping of action potential propagation through the tissue. Traces measured at multiple sites within the tissues revealed action potential waveforms typical of the neonatal rat (Fig. 3D, E, and F). Uniaxial tissue alignment increased longitudinal conduction velocity (CV) and decreased transverse CV in the ANISO versus ISO myocardium (Fig. 3G). Note that for ISO tissues the longitudinal direction was arbitrarily selected. The CV in the LINES was slightly higher than the longitudinal component of the CV in the ANISO tissues, but without statistical significance.
Fig. 3.
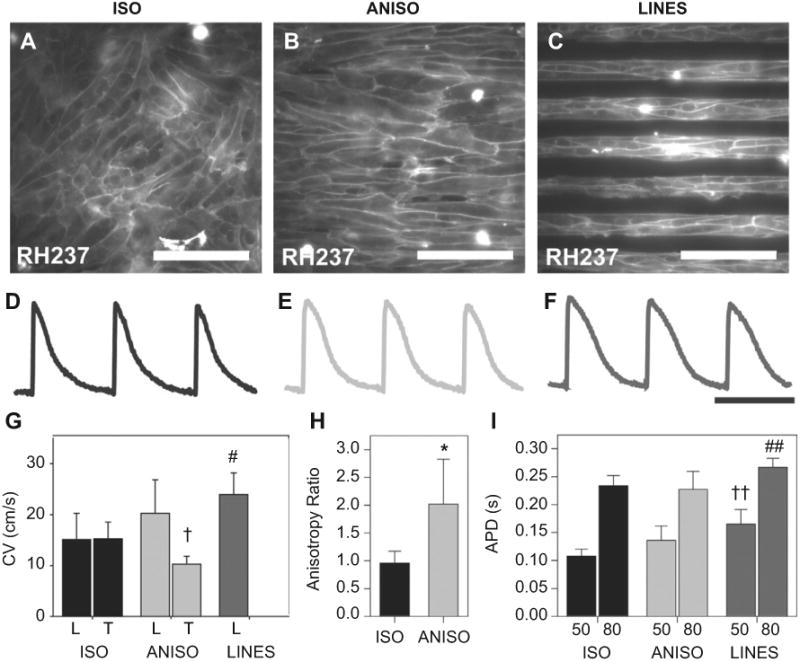
Optical mapping of action potential propagation in the engineered cardiac tissues was used to quantify differences in electrophysiology. Cell membranes were stained with the voltage sensitive dye RH237, revealing (A) ISO, (B) ANISO and (C) LINES tissues composed of cells with clearly defined borders that reflect the engineered alignment. Example action potentials from (G) ISO, (H) ANISO and (I) LINES paced at 2 Hz revealed similar morphologies (scale bar is 500 ms). (G) Longitudinal and transverse conduction velocities, note that LINES did not have a transverse component due to minimal line-to-line coupling. (H) The anisotropy ratio of action potential propagation in ISO and ANISO tissues. (I) Action potential duration (APD) at 50% and 80% repolarization. Error bars represent standard deviation and statistical significance is based on P < 0.05 versus ISO for *, † and #; versus ISO and ANISO for ††; and versus ANISO for # #. Scale bar is 100 μm in A, B and C and 500 ms in D, E and F.
The ANISO and LINES tissue constructs displayed CVs comparable to previously published results [10]. The degree of anisotropy, taken as the ratio of longitudinal and transverse CV, was approximately 2fold higher in the ANISO tissue compared to ISO (Fig. 3H). The action potential duration (APD) of the LINES was slightly longer than ANISO and ISO tissues with APD80 in the LINES significantly longer than APD80 in ANISO and APD50 in LINES significantly longer than APD50 in ISO. Increased APD in the LINES was concurrent with an increased functional refractory period. These data indicate that LINES tissues have different electrophysiological properties than the ANISO and ISO tissues, including longer APD and faster propagation.
3.2. Calcium handling in aligned 2D myocardium
Recent work by our lab [28] and others [11] has demonstrated that Ca2+ handling varies as a function of tissue architecture. While enhanced Ca2+ handling suggests stronger contractility, previous studies have not been able to correlate Ca2+ handling with systolic force. To address this, we measured cytosolic Ca2+ transients in the engineered tissues using the intracellular calcium indicator, fluo-4. Ca2+ transients in ANISO and LINES had similar morphologies, and both were distinctive as compared to Ca2+ transients in ISO tissues (Fig. 4A). The intracellular Ca2+ transient reflects the amount of Ca2+ available to activate the contracting cardiac myofilaments. The signal is comprised of both the transport of Ca2+ into and out of cardiac myocytes as well as Ca2+ released and taken up into intracellular stores. The time to peak of the Ca2+ transient was significantly faster in ANISO and LINES compared to ISO (Fig. 4B). Similarly, Ca2+ transport out of the cardiac myocytes and into intracellular stores, determined by the time course of Ca2+ transient decay (Tau), was significantly faster in ANISO and LINES compared to ISO (Fig. 4C). Thus, the uniaxial alignment of sarcomeres in ANISO and LINES coincides with faster cycling of Ca2+ in these types of engineered myocardium.
Fig. 4.
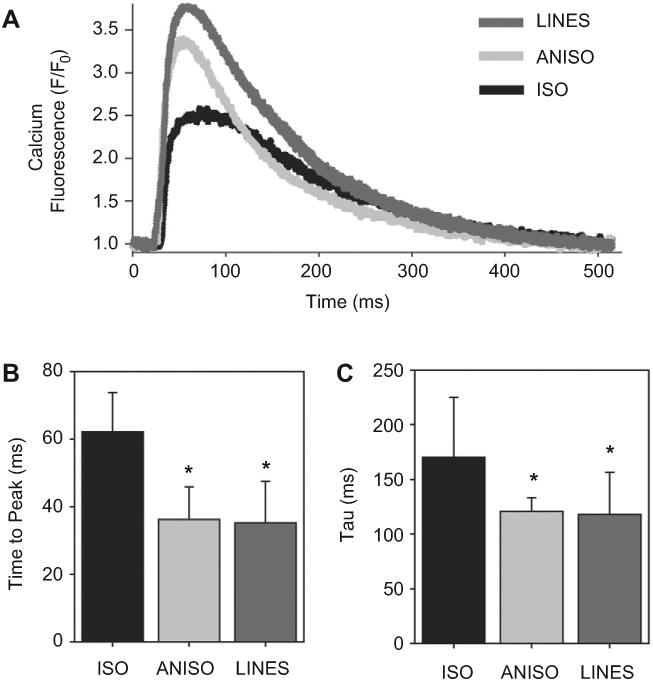
Ca2+ transient in the engineered cardiac tissues was optically imaged and analyzed. (A), Representative calcium transients from ISO (black), ANISO (light gray) and LINES (dark gray) engineered tissues showing the different morphologies. (B), Time to peak Ca2+ levels significantly decrease in ANISO and LINES relative to ISO (* indicates P < 0.001). (C), The decay time Tau of the Ca2+ levels significantly decreases in the ANISO and LINES compared to ISO, showing that Ca2+ is more rapidly removed from the cytosol (* indicates P < 0.05). All data in (B and C) are mean ± standard deviation with statistical significance based on Tukey's pairwise multiple comparisons.
3.3. Intracellular organization of sarcomeres
Confocal imaging of tissues immunostained against α-actinin at the Z-disks revealed distinct differences in sarcomere organization between tissue types. ISO tissues had localized anisotropy in regions spanning 100–200 μm (a few cell widths), however there was no long-range organization (Fig. 5A). Closer examination of the Z-disks showed myofibrils arrayed in multiple directions within the myocytes, similar to the overall isotropic tissue architecture (Fig. 5D). ANISO tissues were characterized by predominantly uniaxial myofibrillar alignment with both local and long-range organization (Fig. 5B). Even though myofibrillar alignment was generally anisotropic, cardiac myocytes in the ANISO tissue contained myofibrils that were off-axis relative to the aggregate alignment (Fig. 5E). LINES tissues were also characterized by predominantly uniaxial myofibrillar alignment with both local and long-range organization (Fig. 5C). However, unlike ANISO, nearly all myofibrils appeared to be uniaxially aligned with minimal off-axis alignment (Fig. 5F).
Fig. 5.
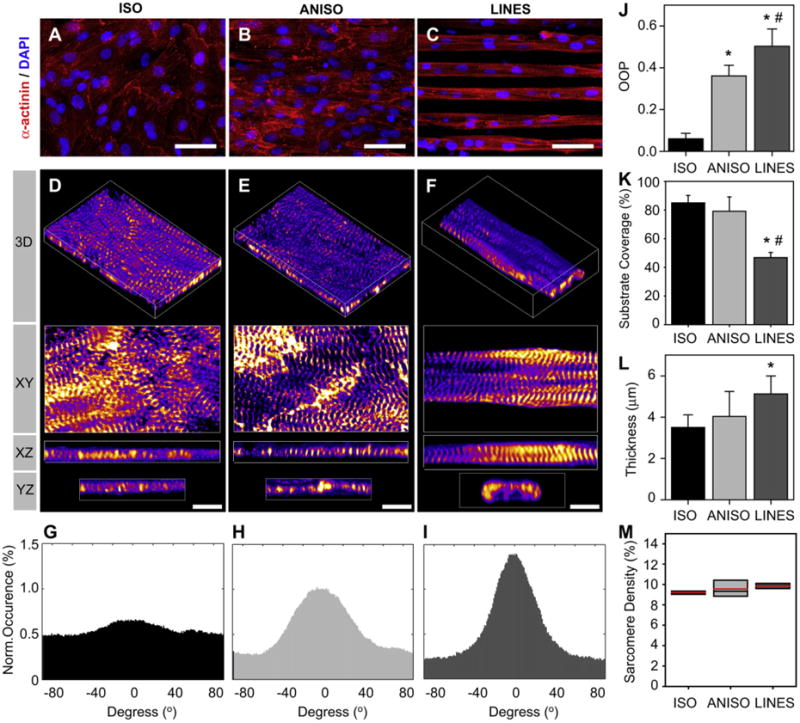
Quantification of sarcomere structure in engineered cardiac tissue based of sarcomeric α-actinin staining of the Z-disks. Confocal images of representative tissues reveal distinct differences in sarcomere organization between types. (A and D) ISO is characterized by myofibrils oriented in all directions. (B and E) ANISO is characterized by predominantly uniaxial myofibrillar alignment, but with clear orientation off-axis as well. (C and F) LINES have uniaxial myofibrillar alignment. Analysis of sarcomere orientation reveals quantifiable differences as seen in representative histograms of alignment angles for ISO, ANISO and LINES, in (G), (H) and (I), respectively (0° is the angle of maximum alignment). (J) Analysis of sarcomere alignment using the orientation order parameter (OOP) (scale form 0 for no alignment to 1 for complete alignment). (K) The cardiac myocyte substrate coverage for each tissue type. (L) The thickness of the engineered cardiac tissue (myofibrillar thickness) for each tissue type. (M) The sarcomere density reported as percent Z-disk pixels divided by total myocyte pixels. Error bars represent standard deviation. Statistical significance is based on Tukey's pairwise comparison, (*) indicates P < 0.05 relative to ISO and (#) indicates P < 0.05 relative to ANISO. Scale bar is 50 μm in A, B and C and 5 μm in D, E and F.
We quantified the differences in myofibrillar architecture across the three tissue types by extracting orientation information from fluorescently labeled α-actinin in the sarcomere Z-disks. Previous studies have quantified actin filament alignment in cardiac myocytes and other cell types [24,28], but F-actin is found in both contractile myofibrils and non-contractile actin filaments. The enhanced Z-disk image is a l-pixel wide skeleton image that captures the length and curvature of the Z-disks. Normal vectors at each pixel along the Z-disk are used to quantify orientation at a sub-myofibril (and sub-micrometer) level. Representative histograms of sarcomere orientation for ISO, ANISO and LINES tissues (Fig. 5G, H, I, respectively) show the increase in uniaxial alignment. These histograms are centered on the mean orientation, which is collinear to the underlying FN patterning for ANISO and LINES tissues. To compare tissue types directly, we used an orientational order parameter (OOP) as an alignment metric, where for complete uniaxial alignment OOP = 1 and for complete isotropic alignment OOP = 0. Based on this OOP analysis, we observed an increase in the alignment of sarcomeres, where ISO tissues have the least alignment and LINES tissues have the greatest alignment (Fig. 5J).
To determine the volume of cardiac muscle tissue we measured the thickness and area of the cardiac myocytes using the α-actinin in the Z-disks of the myofibrils. Myocardium surface coverage was ∼80% in ISO and ANISO tissues and ∼45% LINES tissue (Fig. 5K), with α-actinin negative cells (e.g., fibroblasts) excluded. The micropatterning affected the thickness of the engineered myocardium, increasing from the ISO, to ANISO to LINES tissues (Fig. 5L). However, sarcomere density, defined as the percent of Z-disk positive pixels divided by total cardiac myocyte positive pixels, was statistically equivalent for all tissues (Fig. 5M).
3.4. Contractile stress of engineered 2D myocardium
To determine how tissue architecture affects contractile force, we engineered MTFs [17,29,32], of each tissue type. We field-stimulated the engineered tissues at frequencies ranging from 0.5 to 5.0 Hz to initiate contractions and determine the force–frequency response (see Supplemental Video 1 for comparison of ISO, ANSIO and LINES MTFs paced at 0.5 Hz). Representative images of MTFs during diastole and peak systole are shown for ISO (Fig. 6A and B), ANISO (Fig. 6D and E ) and LINES (Fig. 6G and H), where the tissue on the underside of the cantilever deflects it downward during systole. ISO tissues generated relatively low levels of stress, with peak systolic stress of ∼1 kPa. At 0.5 Hz, the ISO MTFs returned to the diastolic position, but at1.0Hz and higher, MTFs did not fully relax during the contractile cycle, as indicated by the elevated diastolic stress (Fig. 6C). ANISO and LINES tissue generated significantly greater stress than ISO, with peak systolic stresses >10 kPa. ANISO tissues were captured at 0.5 Hz and maintained capture up to 5.0 Hz, with a small decrease in peak systolic stress at higher frequencies (Fig. 6F). LINES tissues, composed of arrays of electrically isolated multicellular strands, were paced effectively at 0.5 Hz, but could not be consistently captured at higher frequencies as indicated by the stress trace (Fig. 6I). The contractility measurements using the MTF assay reveals an order-of-magnitude increase in MTF peak systolic stress for the ANISO and LINES relative to the ISO tissue.
Fig. 6.
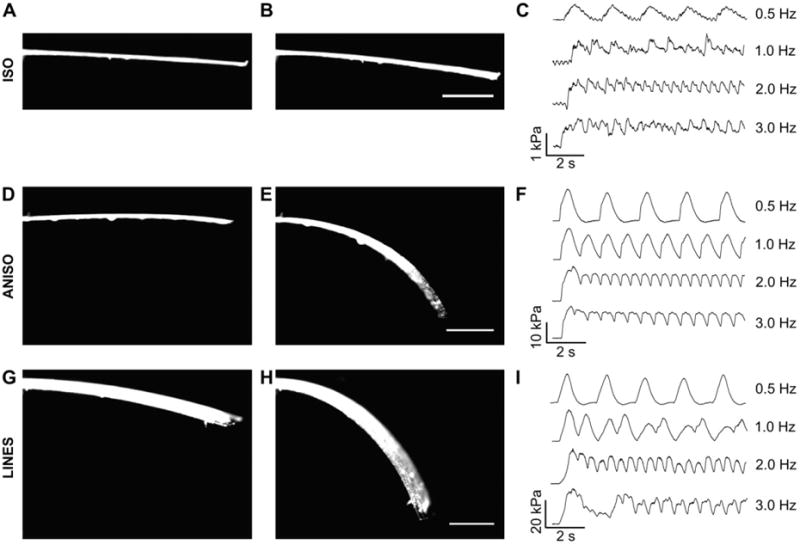
The contractile stress generated the engineered cardiac tissues was assessed using the MTF assay. ISO MTFs during (A) full diastole and (B) peak systole showed minimal visual deformation, but image processing to track changes in radius of curvature to calculate stress (C) revealed ∼1 kPa generated when paced from 0.5 to 3.0 Hz. ANISO MTFs during (D) full diastole and (E) peak systole showed large deformations corresponding to (F) ∼10 kPa generated during pacing from 0.5 to 3.0 Hz. LINES MTFs during (G) full diastole and (F) peak systole showed similar deformation to the anisotropic MTFs and (I) generated ∼10 kPa at 0.5 Hz pacing. Note that this MTF stress data correct for the tissue thickness but not the difference in substrate coverage between tissue types. Scale bars are 1 mm.
Supplementary video related to this article can be found at doi: 10.1016/j.biomaterials.2012.04.043.
The LINES tissue, paced at 0.5 Hz, generated ∼2 times the peak systolic stress of the ANISO and ∼20 times the peak systolic stress of the ISO tissue when corrected for the cell coverage on the MTF (Fig. 7). However, this large difference decreased at pacing frequencies greater than 0.5 Hz. While previous reports suggest a negative force-frequency in the rat heart [33], an alternative explanation in this case may account for the decline in systolic stress with increasing pacing frequency: the recruitment of hundreds of the multicellular strands during field stimulation. The LINES tissues require 2 to 3 times the field stimulation voltage to initiate contraction and with these higher voltages, still only a fraction of strands within the LINES tissues were captured at higher pacing frequencies. This is because each fiber has its own unique threshold for stimulation and field stimulation of the electrically decoupled, parallel multicellular strands is an inefficient means of recruitment. Thus, the LINES tissue, with discrete boundaries that enhanced sarcomere alignment, displayed a comparatively high peak systolic stress in spite of reduced recruitment at higher frequencies. These data suggest that tissue architecture plays an important role in muscle contractility.
Fig. 7.
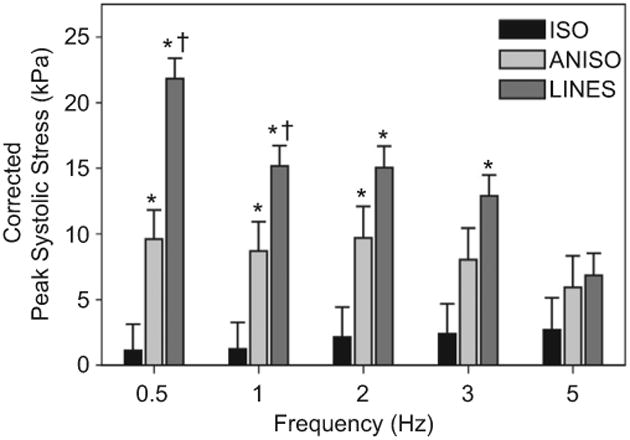
Stress–Frequency plot of peak systolic stress generated for the different tissue types at pacing rates of 0.5, 1, 2, 3 and 5 Hz for ISO, ANISO and LINES, corrected for tissue coverage. For ISO, there was not a statistically significant difference in peak systolic stress between pacing frequencies. Similarly, for ANISO there was not a statistically significant difference in peak systolic stress between pacing frequencies. Error bars are standard error of the mean. Statistical significance is based on Holm–Sidak pairwise comparison, (*) indicates P < 0.05 relative to ISO and (†) indicates P < 0.05 relative to ANISO.
3.5. Sarcomere contractile stress
The MTF assay measures contractile stress, defined as σMTF, calculated from the traction force necessary to deflect the MTF. If all the sarcomeres within the tissue are aligned along the longitudinal direction of the MTF, then σMTF will equal the stress generated by the sarcomeres, σSarcomere. However, we know from the quantitative sarcomere analysis that only a fraction of the sarcomeres is aligned in this direction, rTissue Type < 1 for all tissues (Fig. 5J). To determine the relationship between sarcomere alignment and contractility, we plotted rTissue Type versus σMTF for the ISO, ANISO and LINES when paced at 0.5 Hz (Fig. 8A). Note that rISO is 2/π, which is the value for isotropic distribution of sarcomere orientation vectors. We can calculate σSarcomere = σMTF/rTissue Type, which corresponds to intersection of the dashed lines in Fig. 8A with the vertical line for r = 1. This analysis reveals that σSarcomere increases with sarcomere alignment (Fig. 8B). This suggests that the peak stress generated by the sarcomeres changes as a function of the uniaxial alignment of the sarcomeres. The increase may be due to several factors, such as the increase in parallel registration of the sarcomeres at the Z-disc, and thus cooperatively, of the sarcomeres in the more aligned tissues. In other words, resultant tissue contractility is directly dependent on the cellular and subcellular architecture.
Fig. 8.
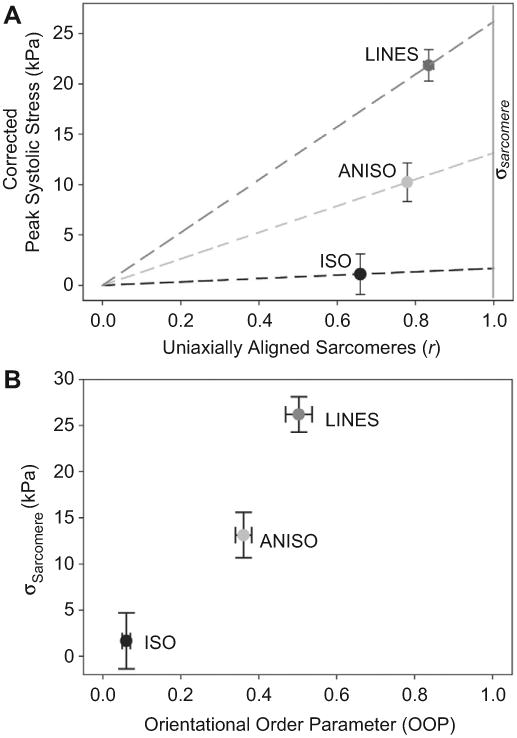
(A) Plot of peak systolic stress corrected for tissue coverage at 0.5 Hz pacing versus the fraction of uniaxially aligned sarcomeres (r). Dashed lines intersecting ISO, ANISO and LINES correspond to the linear relationship σMTF = r*σSarcomere for each tissue type. The vertical gray line labeled σSarcomere at r = 1 indicates 100% uniaxial sarcomere alignment, which is an estimate of the stress generated by the actual sarcomere along the myofibril. (B) Plot of orientational order parameter (OOP) versus σSarcomere for each tissue type. Error bars are standard error of the mean.
4. Discussion
When comparing our results versus previous studies, the first metric to consider is the tissues themselves. The conduction velocities and APDs for the ISO, ANISO and LINES are comparable to previously published results [10,34]. Additional in vitro studies report differences in Ca2+ handling as a function of tissue architecture, with anisotropic cardiac monolayers (relative to isotropic controls) displaying Ca2+ handling that mimics observations in isolated tissue preparations [11,28,35]. Thus, the tissue architectures we studied have electrophysiological characteristics similar to those in other reports.
Studies of contractile strength in engineered cardiac muscle tissues are rare, but there is recent work by Black et al., where the investigators engineered isotropic and anisotropic cardiac tissues in 3D fibrin gels and reported an increased twitch force for the anisotropic tissue of ∼180% [36]. Our data show the same trend in increasing contractile strength with cellular alignment, but with an even greater increase of >1,000% between isotropic and anisotropic organixation. However, our study was designed to test the hypothesis we have pursued in our single cell studies [13–15], namely, that boundary conditions imposed on a myocyte are important in potentiating the polarization of contractile apparatus within the cell. Computational studies and traction force microscopy experiments with neonatal rat ventricular myocytes illustrated that in isolated cells, boundaries in the form of geometric cues within the ECM are sufficient for myofibril maturation, parallel bundling of myofibrils, and increases in contractile stress [16]. The current study represents an attempt to gauge how these structure–function hierarchies extend to multicellular systems, namely a self-organized tissue. Whereas our previous studies constrained single cells to micropatterned FN islands, where the boundaries were ‘hard’, i.e., a step function increase from non-adhesive to adhesive, the current study's anisotropic constructs have boundaries due to both substrate adhesivity and a ‘soft’ boundary of an adjacent myocyte. Similar to our single cell studies, in this study we showed that boundary conditions in the extracellular space can direct hierarchal, structural order in cardiac tissue. The increase in sarcomere alignment is correlated with a substantial increase in contractile stress generation. These data suggest that the strength of muscle contraction is regulated by hierarchal architecture within the tissue as well as the more traditionally considered soluble mitogens and pacing frequency.
Previously, we demonstrated that geometric cues within the ECM drive the self-organization of sarcomeres and the alignment of myofibrils in single, engineered cardiac myocytes [13,14,24]. This has enabled us to develop a mathematical model of how these extracellular cues potentiate a break in the symmetry of the intracellular space and subsequent polarization of the contractile apparatus [16]. These single cardiac myocyte results, coupled with our results reported here and the work of Costa et al., [37], suggest a possible role for a hierarchy of boundary conditions at both the cellular and tissue level that are advantageous in the spatiotemporal coordination of cardiac contraction.
5. Conclusions
We have described a functional role for extracellular heterogeneities in the organization of engineered cardiac muscle, which enhances systolic performance in the heart by potentiating the spatially ordered assembly of the contractile apparatus. To do this, we were able to mimic in vivo organizational cues such as ECM fibrils, sinuses, and other cell types by using the in vitro micro-patterning of FN onto soft PDMS substrates. This resulted in engineered cardiac muscle with varying degrees of alignment that had distinct hierarchal structures and electromechanical function. Importantly, we were able to combine quantitative image analysis of sarcomere alignment with analysis of contractile function to evaluate this structure–function relationship. The transition from isotropic tissue organization to increased uniaxial alignment was associated with enhanced calcium handling and faster CVs, which resulted in a dramatic increase in peak systolic stress of >10-fold. The data suggest that engineering the extracellular space is an effective means of enslaving the cardiac myocyte's ability to self-organize its contractile apparatus in such a manner as to maximize the contractile strength of muscle. Thus, the findings herein suggest that it is not the presence of the heterogeneities that might be pathological, but their form and how their form impacts the inter- and intra-cellular architecture of the muscle tissue.
Supplementary Material
References
- 1.Legrice IJ, Smaill BH, Chai LZ, Edgar SG, Gavin JB, Hunter PJ. Laminar structure of the heart – ventricular myocyte arrangement and connective-tissue architecture in the dog. Am J Physiol Heart Circ Physiol. 1995;38(2):H571–82. doi: 10.1152/ajpheart.1995.269.2.H571. [DOI] [PubMed] [Google Scholar]
- 2.Parker KK, Ingber DE. Extracellular matrix, mechanotransduction and structural hierarchies in heart tissue engineering. Philos Trans R Soc Lond B Biol Sci. 2007;362(1484):1267–79. doi: 10.1098/rstb.2007.2114. [DOI] [PMC free article] [PubMed] [Google Scholar]
- 3.Azzawi M, Kan SW, Hillier V, Yonan N, Hutchinson IV, Hasleton PS. The distribution of cardiac macrophages in myocardial ischaemia and cardiomy-opathy. Histopathology. 2005;46(3):314–9. doi: 10.1111/j.1365-2559.2005.02075.x. [DOI] [PubMed] [Google Scholar]
- 4.Young AA, Legrice IJ, Young MA, Smaill BH. Extended confocal microscopy of myocardial laminae and collagen network. J Microsc. 1998;192(2):139–50. doi: 10.1046/j.1365-2818.1998.00414.x. [DOI] [PubMed] [Google Scholar]
- 5.Pope AJ, Sands GB, Smaill BH, LeGrice IJ. Three-dimensional transmural organization of perimysial collagen in the heart. Am J Physiol Heart Circ Physiol. 2008;295(3):H1243–52. doi: 10.1152/ajpheart.00484.2008. [DOI] [PMC free article] [PubMed] [Google Scholar]
- 6.Janicki JS, Brower GL. The role of myocardial fibrillar collagen in ventricular remodeling and function. J Card Fail. 2002;8(6):S319–25. doi: 10.1054/jcaf.2002.129260. [DOI] [PubMed] [Google Scholar]
- 7.Seo K, Inagaki M, Nishimura S, Hidaka I, Sugimachi M, Hisada T, et al. Structural heterogeneity in the ventricular wall plays a significant role in the initiation of stretch-induced arrhythmias in perfused rabbit right ventricular tissues and whole heart preparations. Circ Res. 2010;106(1):176–84. doi: 10.1161/CIRCRESAHA.109.203828. [DOI] [PubMed] [Google Scholar]
- 8.Lim ZY, Maskara B, Aguel F, Emokpae R, Tung L. Spiral wave attachment to millimeter-sized obstacles. Circulation. 2006;114(20):2113–21. doi: 10.1161/CIRCULATIONAHA.105.598631. [DOI] [PubMed] [Google Scholar]
- 9.Rohr S, Scholly D, Kleber A. Patterned growth of neonatal rat heart cells in culture. Morphological and electrophysiological characterization. Circ Res. 1991;68(1):114–30. doi: 10.1161/01.res.68.1.114. [DOI] [PubMed] [Google Scholar]
- 10.Bursac N, Parker KK, Iravanian S, Tung L. Cardiomyocyte cultures with controlled macroscopic anisotropy - a model for functional electrophysio-logical studies of cardiac muscle. Circ Res. 2002;91:E45–54. doi: 10.1161/01.res.0000047530.88338.eb. Circulation Research. [DOI] [PubMed] [Google Scholar]
- 11.Chung Cy, Bien H, Sobie EA, Dasari V, McKinnon D, Rosati B, et al. Hyper-trophic phenotype in cardiac cell assemblies solely by structural cues and ensuing self-organization. FASEB J. 2011;25(3):851–62. doi: 10.1096/fj.10-168625. [DOI] [PMC free article] [PubMed] [Google Scholar]
- 12.Motlagh D, Hartman TJ, Desai TA, Russell B. Microfabricated grooves recapitulate neonatal myocyte connexin43 and n-cadherin expression and localization. J Biomed Mater Res Part A. 2003;67A(1):148–57. doi: 10.1002/jbm.a.10083. [DOI] [PubMed] [Google Scholar]
- 13.Geisse NA, Sheehy SP, Parker KK. Control of myocyte remodeling in vitro with engineered substrates. In Vitro Cell Dev Biol Anim. 2009;45(7):343–50. doi: 10.1007/s11626-009-9182-9. [DOI] [PubMed] [Google Scholar]
- 14.Parker KK, Tan J, Chen CS, Tung L. Myofibrillar architecture in engineered cardiac myocytes. Circ Res. 2008;103(4):340–2. doi: 10.1161/CIRCRESAHA.108.182469. [DOI] [PMC free article] [PubMed] [Google Scholar]
- 15.Bray MA, Sheehy SP, Parker KK. Sarcomere alignment is regulated by myocyte shape. Cell Motil Cytoskeleton. 2008;65(8):641–51. doi: 10.1002/cm.20290. [DOI] [PMC free article] [PubMed] [Google Scholar]
- 16.Grosberg A, Kuo PL, Guo CL, Geisse NA, Bray MA, Adams WJ, et al. Self-organization of muscle cell structure and function. PLoS Comput Biol. 2011;7(2):e1001088. doi: 10.1371/journal.pcbi.1001088. [DOI] [PMC free article] [PubMed] [Google Scholar]
- 17.Feinberg AW, Feigel A, Shevkoplyas SS, Sheehy S, Whitesides GM, Parker KK. Muscular thin films for building actuators and powering devices. Science. 2007;317(5843):1366–70. doi: 10.1126/science.1146885. [DOI] [PubMed] [Google Scholar]
- 18.Bursac N, Papadaki M, Cohen RJ, Schoen FJ, Eisenberg SR, Carrier R, et al. Cardiac muscle tissue engineering: toward an in vitro model for electro-physiological studies. Am J Physiol Heart Circ Physiol. 1999;277(2):H433–44. doi: 10.1152/ajpheart.1999.277.2.H433. [DOI] [PubMed] [Google Scholar]
- 19.Thomas SP, Bircher-Lehmann L, Thomas SA, Zhuang J, Saffitz JE, Kleber AG. Synthetic strands of neonatal mouse cardiac myocytes: structural and electrophysiological properties. Circ Res. 2000;87(6):467–73. doi: 10.1161/01.res.87.6.467. [DOI] [PubMed] [Google Scholar]
- 20.Fedorov VV, Lozinsky IT, Sosunov EA, Anyukhovsky EP, Rosen MR, Balke CW, et al. Application of blebbistatin as an excitation-contraction uncoupler for electrophysiologic study of rat and rabbit hearts. Heart Rhythm. 2007;4(5):619–26. doi: 10.1016/j.hrthm.2006.12.047. [DOI] [PubMed] [Google Scholar]
- 21.Bayly PV, KenKnight BH, Rogers JM, Hillsley RE, Ideker RE, Smith WM. Estimation of conduction velocity vector fields from epicardial mapping data. IEEE Trans Biomed Eng. 1998;45(5):563–71. doi: 10.1109/10.668746. [DOI] [PubMed] [Google Scholar]
- 22.Kovesi PD. Matlab and octave functions for computer vision and image processing. School of Computer Science & Software Engineering, The University of Western Australia; 2006. [cited 2006]; Available from: http://www.csse.uwa.edu/au∼pk/research/matlabfns/ [Google Scholar]
- 23.Hong L, Wan Y, Jain A. Fingerprint image enhancement: algorithm and performance evaluation. IEEE Trans Pattern Anal Mach Intell. 1998;20(8):777–89. [Google Scholar]
- 24.Bray MAP, Adams WJ, Geisse NA, Feinberg AW, Sheehy SP, Parker KK. Nuclear morphology and deformation in engineered cardiac myocytes and tissues. Biomaterials. 2010;31(19):5143–50. doi: 10.1016/j.biomaterials.2010.03.028. [DOI] [PMC free article] [PubMed] [Google Scholar]
- 25.Hamley IW. Introduction to soft matter: synthetic and biological self-assembling materials. Chichester, England/Hoboken, NJ: John Wiley & Sons; 2007. [Google Scholar]
- 26.Fechete R, Demco DE, Blümich B. Order parameters of the orientation distribution of collagen fibers in achilles tendon by 1H NMR of multipolar spin states. NMR Biomed. 2003;16(8):479–83. doi: 10.1002/nbm.854. [DOI] [PubMed] [Google Scholar]
- 27.Umeno A, Ueno S. Quantitative analysis of adherent cell orientation influenced by strong magnetic fields. IEEE Trans Nanobiosci. 2003;2(1):26–8. doi: 10.1109/tnb.2003.810157. [DOI] [PubMed] [Google Scholar]
- 28.Pong T, Adams WJ, Bray MA, Feinberg AW, Sheehy SP, Werdich AA, et al. Hierarchical architecture influences calcium dynamics in engineered cardiac muscle. Exp Biol Med. 2011;236(3):366–73. doi: 10.1258/ebm.2010.010239. [DOI] [PMC free article] [PubMed] [Google Scholar]
- 29.Alford PW, Feinberg AW, Sheehy SP, Parker KK. Biohybrid thin films for measuring contractility in engineered cardiovascular muscle. Biomaterials. 2010;31:3613–21. doi: 10.1016/j.biomaterials.2010.01.079. [DOI] [PMC free article] [PubMed] [Google Scholar]
- 30.Camelliti P, McCulloch AD, Kohl P. Microstructured cocultures of cardiac myocytes and fibroblasts: a two-dimensional in vitro model of cardiac tissue. Microsc Microanal. 2005;11(3):249–59. doi: 10.1017/S1431927605050506. [DOI] [PubMed] [Google Scholar]
- 31.McDevitt TC, Woodhouse KA, Hauschka SD, Murry CE, Stayton PS. Spatially organized layers of cardiomyocytes on biodegradable polyurethane films for myocardial repair. J Biomed Mater Res A. 2003;66A(3):586–95. doi: 10.1002/jbm.a.10504. [DOI] [PubMed] [Google Scholar]
- 32.Domian IJ, Chiravuri M, van der Meer P, Feinberg AW, Shi X, Shao Y, et al. Generation of functional ventricular heart muscle from mouse ventricular progenitor cells. Science. 2009;326(5951):426–9. doi: 10.1126/science.1177350. [DOI] [PMC free article] [PubMed] [Google Scholar]
- 33.Nalivaiko E, Antunes VR, Paton JFR. Control of cardiac contractility in the rat working heart-brainstem preparation. Exp Physiol. 2010;95(1):107–19. doi: 10.1113/expphysiol.2009.048710. [DOI] [PubMed] [Google Scholar]
- 34.Beauchamp P, Choby C, Desplantez T, de Peyer K, Green K, Yamada KA, et al. Electrical propagation in synthetic ventricular myocyte strands from germline connexin43 knockout mice. Circ Res. 2004;95(2):170–8. doi: 10.1161/01.RES.0000134923.05174.2f. [DOI] [PubMed] [Google Scholar]
- 35.Yin LH, Bien H, Entcheva E. Scaffold topography alters intracellular calcium dynamics in cultured cardiomyocyte networks. Am J Physiol Heart Circ Physiol. 2004;287(3):H1276–85. doi: 10.1152/ajpheart.01120.2003. [DOI] [PubMed] [Google Scholar]
- 36.Black LD, Meyers JD, Weinbaum JS, Shvelidze YA, Tranquillo RT. Cell-induced alignment augments twitch force in fibrin gel–based engineered myocardium via gap junction modification. Tissue Eng Part A. 2009;15(10):3099–108. doi: 10.1089/ten.tea.2008.0502. [DOI] [PMC free article] [PubMed] [Google Scholar]
- 37.Costa KD, Takayama Y, McCulloch AD, Covell JW. Laminar fiber architecture and three-dimensional systolic mechanics in canine ventricular myocardium. Am J Physiol Heart Circ Physiol. 1999;276(2):H595–607. doi: 10.1152/ajpheart.1999.276.2.H595. [DOI] [PubMed] [Google Scholar]
Associated Data
This section collects any data citations, data availability statements, or supplementary materials included in this article.