Abstract
A variety of MRI acoustic radiation force imaging (MR-ARFI) pulse sequences as the means for image guidance of focused ultrasound therapy have been recently developed and tested ex vivo and in animal models. To successfully translate MR-ARFI guidance into human applications, ensuring that MR-ARFI provides satisfactory image quality in the presence of patient motion and deposits safe amount of ultrasound energy during image acquisition is necessary. The first aim of this work was to study the effect of motion on in vivo displacement images of the brain obtained with 2DFT spin-echo MR-ARFI. Repeated bipolar displacement encoding configuration was shown less sensitive to organ motion. The optimal signal-to-noise ratio of displacement images was found for the duration of encoding gradients of 12 ms. The second aim was to further optimize the displacement SNR for a particular tissue type by setting the time offset between the ultrasound emission and encoding based on the tissue response to acoustic radiation force. A method for measuring tissue response non-invasively was demonstrated. Finally, a new method for simultaneous monitoring of tissue heating during MR-ARFI acquisition was presented to enable timely adjustment of the ultrasound energy aimed at ensuring the safety of the MR-ARFI acquisition.
Keywords: MR guided High Intensity Focused Ultrasound (MRgHIFU), MR Acoustic Radiation Force Imaging (MR-ARFI), bipolar displacement encoding, brain tissue constant
Introduction
Magnetic resonance imaging (MRI) guided High Intensity Focused Ultrasound (MRgHIFU) promises a noninvasive alternative to conventional surgery. MRI guidance allows accurate placement of the acoustic focus and provides a set of monitoring and assessment tools, such as MR-based temperature monitoring and contrast-enhanced post-treatment imaging. MRgHIFU therapy has been used for ablation of tumors (1–4) and uterine fibroids (5), pain palliation of bone metastasis (6), functional surgery (7), and targeted drug delivery (8). The ultrasound beam has been visualized through imaging its thermal and non-thermal effects on the tissue.
Deposition of the sufficient amount of energy over time results in heating of the tissue at the focal spot, which is most commonly visualized using proton resonance frequency (PRF) shift thermometry (9). This technique is also currently used to visualize the position of the focal spot to calibrate the ultrasound system and to target the treatment. An alternative method of focal spot localization takes advantage of the acoustic radiation force exerted on the tissue by the propagating ultrasound wave. Application of an ultrasound pulse of several milliseconds can cause the displacement of tissue on the order of several microns and can be measured using a dedicated MRI technique, called magnetic resonance acoustic radiation force imaging (MR-ARFI) (10,11). MR-ARFI pulse sequences use the displacement encoding gradients synchronized with the emission of the ultrasound pulse to encode the displacement of tissue into the phase of the MRI signal. Due to its ability to visualize the location of the ultrasound focal spot using very low energy without causing irreversible changes in tissue, MR-ARFI presents an attractive tool for the guidance of HIFU procedures.
A variety of MR-ARFI pulse sequences have been recently developed and tested either ex vivo or in animal models. Both gradient-recalled echo (GRE) (11–14) and spin-echo (SE) (10,11,15–17) MR-ARFI sequences have been implemented in combination with either echo planar, line scan or 2D Fourier Transform (2DFT) readouts. To successfully translate MR-ARFI guidance into human applications, it is necessary to ensure that particular technique provides satisfactory image quality in the presence of patient motion and is safe considering the amount of ultrasound energy deposited during image acquisition.
Since all MR-ARFI sequences have motion-encoding gradients similar to those in diffusion-weighted MRI, they are prone to similar pitfalls, with the biggest one being sensitivity to patient motion (18). The longer the duration of the encoding gradients, the higher is the sensitivity to the displacement generated by acoustic force and undesired tissue bulk motion. The duration of the encoding gradient is also tied to the duration of the ultrasound pulse, which is commonly of the same or longer duration than the encoding gradient pulse. To keep ultrasound energy deposition minimal, it is desired to minimize the duration of the ultrasound pulse. However, application of the ultrasound needs to be sufficiently long to produce measurable displacement of tissue. Therefore the first aim of this work was to study the effect of motion on in vivo MR-ARFI displacement images of the brain. Second, we propose methods to maximize the signal-to-noise ratio (SNR) of displacement images for a given level of ultrasound energy. And third, we demonstrate a new way for simultaneous monitoring of tissue heating during MR-ARFI acquisition; so that timely adjustment of the ultrasound energy could be performed to ensure the safety of the imaging procedure.
When using single-shot EPI or line scan readouts with diffusion-weighted sequences, motion has minimal effect on the image quality. In 2DFT diffusion-weighted pulse sequences, however, organ motion may result in severe ghosting artifacts in the phase-encode direction due to incoherent phase changes occurring at each repetition time (TR) (18). At the same time, 2DFT sequences have superior image quality; therefore, we studied the effect of brain motion on MR-ARFI displacement images using a 2DFT-based sequence. First, we analyzed the influence of encoding gradient configuration on the level of image ghosting by comparing two bipolar encoding configurations: repeated bipolar (15) and inverted bipolar designs (14,16). Both configurations were tested with and without cardiac gating. Second, we studied how the SNR of displacement images changes with encoding duration, and therefore ultrasound pulse duration, by measuring the displacement signal in ex vivo brain tissue and measuring displacement noise using in vivo brain images of human subjects.
In the second part of our study we considered the influence of the temporal tissue response to acoustic radiation force on the amount of encoded displacement phase. It was previously reported that it took 17 ms for tissue displacement to reach maximum in a phantom material (10). Therefore the researchers applied the ultrasound pulse milliseconds before the encoding gradient. In order to maximize encoded displacement phase for a given encoding configuration in tissue, the tissue response has to be known. Here we demonstrate how this response can be measured with an MR-ARFI-based method. We then show how for particular tissue, the relative position of the encoding gradients and the ultrasound pulse can be optimized in order to maximize the displacement phase.
No temperature rise was observed when ultrasound energy equivalent to that deposited during a single MR-ARFI acquisition was applied ex vivo (14,16). However, depending on parameters such as tissue absorption coefficient, acoustic power and duty cycle, and the number of scan repetitions, these emissions can potentially lead to tissue heating (17). A way to simultaneously obtain temperature and displacement information using a GRE-based MR-ARFI pulse sequence was recently developed by Viallion et al. (13). In the third part of this work we show how a spin-echo MR-ARFI pulse sequence can be adapted to provide simultaneous temperature and displacement measurements.
Background
MR-ARFI is the most recent in the list of many methods that visualize the displacement of tissue caused by acoustic radiation force. Previously developed methods served mostly diagnostic purposes and were based on the concept of remote tissue palpation using acoustic radiation force impulse imaging (19,20), shear wave elasticity imaging or transient elastography (21–23), Supersonic imaging (24,25), and vibro-acoustography (26,27).
MR-ARFI is a promising tool for the guidance of focused ultrasound therapy (10,16,28,29). It allows visualization of the focal spot with little energy deposition (16,29) and without dependence on the effect of the PRF shift. The latter characteristic is particularly advantageous (30) in highly adipose tissue, like breast, where PRF shift thermometry becomes unreliable (1,2) and T1-based thermometry has low sensitivity (31). Due to its sensitivity to the mechanical properties of tissue, MR-ARFI also has the potential as a treatment-monitoring and assessment tool. For example, in HIFU ablation of cadaver breast tissue, MR-ARFI measurements demonstrated decreased displacement of tissue in the treated region (32). Finally, the dependence of tissue displacement on the quality of the ultrasound beam has been successfully exploited using MR-ARFI to correct ultrasound phase aberrations (14,33) in adaptive focusing procedures.
The displacement of tissue is encoded as a phase shift in MR-ARFI images according to:
| [1] |
where φ is the phase shift of MR signal, γ is the proton gyromagnetic ratio, Genc (t) is the amplitude of encoding gradient, T0 and Tenc are the times encoding starts and ends, and x(t) is tissue displacement over time in response to acoustic radiation force. The response of tissue x(t), depending on its elasticity and viscosity, can be approximated with the overdamped response model (23) according to:
| [2] |
where Ton and Toff denote the beginning and the end of the ultrasound pulse, k is a proportionality constant relating force and displacement, and the ratio F/k is the maximum displacement that tissue would achieve given an infinitely long ultrasound emission. The time constants τrise and τdecay describe the transient response. Currently accurate modeling of tissue response is challenging because the time constants are not known for most tissues (23) and only several measurements obtained using ultrasound have been reported in literature (12,19). For in vivo muscle tissue, the rise time tissue constant was 3.2 ms and the decay time constant was 5.5 ms (12). For ex vivo liver tissue, the rise time tissue constant was 6.2 ms and the decay time constant was 7.9 ms (19).
Methods
Measuring tissue displacement with MR-ARFI
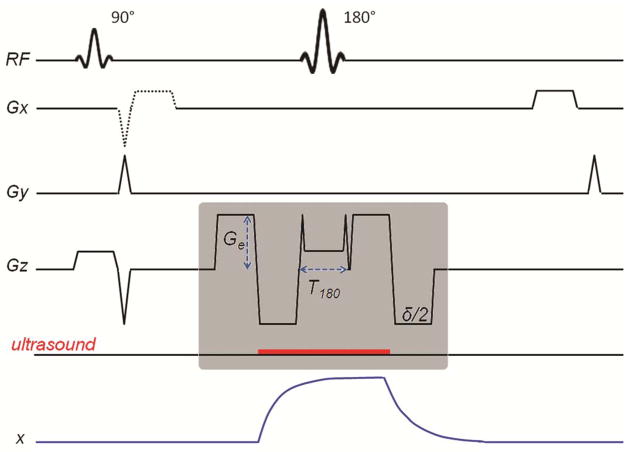
MR images analyzed in this work were acquired on a 3T GE Signa MR scanner (GE Healthcare, Milwaukee, WI) using spin-echo MR-ARFI pulse sequence shown in Figure 1 and a 2D flat phased-array HIFU transducer (ExAblate® 2000, InSightec Inc, Haifa, Israel) operated at the central frequency of 550 kHz. The transducer had 1024 electronically-steered elements with total active area of 80 × 80 mm2. Ultrasound was applied in ex vivo experiments only. The strength of the displacement encoding gradient was set to 40 mT/m and the gradient rise time to 40 mT/m amplitude was 268 μs. In all experiments, tissue displacement was measured by subtraction of two phase images, φ+ and φ−, obtained with the MR-ARFI sequence using opposite polarity of the encoding gradients as described by McDannold et al. (10). The subtraction of two phase images doubles the displacement due to acoustic radiation force and removes the background phase due to inhomogeneities of the magnetic field (10). The final phase difference due to displacement was expressed as:
| [3] |
Figure 1.
Pulse sequence diagram of MR-ARFI SE pulse sequence. The gray box encloses the displacement encoding module of the pulse sequence showing the timing of encoding gradients and the emission of the ultrasound pulse (red line). The waveform of tissue displacement, x, is shown. An optional readout gradient used to acquire a gradient-echo image simultaneously with the SE image is shown with a dotted line and is fully introduced in the last part of the “Materials and Methods” section.
The phase difference Δφd due to tissue displacement will be referred to as displacement phase in the rest of the manuscript.
Comparing bipolar encoding configurations in spin-echo MR-ARFI
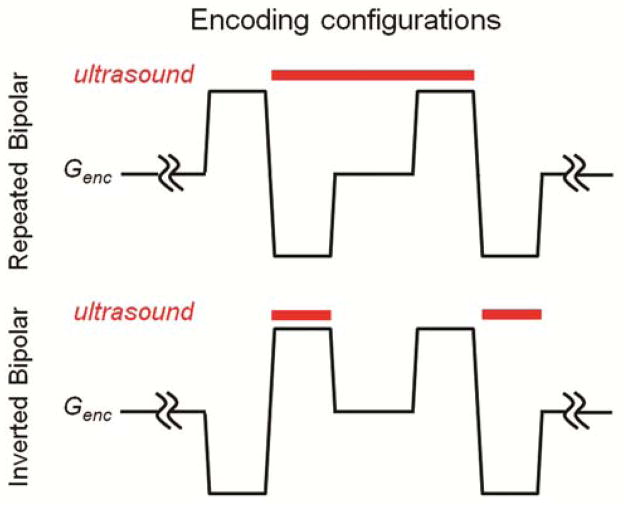
The repeated (15) and inverted bipolar (16) encoding configurations (Figure 2) have equivalent sensitivity to the displacement of tissue due to the radiation force. However, when it comes to brain bulk motion, the repeated bipolar configuration is expected to be much less susceptible than inverted configuration, which has a non-zero first gradient moment. To analyze the influence of the encoding scheme on the motion artifacts of the in vivo brain MR-ARFI images, four normal volunteers were scanned using MR-ARFI sequence shown in Figure 1 with both types of encoding configurations. No ultrasound was applied. Three different encoding durations, δ, were used: 3 ms, 12.2 ms and 22 ms. Images with and without cardiac gating were obtained. Every scan was repeated twice.
Figure 2.
Diagram of the two types of displacement encoding configurations showing the timing of the displacement encoding gradients (thin black line) and the ultrasound emission (thick red line). In repeated bipolar configuration, a single ultrasound pulse is applied during the second and the third lobes of the bipolar gradient pair. In the inverted bipolar configuration, the ultrasound emission is broken into two pulses, one applied during the second lobe and the other during the fourth lobe of the encoding bipolar pair.
The direction of encoding was chosen to be the primary direction of the ultrasound beam in human treatments, in the superior-interior direction. The echo time varied from 22 ms to 60 ms, depending on the encoding gradient’s duration. Other imaging parameters are listed in the first column of Table 1. The eight-channel head RF coil was used.
Table 1.
MR imaging parameters used in different experiments. In vivo 1 is comparison of bipolar encoding configurations. In vivo 2 and ex vivo 1 are the in vivo and ex vivo parameters used in optimization of encoding duration study. Ex vivo 2 parameters were used during the tissue response measurement study. The duration of acquisition time was 140 s for TR of 1s, and 114 s for TR of 800 ms.
| Parameter | In Vivo 1 | In Vivo 2 | Ex Vivo 1 | Ex Vivo 2 |
|---|---|---|---|---|
| Encoding time (δ), ms | 0 – 22 | 0 – 22 | 0 – 22 | 1 |
| Ultrasound pulse, ms | none | none | 0 – 26 | 9.5 |
| Echo time, ms | 22 – 60 | 14 – 60 | 14 – 60 | 95 |
| Repetition time, ms | 1000 | 1000 | 1000 | 800 |
| Field-of-view, cm2 | 24 | 24 | 16 | 16 |
| Matrix size | 256 × 128 | 256 × 128 | 128 × 128 | 256 × 128 |
| Bandwidth, kHz | 15.63 | 15.63 | 15.63 | 8.1 |
The average signal intensity was measured in every image in the area outside of subjects’ head boundaries in the phase-encode direction, to the left and to the right from the head. These measurements were aggregated into four different groups. Groups 1 and 2 consisted of images obtained using repeated and inverted bipolar encoding respectively. No cardiac gating was used in these groups. Groups 3 and 4 consisted of images obtained with cardiac gating using repeated and inverted bipolar encoding respectively. Each group contained images obtained with three different encoding durations. First, the effect of encoding configuration was studied by comparing group 1 to group 2 and group 3 to group 4. The sample size of each group was 22. The effect of gating was studied by comparing groups 1 and 3, and then groups 2 and 4. Statistical significance of the observations (P < 0.05) was evaluated using a matched pair t-test.
Optimization of encoding duration for MR-ARFI in the presence of motion
Using the encoding configuration that resulted in lower motion artifacts in the previous section, the expected displacement signal-to-noise ratio (SNR) was studied as a function of encoding gradients’ duration. To compute the expected displacement SNR in brain, displacement signal measurements were performed in ex vivo brain, and displacement noise, or standard deviation of displacement with no ultrasound applied, was measured in volunteers. Displacement SNR was computed for the duration of the encoding gradients, δ, varied from 0 ms to 22 ms, where the longest gradients corresponded to diffusion weighting with b-value of 225 s/mm2 and ultrasound pulse duration of 26 ms.
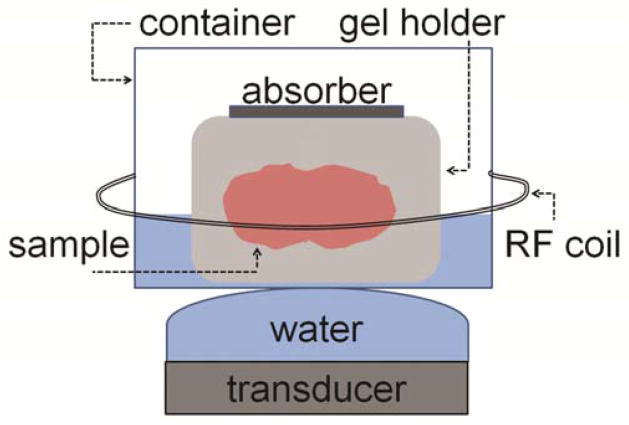
Ex vivo displacement phase was measured in a whole porcine brain tissue (n = 5). The displacement phase images were calculated according to Equation 3. The displacement signal was taken as the mean displacement phase calculated in the small region of interest (ROI) in the focal spot of ex vivo images. The brain tissue was obtained from a pig approximately 24 hours before the experiments and was refrigerated. During the study the tissue was kept at room temperature. The experimental setup (Figure 3) consisted of the gel holder containing the brain tissue sample which was placed into a plastic container filled with degassed water, and was covered with acoustic absorber. The plastic container was positioned on top of the ultrasound transducer covered with acoustically transparent Mylar® membrane filled with water. A solenoid breast RF coil was placed around the container. The ultrasound beam was focused inside the brain at a depth of 54 mm from the center of the transducer. The transducer emitted pulses with acoustic power of 23 W and with duration equal to encoding duration, δ, plus duration of the crushers and the slice select gradient of 180° RF pulse, T180. Other imaging parameters are listed in the second column of Table 1.
Figure 3.
Schematic of the experimental setup used in the ex vivo experiments. Porcine brain inside a gel holder is placed into a plastic container filled with degassed water and covered with an acoustic absorber. The container is put on top of the phase-array planar transducer covered with an inflated membrane filled with degassed water. A solenoid radiofrequency coil is placed around the container.
The expected in vivo displacement noise was calculated using displacement images obtained in normal volunteers (n = 5), by measuring the standard deviation of displacement phase in the ROI inside the brain. The MR-ARFI pulse sequence shown in Figure 1 with parameters listed in the third column of Table 1.
Measuring tissue response with MR-ARFI. Optimal encoding timing
Due to the observed non-instantaneous response of tissue to acoustic radiation force, tissue displacement does not reach maximum immediately after ultrasound turns on, and it does not decrease to zero instantly at the end of the ultrasound pulse. Therefore, in the bipolar encoding design, synchronous application of ultrasound and encoding may not be the most optimal. Knowledge of tissue response can help compute the timing of the ultrasound pulse and the encoding gradient lobes that can further optimize the SNR of displacement images. Here we first show how tissue temporal response could be measured with MR-ARFI. Then we compute the optimal timing of the ultrasound pulse and the encoding gradient lobes for particular time constants of tissue response.
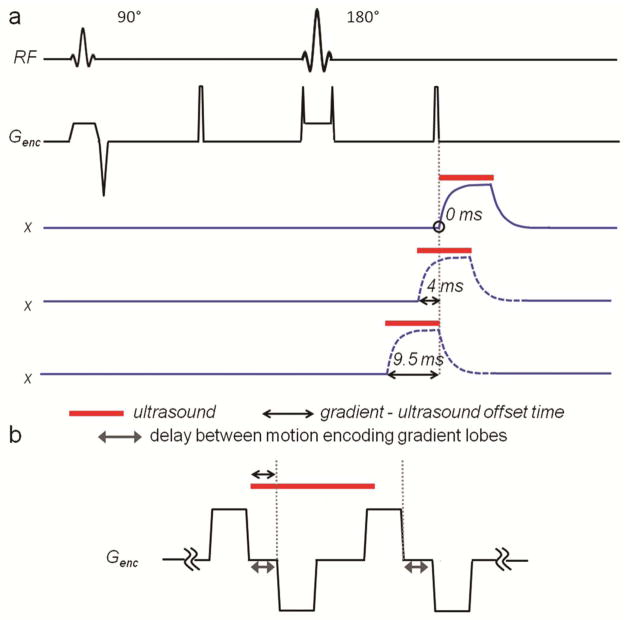
To measure tissue response with MR-ARFI the displacement was sampled over time with an encoding gradient of much shorter duration than ultrasound pulse as schematically shown in Figure 4a. The ultrasound pulse duration was set to 9.5 ms, and the repeated bipolar encoding configuration was replaced with a unipolar one of 1 ms duration. The timing of the gradients was kept constant, but the start time of the ultrasound emission was offset in such a way, that the gradient sampled the displacement of tissue before the ultrasound was turned on, during the ultrasound pulse, and after it was turned off. Gradient-ultrasound offset time of 0 ms corresponded to the case where the end of the encoding gradient and the start of the ultrasound pulse had the same time. Offset time greater than 9.5 ms indicated that the gradient was used to encode displacement after the ultrasound was turned off.
Figure 4.
a: Partial diagram of MR-ARFI pulse sequence, modified for measurement of tissue time constants. The gradient waveforms of encoding gradient only are shown here. Short unipolar gradients are used. The timing of three ultrasound emissions is shown (red line). Tissue displacement corresponding to each ultrasound pulse is shown in blue. Black arrow indicates the endpoints of the gradient-ultrasound time offset, which was varied in this study. The offset of 0 ms (top displacement waveform) corresponds to the case, where the end of the encoding gradient and the start of the ultrasound pulse have the same time, which is circled in the diagram. The duration of the ultrasound pulse is 9.5 ms and the duration of the encoding gradient is 1 ms. b: Diagram of the encoding gradients and ultrasound pulse combinations used to model the effect of gradient-ultrasound offset and the delay between the motion encoding gradient lobes on the displacement phase SNR.
This approach was tested in ex vivo brain tissue using the experimental setup described above with transducer focused 67 mm away from its center, and acoustic power of 100 W. The imaging parameters used in this experiment are listed in the fourth column of Table 1. For the times when encoding gradient overlapped with the ultrasound pulse, the full width at half maximum (FWHM) of the displacement profile at the focal spot was measured. For all time points of the measurements, the average displacement at the focal spot was measured.
Using experimentally obtained tissue response parameters, the tissue response was modeled according to Equation 2. Encoding gradients were set to the optimal configuration and optimal displacement SNR-wise duration. Then, the displacement phase was computed using Equation 1. Gradient-ultrasound offset time and the delay between the positive and negative lobes of the encoding gradient were varied as shown in Figure 4b. The gradient-ultrasound offset time was varied from − 3 ms to + 6 ms in 200 μs steps. The delay between the positive and negative lobes of the encoding gradients was varied from 0 ms to 9 ms in 200 μs steps. In addition to displacement phase, the displacement phase SNR was calculated using both theoretically and experimentally estimated displacement phase noise. The theoretical estimation took into account the effect of the delay between the gradient lobes on the echo time and diffusion weighting of the image. The experimental estimation used the displacement phase noise data obtained in the experiment described in the previous section. The displacement phase and noise were normalized to the values obtained when the time between the gradient lobes and the offset of the ultrasound pulse were 0 ms.
Modifications in spin-echo MR-ARFI pulse sequence to measure temperature rise
In order to monitor a temperature rise during an MR-ARFI spin-echo acquisition, an additional readout was inserted between 90° and 180° RF pulses as shown with dotted line in Figure 1. The pulse sequence was tested in ex vivo porcine brain tissue using experimental setup described earlier. The ultrasound beam was focused inside tissue 72 mm away from the face of the transducer. The ultrasound acoustic power was varied from 37 W to 185 W in steps of 18 W, and at each power level a temperature rise map and a displacement map were acquired simultaneously. Temperature maps, based on PRF shift, were calculated from phase data of the gradient-recalled echo images by subtracting the reference phase with ultrasound turned off. The following imaging parameters were used: FOV = 16 cm2, matrix size = 128 × 128, BW = 15.63 kHz, TR = 1 s, gradient-echo TE = 10 ms and spin-echo TE = 47 ms. The duration of encoding gradient lobe was 5.9 ms, resulting in b-value of 38 s/mm2. The duration of the ultrasound pulse was 18 ms.
Results
Comparing bipolar encoding configurations in spin-echo MR-ARFI
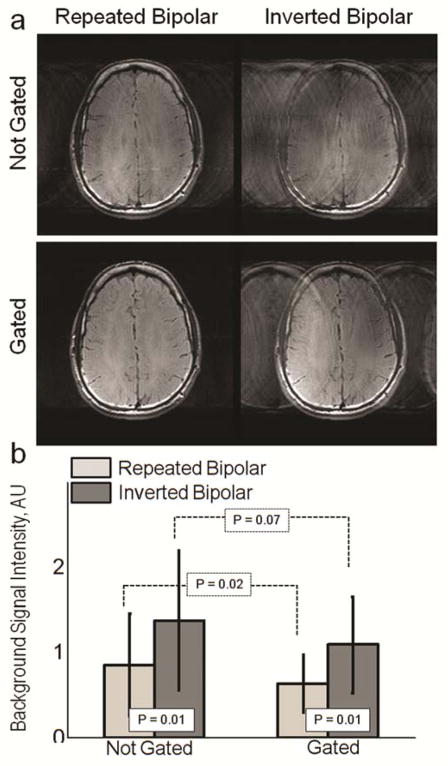
The example magnitude images obtained using two encoding configurations without and with cardiac gating are shown in Figure 5a. Image artifact, observed as elevated background signal in the phase encode direction is more pronounced in the inverted bipolar case for both not gated and gated cases. An effect of cardiac gating on the level of ghosting is seen in the repeated bipolar images. Average background signal intensity is presented for not-gated and gated cases in Figure 5b. Comparison between repeated and inverted bipolar encoding showed significantly higher background signal for inverted case both with and without gating (P = 0.01). The effect of gating on reduction of motion artifacts was found statistically significant with repeated bipolar configuration (P = 0.02), and statistically insignificant with inverted bipolar configuration (P = 0.07). Based on these results repeated bipolar configuration was selected for further optimization.
Figure 5.
a: Example magnitude images obtained using SE MR-ARFI pulse sequence with repeated or inverted bipolar encoding configurations for not-gated and gated cases. Increased signal intensity in the background is more pronounced in the images acquired using the inverted bipolar configuration. The effect of gating on the level of ghosting is seen in the repeated bipolar images. b: Experimentally derived average background signal intensity in the background from ghosting is presented for not-gated and gated cases. Comparison between repeated and inverted bipolar encoding showed significantly higher background signal for inverted case both with and without gating (P = 0.01). The effect of gating on reduction of motion artifact was found statistically significant with repeated bipolar configuration (P = 0.02), and statistically insignificant with inverted bipolar configuration (P = 0.07).
Optimization of encoding duration for MR-ARFI in the presence of motion
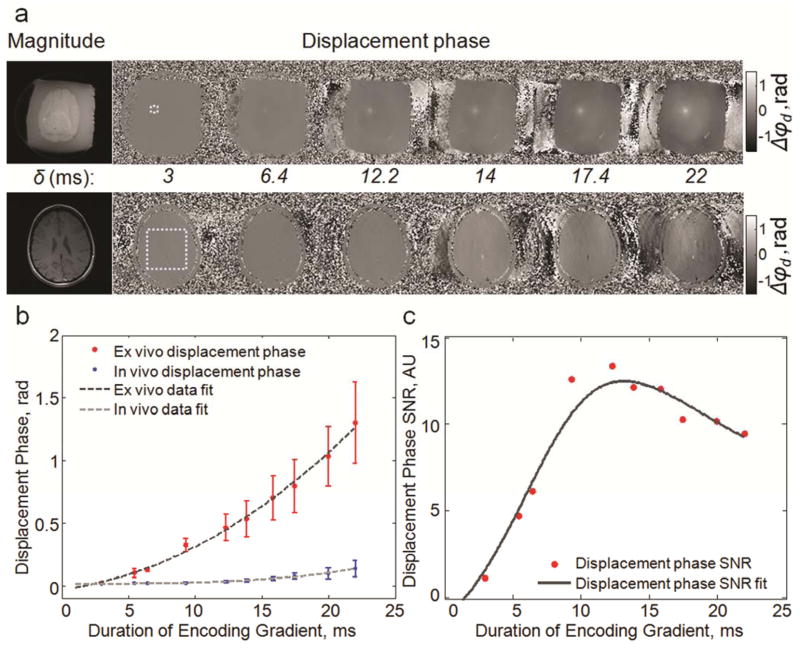
The effect of duration of the repeated bipolar encoding gradient on in vivo displacement phase images of brain is shown in Figure 6. The images in Figure 6a show that with increasing encoding duration the displacement at the focal spot increases, however, the level of motion image artifacts due to patient motion increases as well. The mean displacement at the focal spot, obtained in ex vivo tissue, and the standard deviation of displacement phase, calculated in brain images in the ROI shown in Figure 6a, are plotted as a function of gradient duration in Figure 6b. The following polynomial functions were fitted to the data:
Figure 6.
a: Magnitude and displacement phase images for ex vivo (top) and in vivo (bottom) brain obtained using a range of encoding gradient durations. The dotted line shows the regions of interest used to compute displacement signal and noise. b: Plot of ex vivo mean displacement phase, displacement signal, and in vivo displacement phase standard deviation, displacement noise. The data is plotted as mean ± standard deviation calculated from the measurements in five subjects and samples. c: Plot of displacement phase SNR estimated by dividing displacement signal measured ex vivo by displacement noise measured in vivo. In this plot, the fitting curve was found by dividing the fitting curves shown in (b). The optimal duration of encoding gradient is ~12 ms.
The fits had correlation coefficient r equal to 0.99.
The SNR estimates of displacement phase, based on finding a ratio between displacement phase measured ex vivo and standard deviation of displacement phase, noise, measured in vivo, are plotted in Figure 6c. The results of the SNR estimation show that the encoding gradient duration, δ, of approximately 12 ms maximizes the expected in vivo displacement phase SNR.
Measuring tissue response with MR-ARFI. Optimal encoding timing
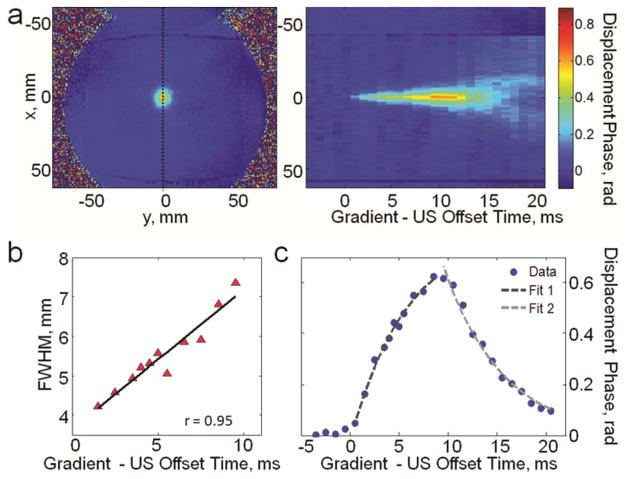
Using the pulse sequence described in Figure 4, the displacement of tissue during the ultrasound pulse emission and several milliseconds before and after was measured. The displacement phase measurements are shown in Figure 7. In Figure 7a the displacement profiles passing through the focal spot, obtained at different ultrasound - encoding - gradient offset times, are stacked together. This image demonstrates the displacement at the focal spot and away from focal spot over time. The FWHM of the displacement at the focal point is plotted in Figure 7b. The mean displacement at the focal spot is plotted as a function of offset time in Figure 7c. Continuous increase of tissue displacement is observed during application of ultrasound pulse. The longer ultrasound is on the wider becomes the focal spot (Figure 7b) due to the propagation of the shear wave away from the focus. Linear regression fitted to the FWHM data in Figure 7b showed that FWHM of the focal displacement increased linearly at the rate of 0.35 m/s.
Figure 7.
a: (Left) Example of displacement phase image obtained using the pulse sequence shown in Fig. 4. The dotted line indicates the position of the displacement profile at the focal spot that was measured at each gradient-ultrasound offset time. (Right) The displacement profiles stacked together to demonstrate the evolution of the tissue displacement in time. b: FWHM of the displacement focal spot: displacement FWHM increases linearly with time with the rate 0.35 m/s. c: Average displacement at the focal spot as a function of the gradient-ultrasound offset time. Tissue response was characterized by finding fits to the displacement data during and after the ultrasound pulse application. τrisewas found to be 5.97 ms and τdecay was 5.94 ms.
To characterize the tissue response exponential functions were fitted to displacement phase data using two intervals: during ultrasound pulse emission rise time constant was found and decay time constant was found after ultrasound emission stopped (Figure 7c). For the ex vivo brain tissue sample studied here the rise time constant was found to be 5.97 ms and the decay time constant was 5.94 ms.
Theoretically-estimated normalized displacement phase and displacement phase SNR as a function of both gradient-ultrasound offset and the delay between the lobes of the motion encoding gradient are shown in Figure 8. The repeated bipolar encoding gradient of duration of 12 ms and tissue response with rise and decay time constants of 5.97 ms and 5.94 ms were used. It was found that for this combination of tissue response and encoding configuration, the displacement phase can be further increased by increasing the delay between the lobes of the encoding gradient to 9 ms and turning the ultrasound pulse on 4 ms before the negative encoding gradient (Figure 8a). While the timing of the ultrasound pulse has no effect on the timing of the MRI pulse sequence, increasing the delay between the gradient lobes causes the increase of echo time and b-value. Therefore displacement phase SNR calculated using displacement phase (Figure 8a) and theoretically-estimated phase noise indicates the maximum is reached at a lower delay time, 3.8 ms, between the motion encoding gradient lobes, corresponding to shorter echo time and lower b-value. (Figure 8b). When displacement phase SNR is calculated using displacement phase (Figure 8a) and phase noise measured in vivo (plotted in Figure 6b), the maximum is reached when the delay between the gradients is zero. The optimum gradient-ultrasound delay is 3.2 ms (Figure 8c).
Figure 8.
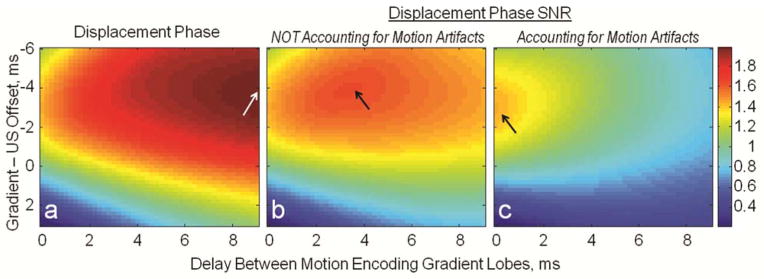
Color maps of normalized displacement phase and phase SNR as a function of ultrasound and gradient timings. a: Displacement phase (theoretically estimated) is maximized when there is a large delay between the motion encoding gradients, 9 ms, and the ultrasound is turned on 4 ms before the negative motion encoding lobe. b: Displacement phase SNR calculated using displacement phase (a) and theoretically estimated phase noise indicates the maximum is reached at lower delay between the motion encoding gradient lobes, corresponding to shorter echo time and lower b-value. c: When displacement phase SNR is calculated using displacement phase (a) and phase noise measured in vivo (plotted in Fig. 6b), the maximum is reached when the delay between the gradients is zero and the optimum gradient ultrasound delay is 3.2 ms.
Modifications in spin-echo MR-ARFI pulse sequence to measure temperature rise
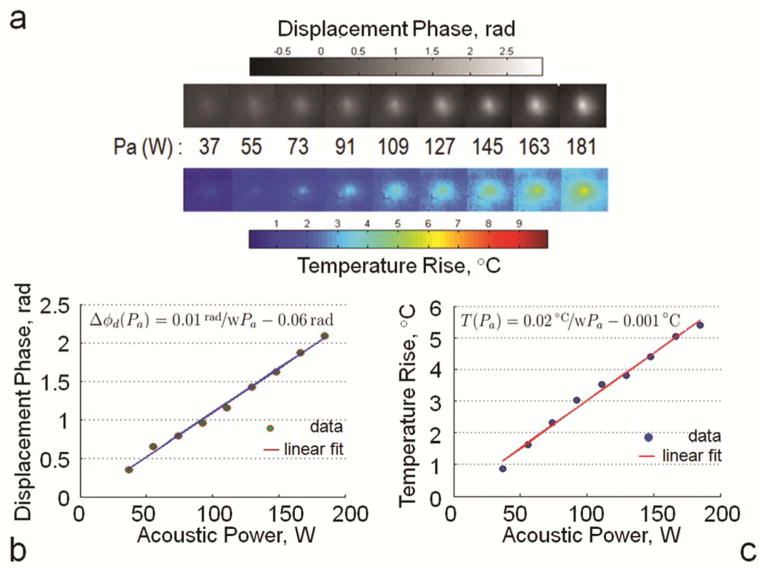
The results of simultaneous measurements of displacement and temperature rise using modified MR-ARFI pulse sequence are shown in Figure 9. Figure 9a shows cropped temperature and displacement maps for each level of acoustic power, and Figure 9b–c show the plots of mean temperature rise and mean displacement calculated in the ROI inside the focal spot. Both temperature and displacement increase linearly with acoustic power.
Figure 9.
a: Cropped temperature rise and displacement phase maps obtained using modified dual echo MR-ARFI pulse sequence (scan time was 140 s) for a range of acoustic power levels. b: Mean displacement phase and c: Mean temperature rise at the focal spot are plotted as a function of acoustic power. Linear fits to the data had r = 0.99.
Discussion and Conclusions
In this work we demonstrated how several parameters can be optimized in order to achieve the highest SNR of MR-ARFI displacement images during in vivo applications in the head. In addition, two modifications of MR-ARFI pulse sequence were developed to allow measurement of tissue response and simultaneous monitoring of displacement and temperature rise.
Firstly, image artifacts due to patient brain motion were shown to be significantly higher if the inverted bipolar encoding configuration was used with spin-echo 2DFT MR-ARFI sequence. Cardiac gating resulted in a significant reduction of the motion artifact only in half of the cases. In addition, the subjects scanned here had heart rates ranging from 40 to 70 beats per minute, which introduced TR and scan time variations. The increased TR slows down the 2DFT pulse sequence, leading to longer procedure times. The decreased TR leads to higher ultrasound duty cycle, given the ultrasound pulse duration is kept constant in each scan. Therefore, the repeated bipolar encoding without cardiac gating was chosen as an optimal sequence configuration. The optimal encoding duration was then determined to be 12 ms for the maximum displacement phase SNR in human brain. This is a shorter duration than 19 ms, which was found optimal for displacement SNR based on instantaneous tissue response assumption and minimizing of T2 and diffusion weighting (15). The previous study used line scan imaging and did not have to account for SNR loss due to patient motion artifacts.
Secondly, we demonstrated that displacement SNR can be further increased by finding an optimal delay of the ultrasound emission in relation to the encoding gradients. To accurately model the effectiveness of the encoding configuration in a particular tissue, it is important to know the exact tissue time constants: the rise and the decay times. Since the tissue response parameters are not known for most tissues (23), a method to measure time response for tissue under investigation was developed here. Bipolar encoding gradients were replaced with short, delta-function-like unipolar gradients and the time between the ultrasound pulse and the gradient was varied in order to sample the tissue displacement before, during and after the ultrasound application. For ex vivo porcine brain sample studied here, the rise and decay time constants were found to be approximately 6 ms, which is of the same order of magnitude as values reported for ex vivo liver and in vivo muscle in (12,19). In this study, the 2DFT spin-echo MR-ARFI was used to measure tissue response, however, this approach to tissue response sampling can be used in other implementations of MR-ARFI, for example, GRE 2DFT MR-ARFI (13) or spin-echo EPI MR-ARFI (17). Knowledge of the tissue response time constants can help optimize the offset time between the ultrasound pulse and the bipolar encoding gradients used in a MR-ARFI sequence. For the 12 ms duration of the repeated bipolar encoding gradients, it was shown that offsetting the ultrasound pulse in relation to the encoding gradient and introducing a delay between the lobes of encoding gradient maximizes displacement SNR in a stationary object. However, in the presence of brain motion, displacement phase SNR does not benefit from increasing the delay between the gradient lobes. It is optimized when the delay is 0 ms and the ultrasound pulse starts 3.2 ms before the negative lobe of the encoding gradient.
While repeated bipolar encoding gradient duration of 12 ms, with ultrasound pulse of approximately 19 ms, has been shown here to optimize the displacement phase SNR, it also would result in a focal spot with FWHM of approximately 15 mm in ex vivo brain tissue. In some MR-ARFI applications, optimization of the FWHM of a focal spot may be an additional objective. For example, in adaptive focusing applications, the displacement measurements are used to infer the intensity of the ultrasound beam. Therefore, the displacement of tissue due to the shear wave propagation would lead to erroneous intensity estimation in locations surrounding the beam focus or foci (33). To avoid the errors due to shear wave displacement obscuring the actual intensity estimation, the duration of the ultrasound pulse and the encoding gradient may be reduced below 12 ms in 2DFT spin-echo MR-ARFI.
Finally, to assure not only high quality, but also safe MR-ARFI acquisition, it was demonstrated that spin-echo MR-ARFI pulse sequence can be easily equipped with temperature monitoring capabilities. Additional gradient-recalled image can be obtained simultaneously with spin-echo image, therefore the temperature rise can be measured together with the displacement. The price of incorporation of the additional readout is an increase in the echo time of the original spin-echo TE by several milliseconds, which in the case presented here corresponded to a 6.6 % decrease in spin-echo image SNR.
In conclusion, to adapt the existing 2DFT spin-echo MR-ARFI pulse sequences for in vivo applications in human brain, the effect of motion artifacts on displacement phase should be minimized by selecting the optimal encoding configuration and duration of the gradient. To increase displacement phase SNR further, tissue response can be measured and used to calculate the optimal timing of the ultrasound pulse emission and the encoding gradient. The total acquisition time needed for a single displacement measurement, here 140 seconds, can be reduced in the future by introducing partial k-space acquisition or other accelerating techniques. Finally, the deposition of ultrasound energy can be monitored during MR-ARFI acquisition using a dual-echo modification of spin-echo MR-ARFI pulse sequence.
Acknowledgments
This work is supported by NIH RO1 CA121163, R21 EB011559, PO1 CA159992.
References
- 1.Hynynen K, Pomeroy O, Smith DN, Huber PE, McDannold NJ, Kettenbach J, Baum J, Singer S, Jolesz FA. MR Imaging-guided Focused Ultrasound Surgery of Fibroadenomas in the Breast: A Feasibility Study. Radiology. 2001;219(1):176–185. doi: 10.1148/radiology.219.1.r01ap02176. [DOI] [PubMed] [Google Scholar]
- 2.Gianfelice D, Khiat A, Amara M, Belblidia A, Boulanger Y. MR Imaging-guided Focused US Ablation of Breast Cancer: Histopathologic Assessment of Effectiveness-Initial Experience. Radiology. 2003;227(3):849–855. doi: 10.1148/radiol.2281012163. [DOI] [PubMed] [Google Scholar]
- 3.Illing RO, Kennedy JE, Wu F, ter Haar GR, Protheroe AS, Friend PJ, Gleeson FV, Cranston DW, Phillips RR, Middleton MR. The safety and feasibility of extracorporeal high-intensity focused ultrasound (HIFU) for the treatment of liver and kidney tumours in a Western population. 2005;93(8):890–895. doi: 10.1038/sj.bjc.6602803. [DOI] [PMC free article] [PubMed] [Google Scholar]
- 4.McDannold N, Clement GT, Black P, Jolesz F, Hynynen K. Transcranial Magnetic Resonance Imaging-Guided Focused Ultrasound Surgery of Brain Tumors: Initial Findings in 3 Patients. Neurosurgery. 2010;66(2):323–332. doi: 10.1227/01.NEU.0000360379.95800.2F. [DOI] [PMC free article] [PubMed] [Google Scholar]
- 5.Tempany CMC, Stewart EA, McDannold N, Quade BJ, Jolesz FA, Hynynen K. MR Imaging-guided Focused Ultrasound Surgery of Uterine Leiomyomas: A Feasibility Study. Radiology. 2003;226(3):897–905. doi: 10.1148/radiol.2271020395. [DOI] [PubMed] [Google Scholar]
- 6.Catane R, Beck A, Inbar Y, Rabin T, Shabshin N, Hengst S, Pfeffer R, Hanannel A, Dogadkin O, Liberman B, Kopelman D. MR-guided focused ultrasound surgery (MRgFUS) for the palliation of pain in patients with bone metastases - preliminary clinical experience. Annals of Oncology. 2007;18(1):163–167. doi: 10.1093/annonc/mdl335. [DOI] [PubMed] [Google Scholar]
- 7.Martin E, Jeanmonod D, Morel A, Zadicario E, Werner B. High-intensity focused ultrasound for noninvasive functional neurosurgery. Annals of Neurology. 2009;66(6):858–861. doi: 10.1002/ana.21801. [DOI] [PubMed] [Google Scholar]
- 8.McDannold N, Fossheim SL, Rasmussen H, Martin H, Vykhodtseva N, Hynynen K. Heat-activated Liposomal MR Contrast Agent: Initial in Vivo Results in Rabbit Liver and Kidney. Radiology. 2004;230(3):743–752. doi: 10.1148/radiol.2303021713. [DOI] [PubMed] [Google Scholar]
- 9.Ishihara Y, Calderon A, Watanabe H, Okamoto K, Suzuki Y, Kuroda K, Suzuki Y. A precise and fast temperature mapping using water proton chemical shift. Magnetic Resonance in Medicine. 1995;34(6):814–823. doi: 10.1002/mrm.1910340606. [DOI] [PubMed] [Google Scholar]
- 10.McDannold N, Maier SE. Magnetic resonance acoustic radiation force imaging. Medical Physics. 2008;35(8):3748–3758. doi: 10.1118/1.2956712. [DOI] [PMC free article] [PubMed] [Google Scholar]
- 11.Radicke M, Engelbertz A, Habenstein B, Lewerenz M, Oehms O, Trautner P, Weber B, Wrede S, Maier K. Hyperfine Interactions. Vol. 181. Springer Netherlands; 2008. New image contrast method in magnetic resonance imaging via ultrasound; pp. 21–26. [Google Scholar]
- 12.Huang Y, Curiel L, Kukic A, Plewes DB, Chopra R, Hynynen K. MR acoustic radiation force imaging: In vivo comparison to ultrasound motion tracking. Medical Physics. 2009;36(6):2016–2020. doi: 10.1118/1.3120289. [DOI] [PMC free article] [PubMed] [Google Scholar]
- 13.Viallon M, Hyacinthe J, Goget T, Baboi L, Gross P, Becker C, Salomir R. Simultaneous Acoustic Radiation Force Imaging and PRFS Thermal Monitoring at 3T for MRgHIFU focusing. Stockholm: 2010. p. 1804. [Google Scholar]
- 14.Hertzberg Y, Volovick A, Zur Y, Medan Y, Vitek S, Navon G. Ultrasound focusing using magnetic resonance acoustic radiation force imaging: Application to ultrasound transcranial therapy. Medical Physics. 2010;37(6):2934–2942. doi: 10.1118/1.3395553. [DOI] [PubMed] [Google Scholar]
- 15.Chen J, Watkins R, Pauly KB. Optimization of encoding gradients for MR-ARFI. Magnetic Resonance in Medicine. 2010;63(4):1050–1058. doi: 10.1002/mrm.22299. [DOI] [PMC free article] [PubMed] [Google Scholar]
- 16.Larrat B, Pernot M, Aubry J-F, Dervishi E, Sinkus R, Seilhean D, Marie Y, Boch A-L, Fink M, Tanter M. MR-guided transcranial brain HIFU in small animal models. Physics in Medicine and Biology. 2010;2:365. doi: 10.1088/0031-9155/55/2/003. [DOI] [PMC free article] [PubMed] [Google Scholar]
- 17.Kaye EA, Chen J, Pauly KB. Rapid MR-ARFI method for focal spot localization during focused ultrasound therapy. Magnetic Resonance in Medicine. 2011;65(3):738–743. doi: 10.1002/mrm.22662. [DOI] [PMC free article] [PubMed] [Google Scholar]
- 18.Le Bihan D, Breton E, Lallemand D, Aubin ML, Vignaud J, Laval-Jeantet M. Separation of diffusion and perfusion in intravoxel incoherent motion MR imaging. Radiology. 1988;168 (2):497–505. doi: 10.1148/radiology.168.2.3393671. [DOI] [PubMed] [Google Scholar]
- 19.Nightingale KR, Palmeri ML, Nightingale RW, Trahey GE. On the feasibility of remote palpation using acoustic radiation force. The Journal of the Acoustical Society of America. 2001;110(1):625–634. doi: 10.1121/1.1378344. [DOI] [PubMed] [Google Scholar]
- 20.Trahey GE, Palmeri ML, Bentley RC, Nightingale KR. Acoustic radiation force impulse imaging of the mechanical properties of arteries: In vivo and ex vivo results. Ultrasound in Medicine & Biology. 2004;30(9):1163–1171. doi: 10.1016/j.ultrasmedbio.2004.07.022. [DOI] [PubMed] [Google Scholar]
- 21.Sarvazyan AP, Rudenko OV, Swanson SD, Fowlkes JB, Emelianov SY. Shear wave elasticity imaging: a new ultrasonic technology of medical diagnostics. Ultrasound in Medicine & Biology. 1998;24(9):1419–1435. doi: 10.1016/s0301-5629(98)00110-0. [DOI] [PubMed] [Google Scholar]
- 22.Barannik EA, Girnyk SA, Tovstiak VV, Marusenko AI, Volokhov VA, Sarvazyan AP, Emelianov SY. The influence of viscosity on the shear strain remotely induced by focused ultrasound in viscoelastic media. The Journal of the Acoustical Society of America. 2004;115(5):2358–2364. doi: 10.1121/1.1698796. [DOI] [PubMed] [Google Scholar]
- 23.Souchon R, Salomir R, Beuf O, Milot L, Grenier D, Lyonnet D, Chapelon J-Y, Rouvière O. Transient MR elastography (t-MRE) using ultrasound radiation force: Theory, safety, and initial experiments in vitro. Magnetic Resonance in Medicine. 2008;60(4):871–881. doi: 10.1002/mrm.21718. [DOI] [PubMed] [Google Scholar]
- 24.Bercoff J, Muller M, Tanter M, Fink M. Study of viscous and elastic properties of soft tissues using supersonic shear imaging. 2003 Oct 5–8;921(5):925–928. [Google Scholar]
- 25.Bercoff J, Tanter M, Fink M. Supersonic shear imaging: a new technique for soft tissue elasticity mapping. Ultrasonics, Ferroelectrics and Frequency Control, IEEE Transactions on. 51(4):396–409. doi: 10.1109/tuffc.2004.1295425. [DOI] [PubMed] [Google Scholar]
- 26.Fatemi M, Wold LE, Alizad A, Greenleaf JF. Vibro-acoustic tissue mammography. Medical Imaging, IEEE Transactions on. 21(1):1–8. doi: 10.1109/42.981229. [DOI] [PubMed] [Google Scholar]
- 27.Alizad A, Wold LE, Greenleaf JF, Fatemi M. Imaging mass lesions by vibro-acoustography: modeling and experiments. Medical Imaging, IEEE Transactions on. 23(9):1087–1093. doi: 10.1109/TMI.2004.828674. [DOI] [PubMed] [Google Scholar]
- 28.Fahey BJ, Nightingale KR, Stutz DL, Trahey GE. Acoustic radiation force impulse imaging of thermally- and chemically-induced lesions in soft tissues: preliminary ex vivo results. Ultrasound in Medicine & Biology. 2004;30(3):321–328. doi: 10.1016/j.ultrasmedbio.2003.11.012. [DOI] [PubMed] [Google Scholar]
- 29.Holbrook AB, Ghanouni P, Santos JM, Medan Y, Butts Pauly K. In Vivo MR Acoustic Radiation Force Imaging in the Porcine Liver. Medical Physics. 2011 doi: 10.1118/1.3622610. (Accepted) [DOI] [PMC free article] [PubMed] [Google Scholar]
- 30.Kaye E, Bitton R, Butts Pauly K. Focal Spot Visualization in MRgFUS of the Breast: MR-ARFI vs. T1-weighted FSE. Stockholm: 2010. p. 4123. [Google Scholar]
- 31.Hynynen K, McDannold N, Mulkern RV, Jolesz FA. Temperature monitoring in fat with MRI. Magnetic Resonance in Medicine. 2000;43(6):901–904. doi: 10.1002/1522-2594(200006)43:6<901::aid-mrm18>3.0.co;2-a. [DOI] [PubMed] [Google Scholar]
- 32.Bitton R, Kaye E, Daniel B, Butts Pauly K. MR guided HIFU in cadaver breasts for pre-operative tumor localization of non-palpable breast tumors as an alternative to needle wire tumor localization. Stockholm: 2010. p. 1800. [Google Scholar]
- 33.Larrat B, Pernot M, Montaldo G, Fink M, Tanter M. MR-guided adaptive focusing of ultrasound. IEEE Transactions on Ultrasonics, Ferroelectrics and Frequency Control. 2010;57(8):1734–1747. doi: 10.1109/tuffc.2010.1612. [DOI] [PMC free article] [PubMed] [Google Scholar]


