

Abstract
Introduction
Treatment with clopidogrel, a selective platelet P2Y12 receptor antagonist, reduces risk of recurrent ischemic events in patients with acute coronary syndrome (ACS), by limiting platelet aggregation and activation. Stable whole blood clot formation requires activation of platelets, generation of fibrin and final fibrin crosslinks. In this study we intended to compare plasma and whole blood thrombelastography (TEG) measurements in patients during ACS.
Materials and Methods
Whole blood and plasma samples from 32 patients with nonST segment elevation myocardial infarction (NSTEMI) were collected after administration of clopidogrel. Whole blood and plasma fibrin clot strength (MA) were determined by TEG. Platelet aggregation was determined by light transmittance aggregometry (LTA) using adenosine 5′-diphosphate (ADP), thrombin receptor activation peptide (TRAP), or collagen as agonists. Fibrinogen and C-reactive protein (CRP) concentrations were measured by ELISA.
Results
Heightened plasma fibrin clot strength was associated with increased platelet reactivity stimulated by ADP (ρ=0.536; p=0.002), TRAP (ρ=0.481; p=0.007), and collagen (ρ=0.538; p=0.01). In contrast to plasma fibrin MA, whole blood MA did not correlate with platelet aggregation. Platelet count was the primary contributor to the difference in thrombin induced whole blood MA and plasma fibrin MA. Increasing levels of CRP were associated with increased plasma fibrin clot strength and platelet reactivity.
Conclusions
Our data suggest that inflammation is associated with increased plasma fibrin clot strength and lower platelet inhibition by clopidogrel during ACS. Platelet count is main contributor to additional contractile force of whole blood TEG as compared to plasma TEG during treatment with clopidogrel.
Keywords: CRP, platelet, clopidogrel, thrombelastography, coagulation
Introduction
Clopidogrel is a P2Y12 receptor antagonist and used to prevent recurrent cardiovascular events in patients with acute coronary syndromes (ACS) (1,2). Clopidogrel is biotransformed into its active thiol metabolite and prevents platelet aggregation by interrupting ADP binding to P2Y12 receptor (3,4). Reduced clopidogrel platelet inhibition and high residual platelet reactivity has been associated with increased risk for recurrent thrombotic events in patients treated with coronary stenting after ACS (5).
In addition to fibrin polymerization, whole blood clot formation is accompanied by activation of platelets, resulting in platelet-fibrin aggregation and further stabilization of platelet-fibrin network by fibrin crosslinks. Intact platelet function is important in maintenance of hemostasis as indicated by bleeding due to inappropriate platelet function (6). On the opposite, unopposed platelet activity increases risk of thrombosis in subjects with coronary atherosclerosis (7). Several agonists can activate platelets, e.g., ADP, thrombin and collagen, representing different pathways of platelet activation. Activated platelets release inflammatory molecules, such as thromboxane, and procoagulant molecules, such as factor V and factor XIII (8). Thus administration of antiplatelet reagents not only inhibits platelet activation, but may also reduce plasma hypercoagulability. So far, there is no direct evidence that platelet reactivity is related to plasma coagulation in a platelet independent fashion. However, inhibition of platelet activation by clopidogrel may affect plasma fibrin clot strength in addition to platelet inhibition. We have previously demonstrated that inflammation measured by C-reactive protein in patients with stable coronary artery disease is associated with heightened plasma fibrin clot strength (9). We hypothesized that in patients with acute coronary syndromes high fibrin clot strength was predominant contributor to thrombin induced whole blood clot strength, a measure previously shown to be associated with increased rate of adverse ischemic events. In our study, clot strengths from plasma and whole blood were measured by TEG separately and then correlated with platelet aggregation induced by different agonists.
Materials and Methods
Patients
The study protocol was approved by the Indiana University Institutional Review Board for Research. Informed consent was obtained from all the individuals. Subjects with non-ST elevation myocardial infarction (NSTEMI) according to the universal definition of myocardial infarction (10) and current treatment with clopidogrel (either maintenance dose clopidogrel 75mg daily for at least 5 days or administration of 600mg clopidogrel loading dose at least 4 hours prior to first blood draw) were included. All patients were treated with aspirin 325mg daily. Exclusion criteria included age > 75 years of age, body weight < 60kg, and platelet counts less than 100,000/mm3.
Blood Samples
Venous blood samples were collected at least 4 hours after 600mg loading dose of clopidogrel or after at least 5 days of clopidogrel 75 mg daily maintenance dosing. Blood samples were collected in vacutainer tubes containing 3.2% sodium citrate. Platelet rich plasma (PRP) was obtained by centrifugation at 120×g for 5 min. Platelet-poor plasma (PPP) was obtained by centrifugation at 2000× g for 15 min and stored in -80°C until analysis.
Thromboelastography
Thromboelastography was performed by using citrated whole blood or stored citrate plasma according to the manufacture's instruction (Haemoscope, USA). Whole blood or plasma (1 mL) was mixed with kaolin, inverted five times and loaded in a TEG cup containing 20 μl of CaCl2. Thromboelastography was started instantly to record for one hour with maximum clot strength well reached. Time to fibrin formation (R), angle constant (α), clot formation time (K), maximum amplitude (MA) were recorded. Maximum clot strength (G) was calculated by following formula: G = (5000*MA)/(100-MA) [dyn/cm2].
Platelet aggregation studies
Ex vivo platelet function was assessed by light transmittance aggregometry (LTA) at 37°C with an Optical Lumi-Aggregometer (Model 700 with AggroLink 8 software, Chrono-Log Corporation, Havertown, PA, USA). Platelet rich plasma (PRP) and platelet poor plasma (PPP) were obtained by differential centrifugation of citrate blood as previously described (11). Platelet aggregation in PRP was induced with ADP at 5, 10 and 20 μM, with TRAP at 15 and 25 μM, and with collagen at 1 μg/mL, respectively.
Fibrinogen and C-reactive protein
Both plasma fibrinogen and C-reactive protein were measured by commercially available ELISA as previously described (9).
Statistical Analysis
Statistical significance was defined as p < 0.05. Tests were conducted 2-sided and values are represented as mean ± SD. Categorical variables were compared using the χ2 test. Normal distribution of continuous data was assessed by the Kolmogorov–Smirnov test. Unpaired two-sided Student's t-test was used to compare normally distributed continuous data between two groups and for multiple groups with the one-way analysis of variance test. Spearman's ρ was used to calculate correlation between clot strengths and other continuous variables.
Results
Baseline characteristics of patients are listed in Table 1. A total of 32 patients of NSTEMI, with 15 male patients (46.9%) and 17 females (53.1%) were included in this study. The study population was of mixed racial background with 59.4% white and 31.3% black individuals, respectively. The mean age was 54.4 years and the majority was obese. Preexisting conditions such as diabetes mellitus (59.4%) and hypertension (87.5%) were prevalent.
Table 1. Patient Characteristics.
| Patients (N=32) | |
| Gender (Male %) | 15 (46.9) |
| Race,White/Black/Other, (%) | 19/10/3; (59.4%/31.3%/9.4%) |
| Age (mean±SD), years | 54.4±10.5 |
| Body Mass Index (mean±SD), kg/m2 | 31.7±6.7 |
| Diabetes mellitus (%) | 19 (59.4) |
| Hypertension (%) | 28 (87.5) |
| Prior Coronary Artery Bypass Grafting (%) | 3 (9.4) |
| Previous PCI (%) | 12 (37.5) |
| Congestive Heart Failure (%) | 6 (18.8) |
| Smoking (%) | 15 (46.9) |
| Proton Pump Inhibitor Use (%) | 7 (21.9) |
| Hyperlipidemia (%) | 28 (87.5) |
| Family History of Heart Disease (%) | 17 (53.1) |
Clot strength was measured from samples of plasma and whole blood. In parallel, platelet aggregation in PRP induced by ADP, TRAP and collagen, respectively were also measured by LTA. Table 2 summarizes averages and ranges of platelet aggregation, TEG parameters, and other clinical measurements, including platelet counts, fibrinogen and CRP concentrations. Table 3 demonstrates correlation analysis of TEG clot strength parameters with platelet aggregation, platelet count, fibrinogen and CRP concentrations. Plasma clot strength, represented by both MA and G values was found moderately correlated with maximal platelet aggregation induced by ADP, TRAP, and collagen. In contrast, whole blood clot strength (both MA and G values) only correlated with TRAP (15 μM) induced platelet aggregation. The difference of clot strength (MAdiff and Gdiff) is obtained by subtraction of plasma MA or G from whole blood MA or G. MAdiff and Gdiff thus describes the additional contractile force produced by the partially inhibited platelets in whole blood clot samples that is in excess to fibrin clot formation alone. MAdiff was inversely correlated with ADP and collagen stimulated platelet aggregation, with lower MAdiff observed in subjects with highest residual on treatment platelet aggregation. However, platelet count directly correlated with MA/Gdiff with highest MA/Gdiff values observed in individuals with highest platelet counts.
Table 2. Platelet aggregation, TEG measurements and laboratory parameters.
| Mean ± standard deviation | Range (Minimum-maximum) | |
|---|---|---|
| MPA%, ADP 5 μM | 42.5±18.5 | 5-78 |
| MPA%, ADP 10 μM | 52.9±16.8 | 19-83 |
| MPA%, ADP 20 μM | 60.8±19.3 | 15-96 |
| MPA%, TRAP 15 μM | 81.6±7.6 | 68-94 |
| MPA%, TRAP 25 μM | 81.3±11.6 | 42-105 |
| MPA%, collagen μg/ml | 15.7±17.4 | 0-60 |
| Plasma TEG-R (min) | 7.2±3 | 2.9-15 |
| Plasma TEG-K (min) | 1.7±1.3 | 0.8-7.3 |
| Plasma TEG-MA (mm) | 34.4±8.6 | 15.9-58.3 |
| Plasma TEG-G (dyn/cm2) | 2766.2±1154.7 | 945-6990 |
| Whole blood TEG-R (mm) | 5.7±1.8 | 2.3-9.5 |
| Whole blood TEG-K (min) | 3±8 | 0.9-50.5 |
| Whole blood TEG-MA (mm) | 66.2±5.2 | 49.1-76.7 |
| Whole blood TEG-G (dyn/cm2) | 10153.2±2188.7 | 4823-16459 |
| Platelet count (×10−3/μl) | 230±66 | 120-415 |
| Fibrinogen (mg/ml) | 12.5±5.3 | 3.9-31.7 |
| CRP (mg/l) | 63.2±69 | 1.4-380 |
MPA: maximal platelet aggregation
Table 3.
Correlation analysis of platelet aggregation and clot strength.
| MA Plasma | G Plasma | MA Whole Blood | G Whole Blood | MAdiff (Whole Blood – Plasma) | Gdiff (Whole Blood – Plasma) | |
|---|---|---|---|---|---|---|
| MPA% ADP 5 μM | 0.532** (p=0.002) |
0.532** (p=0.002) |
0.003 (p=0.986) |
0.003 (p=0.986) |
-0.458** (p=0.008) |
-0.195 (p=0.285) |
| MPA% ADP 10 μM | 0.385* (p=0.29) |
0.385* (p=0.029) |
0.006 (p=0.975) |
0.006 (p=0.975) |
-0.269 (p=0.137) |
-0.082 (p=0.655) |
| MPA% ADP 20 μM | 0.533** (p=0.002) |
0.533** (p=0.002) |
0.052 (p=0.786) |
0.052 p=0.376 |
-0.481** p=0.007 |
-0.175 p=0.354 |
| MPA% TRAP 15 μM | 0.550** p=0.002 |
0.550** p=0.002 |
0.498** p=0.005 |
0.498** p=0.005 |
-0.346 p=0.061 |
0.299 p=0.108 |
| MPA% TRAP 25 μM | 0.496** p=0.004 |
0.496** p=0.004 |
0.347 p=0.052 |
0.374 p=0.052 |
-0.419* p=0.017 |
0.084 p=0.649 |
| MPA% Collagen 1 μg/ml | 0.432* p=0.013 |
0.432* p=0.013 |
0.127 p=0.489 |
0.127 p=0.489 |
-0.376* p=0.034 |
-0.062 p=0.735 |
| Platelet count | -0.224 p=0.226 |
-0.224 p=0.226 |
0.269 p=0.143 |
0.269 p=0.143 |
0.347 p=0.056 |
0.390* p=0.030 |
| Fibrinogen | 0.153 p=0.402 |
0.153 p=0.402 |
0.264 p=0.144 |
0.264 p=0.144 |
0.064 p=0.729 |
0.175 p=0.338 |
| CRP | 0.426* p=0.015 |
0.426* p=0.015 |
0.008 p=0.965 |
0.008 p=0.965 |
-0.404* p=0.022 |
-0.404* p=0.022 |
MPA: maximal platelet aggregation;
p < 0.05;
p < 0.01;
Our data indicate that CRP concentration is reasonably well correlated with plasma clot strength, but not with whole blood clot strength. Platelet count and fibrinogen concentration had no correlation to platelet aggregation or clot strength from plasma and whole blood (Tables 3 and 4). In addition, plasma CRP concentration moderately correlated with on treatment ADP- or collagen induced platelet aggregation (Table 4). Figure 1 illustrates the relationship of plasma and whole blood clot strength MA and ADP (5 μM)-induced platelet aggregation. Plasma MA had a positive correlation (ρ=0.532, p=0.002, panel A in Figure 1) with ADP-induced platelet aggregation, signifying lower clopidogrel platelet inhibition in patients with high plasma MA. Whole blood MA had no correlation with ADP-induced platelet aggregation (ρ=0.03, p=0.986, panel B in Figure 1). Noticeably, the range of plasma MA is lower (10 to 60) than that of whole blood MA (50 to 80) because of absence of platelets in plasma. Similarly, plasma MA, but not whole blood MA shows reasonable correlation with CRP concentration (Figure 2).
Table 4.
Correlation analysis of CRP, fibrinogen, platelet count and platelet aggregation.
| MPA% ADP 5 μM | MPA% TRAP 15 μM | MPA% collagen μg/ml | |
|---|---|---|---|
| CRP | 0.428* p=0.014 |
0.172 p=0.364 |
0.478** p=0.006 |
| Fibrinogen | -0.192 p=0.293 |
0.101 p=0.597 |
0.049 p=0.790 |
| Platelet Count | -0.299 p=0.103 |
0.032 p=0.870 |
-0.167 p=0.569 |
MPA: Maximal platelet aggregation
Figure 1.
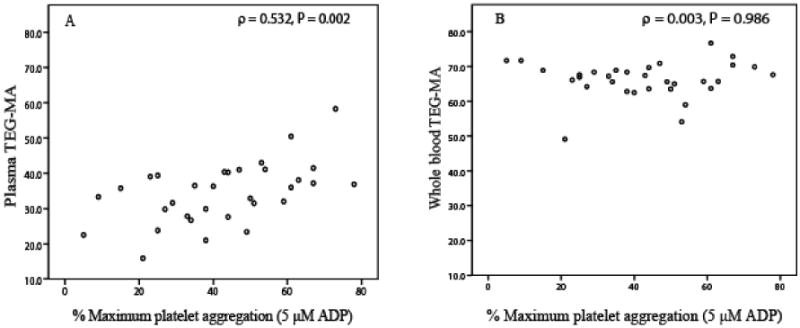
Scatter plot of plasma MA (panel A) and whole blood MA (panel B) versus ADP (5 μM) induced platelet aggregation.
Figure 2.
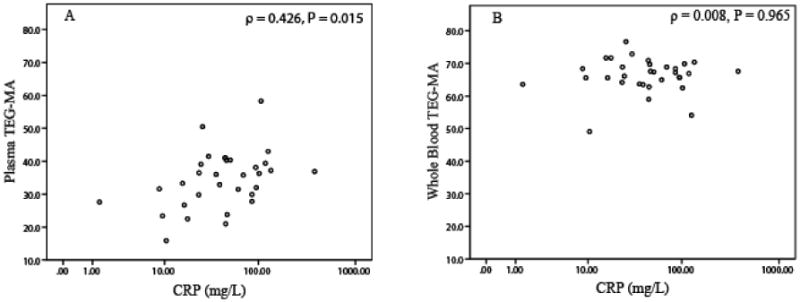
Scatter plot of plasma MA (panel A) and whole blood MA (panel B) versus CRP concentration.
The relationship between platelet aggregation and CRP concentration was agonist-specific (Figure 3). ADP- and collagen-induced platelet aggregation positively correlated with CRP concentration (Figure 3, panel A and B). In contrast, TRAP-induced platelet aggregation showed no correlation with CRP concentration (Figure 3, panel C). Smokers had marginally higher plasma clot strength as compared to nonsmokers (MA: 37.1±9 vs. 32.0±7; p=0.09), but not whole blood clot strength (MA: 65.5±7 vs. 67±4; p=0.4). There was no significant difference in the strength of correlation between plasma clot strength and platelet aggregation induced by 5 μM ADP when analyzed separately in smokers and non-smokers (ρ=0.75; p=0.001 and ρ =0.72; p=0.001).
Figure 3.
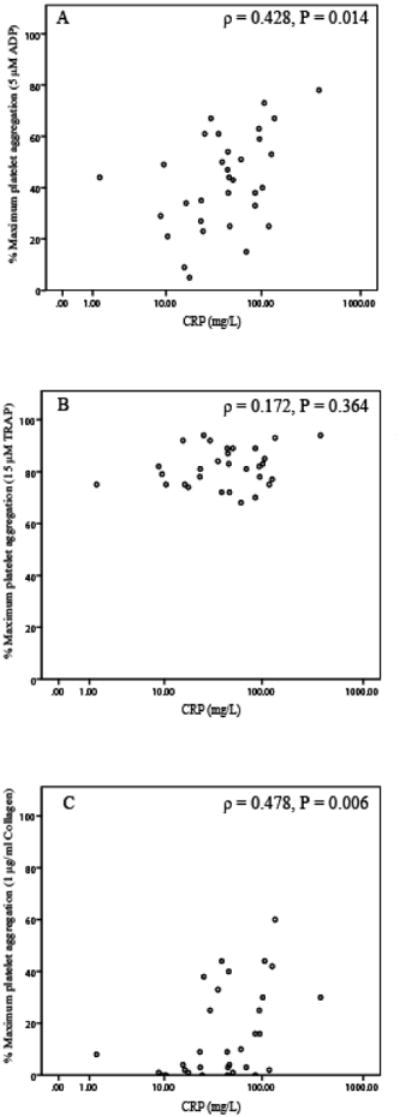
Scatter plot of platelet aggregation induced by ADP (5 μM) (panel A), TRAP (15 μM) (panel B), and collagen (1 μg/ml) (panel C) and CRP concentrations.
Discussion
Inflammation is a central process in atherosclerosis development (12). CRP, a systemic marker of inflammation, is considered a risk factor for the occurrence of cardiovascular events (13). CRP level has been reported to link both higher platelet reactivity and fibrin clot strength (13,14). Thus, the systemic effects of inflammation may extend beyond the more direct effects on atherosclerotic plaque generation and cellular processes of inflammation. Our current study suggests that elevated CRP may correlate both with increased plasma fibrin clot strength and higher platelet reactivity in patients with NSTEMI treated with dual antiplatelet therapy.
Clopidogrel resistance is reflected by higher on-treatment platelet aggregation and has been associated with increased risk for recurrent thrombotic events, and in particular coronary stent thrombosis. Several studies have previously documented that whole blood clot strength measured by TEG is not sensitive to platelet activity and a specific platelet mapping assay has been developed for TEG platform to specifically measure residual P2Y12 mediated platelet effects by preventing thrombin formation in whole blood (15,16). Increased thrombin mediated whole blood MA has been previously shown to be associated with increased incidence of ischemic cardiovascular events, and we thus intended to examine the relationship of this variable with plasma fibrin MA and platelet aggregation (17-21). We could not demonstrate a significant correlation between on treatment platelet aggregation and whole blood clot strength, suggesting that the adverse prognostic risk associated with elevated thrombin whole blood MA in prior studies may not be primarily due to variability in P2Y12 inhibition. Instead, we observed that plasma clot strength correlated with platelet reactivity, and in particular ADP induced platelet aggregation. In our study, fibrinogen concentration was not the primary determinant of plasma or whole blood clot strength, and thus other mechanisms must be involved, leading to variations in plasma clot strength among patients with NSTEMI. Factor XIII, a protease at the end of coagulation cascade, crosslinks fibrin by its transglutaminase activity and variations in its concentration significantly alter maximum plasma clot strength (MA,G) as well as clot formation time (K) (22,23). Factor XIII exists as two forms, plasma circulated and platelet bound. Platelet bound factor XIII was suggested to be a marker of platelet activation in peripheral vascular disease (24,25). Thus, it is plausible that more platelet associated factor XIII may be released into plasma in individuals with higher platelet reactivity during ACS. This may in part explain the correlation of plasma clot strength and platelet reactivity. However, the activity-response relationship of FXIII activity and elastic modulus far beyond 100% normal FXIII activity is not known.
Alternatively, carbon monoxide mediated changes in coagulation induced by smoking could contribute to our findings (26-30). It has been demonstrated that tobacco smoking enhances plasma clot strength measured by TEG (31). In a population-based cohort study, cardiovascular events were associated with elevated levels of carbon monoxide in never smoke subjects, suggesting that carbon monoxide level could be a specific risk factor for cardiovascular disease (32). Also, elevated levels of carboxyhemoglobin was associated with increased cardiovascular events and increased infarct size in patients admitted with acute myocardial infarction (33). In our study, we observed that smokers had marginally higher clot strength in plasma but not whole blood as compared to non-smokers, which is consistent with findings previously described by Nielsen et al. (31). We observed that in both smoker and nonsmoker groups, plasma clot strength correlated with maximum platelet aggregation induced by ADP. Thus, our data suggest that reduced P2Y12 platelet inhibition by clopidogrel is associated with increased plasma clot strength regardless of smoking status.
As previously shown in subjects with stable coronary artery disease undergoing PCI, CRP levels also correlated with plasma fibrin clot strength in patients with NSTEMI in our study (9).
In summary, our data suggest that inflammation during or preceding a NSTEMI as measured by elevated CRP may be associated with relative hypercoagulability of plasma and increased platelet reactivity. Further studies are necessary to confirm these findings and risk associated with increased plasma fibrin clot strength in patients with acute coronary syndromes.
Acknowledgments
This study was supported in part by the Indiana Clinical and Translational Sciences Institute funded, in part by Grant Number (RR025761) from the National Institutes of Health, National Center for Research Resources, Clinical and Translational Sciences Award; the Indiana University Health Value Grant; internal funding from the Department of Medicine, Indiana University School of Medicine; the IU Health Strategic Cardiovascular Research Initiative; and NIH grant T32GM008425.
Abbreviations
- CRP
C-reactive protein
- NSTEMI
non-ST segment elevation myocardial infarction
- LTA
light transmittance aggregometry
- ADP
adenosine 5′-diphosphate
- TRAP
thrombin receptor activation peptide
- ACS
acute coronary syndrome
- PPP
platelet poor plasma
- PRP
platelet rich plasma
- R
time to fibrin formation
- α
angle constant
- K
clot formation time
- MA
maximum amplitude
- G
maximum clot strength
- diff
difference
Footnotes
Publisher's Disclaimer: This is a PDF file of an unedited manuscript that has been accepted for publication. As a service to our customers we are providing this early version of the manuscript. The manuscript will undergo copyediting, typesetting, and review of the resulting proof before it is published in its final citable form. Please note that during the production process errors may be discovered which could affect the content, and all legal disclaimers that apply to the journal pertain.
References
- 1.Effects of Clopidogrel in Addition to Aspirin in Patients with Acute Coronary Syndromes without ST-Segment Elevation. N Engl J Med. 2001;345(7):494–502. doi: 10.1056/NEJMoa010746. [DOI] [PubMed] [Google Scholar]
- 2.Effects of Clopidogrel in Addition to Aspirin in Patients with Acute Coronary Syndromes without ST-Segment Elevation. N Engl J Med. 2001;345(20):1506. doi: 10.1056/NEJMoa010746. [DOI] [PubMed] [Google Scholar]
- 3.Savi P, Zachayus JL, Delesque-Touchard N, Labouret C, Hervé C, Uzabiaga MF, et al. The active metabolite of cClopidogrel disrupts P2Y12 receptor oligomers and partitions them out of lipid rafts. Proc Natl Acad Sci U S A. 2006;103(29):11069–74. doi: 10.1073/pnas.0510446103. [DOI] [PMC free article] [PubMed] [Google Scholar]
- 4.Pereillo JM, Maftouh M, Andrieu A, Uzabiaga MF, Fedeli O, Savi P, et al. Structure and Stereochemistry of the Active Metabolite of C(1)lopidogrel. Drug Metab Dispos. 2002;30(11):1288–95. doi: 10.1124/dmd.30.11.1288. [DOI] [PubMed] [Google Scholar]
- 5.Breet NJ, van Werkum JW, Bouman HJ, Kelder JC, Ruven HJ, Bal ET, Deneer VH, Harmsze AM, van der Heyden JA, Rensing BJ, Suttorp MJ, Hackeng CM, ten Berg JM. Comparison of Platelet Function Tests in Predicting Clinical Outcome in Patients Undergoing Coronary Stent Implantation. JAMA. 2010;303:754–62. doi: 10.1001/jama.2010.181. [DOI] [PubMed] [Google Scholar]
- 6.Kannan M, Saxena R. Glanzmann's Thrombasthenia: An Overview. Clin Appl Thromb Hemost. 2009;15(2):152–65. doi: 10.1177/1076029608326165. [DOI] [PubMed] [Google Scholar]
- 7.Schafer AI. Thrombocytosis. N Engl JMed. 2004;350(12):1211–9. doi: 10.1056/NEJMra035363. [DOI] [PubMed] [Google Scholar]
- 8.Camire RM, Pollak ES, Kaushansky K, Tracy PB. Secretable Human Platelet-Derived Factor V Originates From the Plasma Pool. Blood. 1998;92(9):3035–41. [PubMed] [Google Scholar]
- 9.Kreutz R, Owens J, Breall J, Lu D, von der Lohe E, Bolad I, et al. C-reactive protein and fibrin clot strength measured by thrombelastoghraphy after coronary stenting. Blood Coagul Fibrinolysis. 2013;24(3):321–6. doi: 10.1097/MBC.0b013e32835cc193. [DOI] [PMC free article] [PubMed] [Google Scholar]
- 10.Thygesen K, Alpert JS, White HD. Joint ESC/ACCF/AHA/WHF Task Force for the Redefinition of Myocardial Infarction. Universal definition of myocardial infarction. Circulation. 2007;116(22):2634–53. doi: 10.1161/CIRCULATIONAHA.107.187397. [DOI] [PubMed] [Google Scholar]
- 11.Kreutz RP, Breall JA, Kreutz Y, Owens J, Lu D, Bolad I, et al. Protease activated receptor-1 (PAR-1) mediated platelet aggregation is dependent on clopidogrel response. Thromb Res. 2012;130(2):198–202. doi: 10.1016/j.thromres.2012.02.049. [DOI] [PMC free article] [PubMed] [Google Scholar]
- 12.Libby P. Inflammation in Atherosclerosis. Arterioscler Thromb. 2012;32(9):2045–51. doi: 10.1161/ATVBAHA.108.179705. [DOI] [PMC free article] [PubMed] [Google Scholar]
- 13.C-Reactive Protein, Fibrinogen, and Cardiovascular Disease Prediction. N Engl J Med. 2012;367(14):1310–20. doi: 10.1056/NEJMoa1107477. [DOI] [PMC free article] [PubMed] [Google Scholar]
- 14.Li R, Ren M, Luo M, Chen N, Zhang Z, Luo B, et al. Monomeric C-reactive protein alters fibrin clot properties on endothelial cells. Thromb Res. 2012;129(5):e251–e6. doi: 10.1016/j.thromres.2012.03.014. [DOI] [PubMed] [Google Scholar]
- 15.Bowbrick VA, Mikhailidis DP, Stansby G. Value of Thromboelastography in the Assessment of Platelet Function. Clin Appl Thromb Hemost. 2003;9(2):137–42. doi: 10.1177/107602960300900208. [DOI] [PubMed] [Google Scholar]
- 16.Bailey LA, Sistino JJ, Uber WE. Is platelet function as measured by Thrombelastograph monitoring in whole blood affected by platelet inhibitors? J Extra Corpor Technol. 2005;37(1):43–7. [PubMed] [Google Scholar]
- 17.Gurbel PA, Bliden KP, Guyer K, Cho PW, Zaman KA, Kreutz RP, Bassi AK, Tantry US. Platelet Reactivity in Patients and Recurrent Events Post-Stenting: Results of the PREPARE POST-STENTING Study. J Am Coll Cardiol. 2005;46(10):1820–1826. doi: 10.1016/j.jacc.2005.07.041. [DOI] [PubMed] [Google Scholar]
- 18.Gurbel PA, Bliden KP, Navickas IA, Mahla E, Dichiara J, Suarez TA, Antonino MJ, Tantry US, Cohen E. Adenosine diphosphate-induced platelet-fibrin clot strength: a new thrombelastographic indicator of long-term poststenting ischemic events. Am Heart J. 2010;160(2):346–54. doi: 10.1016/j.ahj.2010.05.034. [DOI] [PMC free article] [PubMed] [Google Scholar]
- 19.Rafiq S, Johansson PI, Ostrowski SR, Stissing T, Steinbrüchel DA. Hypercoagulability in patients undergoing coronary artery bypass grafting: prevalence, patient characteristics and postoperative outcome. Eur J Cardiothorac Surg. 2012;41(3):550–5. doi: 10.1093/ejcts/ezr001. [DOI] [PubMed] [Google Scholar]
- 20.McCrath DJ, Cerboni E, Frumento RJ, Hirsh AL, Bennett-Guerrero E. Thromboelastography maximum amplitude predicts postoperative thrombotic complications including myocardial infarction. Anesth Analg. 2005;100(6):1576–83. doi: 10.1213/01.ANE.0000155290.86795.12. [DOI] [PubMed] [Google Scholar]
- 21.Tantry US, Bliden KP, Suarez TA, Kreutz RP, Dichiara J, Gurbel PA. Hypercoagulability, platelet function, inflammation and coronary artery disease acuity: results of the Thrombotic RIsk Progression (TRIP) study. Platelets. 2010;21(5):360–7. doi: 10.3109/09537100903548903. [DOI] [PubMed] [Google Scholar]
- 22.Nielsen VG, Gurley WQ, Jr, Burch TM. The impact of factor XIII on coagulation kinetics and clot strength determined by thrombelastography. Anesth Analg. 2004;99(1):120–3. doi: 10.1213/01.ANE.0000123012.24871.62. [DOI] [PubMed] [Google Scholar]
- 23.Schroeder V, Chatterjee T, Kohler HP. Influence of blood coagulation factor XIII and FXIII Val34Leu on plasma clot formation measured by thrombelastography. Thromb Res. 2001;104(6):467–74. doi: 10.1016/s0049-3848(01)00395-4. [DOI] [PubMed] [Google Scholar]
- 24.McDonagh J, McDonagh RP, Delâge JM, Wagner RH. Factor XIII in human plasma and platelets. J Clin Invest. 1969;48(5):940–6. doi: 10.1172/JCI106053. [DOI] [PMC free article] [PubMed] [Google Scholar]
- 25.Devine DV, Andestad G, Nugent D, Carter CJ. Platelet-associated factor XIII as a marker of platelet activation in patients with peripheral vascular disease. Arterioscler Thromb. 1993;13(6):857–62. doi: 10.1161/01.atv.13.6.857. [DOI] [PubMed] [Google Scholar]
- 26.Nielsen VG, Cohen JB, Malayaman SN, Nowak M, Vosseller K. Fibrinogen is a heme-associated, carbon monoxide sensing molecule: a preliminary report. Blood Coagul Fibrinolysis. 2011;22(5):443–7. doi: 10.1097/MBC.0b013e328345c069. [DOI] [PubMed] [Google Scholar]
- 27.Nielsen VG, Arkebauer MR, Wasko KA, Malayaman SN, Vosseller K. Carbon monoxide-releasing molecule-2 decreases fibrinolysis in vitro and in vivo in the rabbit. Blood Coagul Fibrinolysis. 2012;23(1):104–7. doi: 10.1097/MBC.0b013e32834ea012. [DOI] [PubMed] [Google Scholar]
- 28.Nielsen VG, Arkebauer MR, Vosseller K. Redox-based thrombelastographic method to detect carboxyhemefibrinogen-mediated hypercoagulability. Blood Coagul Fibrinolysis. 2011;22(8):657–61. doi: 10.1097/MBC.0b013e32834aa7b0. [DOI] [PubMed] [Google Scholar]
- 29.Machovec KA, Ushakumari DS, Welsby IJ, Nielsen VG. The procoagulant properties of purified fibrinogen concentrate are enhanced by carbon monoxide releasing molecule-2. Thromb Res. 2012;129(6):793–6. doi: 10.1016/j.thromres.2011.08.005. [DOI] [PubMed] [Google Scholar]
- 30.Smith MC, Nielsen VG. Detection of carboxyhemefibrinogen and methemefibrinogen in a patient with thrombosis of a HeartMate II ventricular assist device. ASAIO J. 2013;59(1):93–5. doi: 10.1097/MAT.0b013e31827986e6. [DOI] [PubMed] [Google Scholar]
- 31.Nielsen VG, Hafner DT, Steinbrenner EB. Tobacco smoke-induced hypercoagulation in human plasma: role of carbon monoxide. Blood Coagul Fibrinolysis. 2013;24(4):405–10. doi: 10.1097/MBC.0b013e32835d5458. [DOI] [PubMed] [Google Scholar]
- 32.Hedblad B, Engström G, Janzon E, Berglund G, Janzon L. COHb% as a marker of cardiovascular risk in never smokers: results from a population-based cohort study. Scand J Public Health. 2006;34(6):609–15. doi: 10.1080/14034940600590523. [DOI] [PubMed] [Google Scholar]
- 33.Elsasser S, Mall T, Grossenbacher M, Zuber M, Perruchoud AP, Ritz R. Influence of carbon monoxide (CO) on the early course of acute myocardial infarction. Intensive Care Med. 1995;21(9):716–22. doi: 10.1007/BF01704738. [DOI] [PubMed] [Google Scholar]