

Abstract
Object
Tumors at the skull base are challenging for both resection and radiosurgery given the presence of critical adjacent structures, such as cranial nerves, blood vessels, and brainstem. Magnetic resonance imaging–guided thermal ablation via laser or other methods has been evaluated as a minimally invasive alternative to these techniques in the brain. Focused ultrasound (FUS) offers a noninvasive method of thermal ablation; however, skull heating limits currently available technology to ablation at regions distant from the skull bone. Here, the authors evaluated a method that circumvents this problem by combining the FUS exposures with injected microbubble-based ultrasound contrast agent. These microbubbles concentrate the ultrasound-induced effects on the vasculature, enabling an ablation method that does not cause significant heating of the brain or skull.
Methods
In 29 rats, a 525-kHz FUS transducer was used to ablate tissue structures at the skull base that were centered on or adjacent to the optic tract or chiasm. Low-intensity, low-duty-cycle ultrasound exposures (sonications) were applied for 5 minutes after intravenous injection of an ultrasound contrast agent (Definity, Lantheus Medical Imaging Inc.). Using histological analysis and visual evoked potential (VEP) measurements, the authors determined whether structural or functional damage was induced in the optic tract or chiasm.
Results
Overall, while the sonications produced a well-defined lesion in the gray matter targets, the adjacent tract and chiasm had comparatively little or no damage. No significant changes (p > 0.05) were found in the magnitude or latency of the VEP recordings, either immediately after sonication or at later times up to 4 weeks after sonication, and no delayed effects were evident in the histological features of the optic nerve and retina.
Conclusions
This technique, which selectively targets the intravascular microbubbles, appears to be a promising method of noninvasively producing sharply demarcated lesions in deep brain structures while preserving function in adjacent nerves. Because of low vascularity—and thus a low microbubble concentration—some large white matter tracts appear to have some natural resistance to this type of ablation compared with gray matter. While future work is needed to develop methods of monitoring the procedure and establishing its safety at deep brain targets, the technique does appear to be a potential solution that allows FUS ablation of deep brain targets while sparing adjacent nerve structures.
Keywords: focused ultrasound, ablation, brain, skull base, rat
Despite progress made in many areas, the treatment of brain tumors remains an extraordinary challenge. Given the inherent risks associated with resection and radiotherapy, the aggressiveness of many CNS tumors, and the difficulty in delivering chemotherapy and other drugs to the brain, the prognosis for many types of brain tumors remains grim. This challenge is particularly stark for tumors near critical structures, such as those near the skull base.
Thermal ablation via laser or other methods has been pursued as a less invasive alternative to surgery for tumor therapy in several targets, including the brain.1,27,28 When combined with MRI, one can plan, monitor, and evaluate these minimally invasive procedures.26,41 A potentially noninvasive approach to thermal ablation that has been tested for more than 70 years is focused ultrasound (FUS).3,31,33 In the past decade, MRI-guided FUS thermal ablation systems that enable sonication through the intact skull have been developed.12,22,55 These systems circumvent overheating the skull through active cooling of the scalp and a transducer design with a large aperture to distribute the ultrasound energy over a large skull region. They also correct for skull-induced beam aberrations by using a phased array transducer design and acoustic simulations2,11 and utilizing MR temperature imaging to monitor the heating.23,24,61 These systems have been tested in initial human trials.32,35,37
A current limitation of FUS thermal ablation is that it is restricted to brain targets distant from the bone. If the focal point is placed in peripheral regions, the incidence angle between large portions of the skull bone and ultrasound wavefront becomes more oblique. As this angle increases, less of the ultrasound beam penetrates the skull, and at extreme angles (approximately 25°), the longitudinal portion of beam propagation is totally reflected. As a result, fewer elements in the acoustic array can be effectively used when peripheral regions are targeted, escalating both the peak energy density and heating of the skull. Shear mode conversion also increases at large angles, further intensifying the heating due to the higher absorption coefficient of the shear mode. This limitation was evident in an analysis of MR temperature measurements in the focal region and on the brain surface in the first patient treatments via a transcranial MRI-guided FUS system.37 Placing the focal point near the skull base adds an additional challenge, as the beam in the far field (that is, beyond the focal point) will rapidly heat the bone and perhaps damage nearby brain, nerve, and vascular structures. Large myelinated nerves can be at particular risk because of their lower vascularity and perfusion, which prevent the heat from being drawn away. Nerve function can also be blocked at temperatures below the thermal coagulation threshold.13,30 To target peripheral areas and targets near the skull base with FUS, we need new methods that do not overheat adjacent bone or nerve structures.
To safely sonicate targets near the skull base, a radical decrease in time-averaged acoustic power is necessary. A way to achieve this reduction is to combine FUS with an intravenously injected microbubble-based ultrasound contrast agent (USCA). A number of researchers have shown that the acoustic power required for FUS thermal ablation can be reduced by orders of magnitude with the use of a USCA.9,15,45,56,58,63 With such a reduction, it may be possible to reduce the heat produced in the skull bone to a level below the threshold for thermal damage, and targets directly adjacent to the bone could be ablated.
Previously, we tested this approach for the ablation of brain targets in rabbits.42 We found that the time-averaged power needed to make lesions was reduced by more than 90%. Furthermore, we noted that the bulk temperature rise as measured by MRI was insufficient to produce thermal necrosis, and that the tissue effects observed on histological analysis were inconsistent with prior work evaluating thermal effects.60 Considering these findings, we refer to our method as “nonthermal” ablation. The data suggest that one could use purely mechanical effects to ablate tissue targets in the brain without any significant heating. Since the microbubbles are only present in blood vessels, these mechanical effects are constrained largely to the vasculature.
Without the need to induce heating, one can lower the duty cycle even further, potentially allowing ablation even at regions directly adjacent to the skull. Ablation via this nonthermal approach, in which low-duty-cycle ultra-sound exposures (sonications) are combined with a USCA to create lesions without bulk heating, was recently demonstrated in rats,59 and a similar approach was evaluated in a glioma model.6 Here, we tested whether this ablation method is possible at the skull base without destroying critical nerve structures. In experiments in rats, we targeted brain regions on or adjacent to the optic chiasm or optic tract. The lesions were characterized on MRI and histological analysis, and visual evoked potential (VEP) measurements were used to determine whether ablation caused functional damage.
Methods
Experimental Animals
Lesions were created transcranially in the brains of 29 adult male Wistar rats. Before each procedure, animals were anesthetized with an intraperitoneal injection of a cocktail of ketamine (90 μg/kg) and xylazine (10 μg/kg) administered hourly or as needed. Fur on the head was removed using clippers and depilatory cream, and a catheter was placed in the tail vein. All experiments were done in accordance with procedures approved by the Harvard Medical School Institutional Animal Care and Use Committee. Animals were housed, fed, and watered according to the regulations of the Office of Laboratory Animal Welfare and the Association for Assessment and Accreditation of Laboratory Animal Care.
Magnetic Resonance Imaging–Guided FUS
Burst sonications were applied using a 525-kHz, spherically curved, air-backed transducer (diameter/radius of curvature: 4 cm/3 cm). Transducer efficiency was measured using a radiation force balance consisting of an absorbing brush and digital scale (model XS205, Mettler Toledo). Acoustic pressure distribution was measured with a needle hydrophone (spot diameter 0.2 mm, Precision Acoustics) in the focal plane of the transducer. The acoustic field in water at other depths was estimated using planar projection.10 The diameter and length of 50% isopressure contours of this transducer were measured as 3.5 and 18 mm, respectively. The spatial peak–temporal peak acoustic intensity (ISPTP) was estimated using the acoustic field distribution and acoustic power.17 The spatial peak–temporal peak pressure amplitude (PSPTP) in water was estimated from ISPTP assuming plane waves (that is, assuming ISPTP = PSPTP2/2ρc, using ρ = 998.2 kg/m3 and c = 1498 m/sec). To estimate in vivo exposure levels, loss from the skull, brain, and skin were considered. An insertion loss in pressure amplitude of 25% caused by the rat skull was assumed, based on prior measurements obtained at 532 kHz.40 An additional loss of 4.4%, caused by propagation through approximately 8 mm of brain tissue and 1 mm of skin, was used in our estimates, assuming attenuation coefficients of 5 and 40 Np/m/MHz for brain and skin, respectively.19 Note that the pressure estimates probably contained substantial uncertainty caused by the presence of reflections and standing waves within the intact skull.47 In particular, reflections from the skull base probably resulted in pressure amplitudes higher than our estimates.
Sonications were delivered as bursts with parameters (10-msec bursts applied at 1 Hz for 5 minutes) based on those in a recent study in rats.59 Acoustic power levels of 0.62 and 0.78 W were tested. These levels corresponded to peak negative pressure amplitude estimates of 174 and 195 kPa, respectively, in the brain. Ten seconds prior to each sonication, Definity (Lantheus Medical Imaging Inc.) was intravenously administered via the tail vein as a bolus. Dosages of 10 or 20 μl/kg (1 and 2 times the recommended values for human use) were tested. To facilitate the injection of such a small volume of USCA, the contrast agent was diluted 10:1 in phosphate-buffered saline.
Sonications were performed in a 33-cm-diameter BioSpec 4.7-T MRI scanner (Bruker BioSpin) outfitted with a 12-cm actively shielded gradient set that operates at 20 G/cm. Images were obtained using an elliptical (4 × 5.5 cm) transmit/receive surface coil integrated in a FUS insert constructed in-house for this MRI unit. This insert, which was constructed from a plastic pipe cut lengthwise, contained a small water tank and a platform for the rat to lay supine with its head placed within the opening of the surface coil. The transducer was attached to a manually operated, MRI-compatible 3-axis positioning system that was coupled to the end of the insert and located at the opening of the MRI bore. The transducer sonicated upward through the surface coil into the brain. The experimental setup is shown in Fig. 1. Ultrasound and MRI contrast agents were injected into the tail vein via extension tubing while the animal was within the MRI scanner.
Fig. 1.

A: Experimental setup. B: Photograph of rat with implanted epidural electrodes before a VEP recording session. Placement of the electrodes left the region above the optic chiasm or tract (arrow) intact for sonication. C: Sagittal contrast-enhanced T1-weighted FSE image obtained in a rat with a lesion at the skull base next to the optic tract (circled). There was an artifact in the image in the vicinity of the electrodes (arrow), but it did not affect the sonicated area. Bar = 1 cm.
Imaging Parameters
Magnetic resonance imaging methods and parameters were similar to those described earlier.40 Before the rat sonications, the location of the ultrasound focus was found in the MRI coordinate space by visualizing focal heating in a silicone phantom in a T1-weighted fast spin echo (FSE) image. Then the animal was placed on the FUS system, MRI was performed, and a target for sonication was selected. After sonication, tissue effects were evaluated in multislice 2D T2-weighted FSE images (TR 2000 msec, TE 74 msec, echo train length [ETL] 8, receiver bandwidth ± 24 kHz, slice thickness 1.5 mm, number of averages 2), 3D T2*-weighted spoiled gradient echo images (TR 42.8 msec, TE 16 msec, flip angle 15°, slice thickness 1 mm, number of averages 1), and multislice 2D T1-weighted FSE images (TR 500 msec, TE 18.6 msec, ETL 4, slice thickness 1.5 mm, bandwidth ± 32 kHz, number of averages 2). A 4-cm field of view and a 128 × 128 matrix size were used for all imaging. The T1-weighted images were acquired before and after the administration of an MRI contrast agent (Magnevist, Berlex Laboratories Inc.) at a dose of 0.125 mmol/kg body weight as a bolus injection through the tail vein.
Visual Evoked Potential Measurements
Visual evoked potential measurements are sensitive to deficits in visual capabilities such as spatial resolution and response timing.49,53 They reflect the functional integrity of the visual pathways from the retina via the optic nerves to the visual cortex of the brain. They were used to evaluate the consequences of sonication on or adjacent to the optic chiasm or tract. One to 4 weeks before sonication, MRI-compatible electrodes (Ives EEG Solutions Inc.) were implanted epidurally over the occipital cortex while the animal was under anesthesia. An incision was made in the skin, and 2 bur holes were drilled into the skull 5.6 mm posterior to the bregma and ± 4 mm lateral to the midline.48 Reference electrodes were implanted in the occipital part of the cranium, 10 mm posterior to the bregma and ± 3 mm lateral to the mid-line; the ground electrode was inserted into skin on the neck. Electrodes were inserted using micromanipulators (ASI-Instruments Inc.) and were fixed to the skull with dental cement (RelyX Unicem, 3M ESPE) that was polymerized using a curing light (OptiLux 501, Kerr Corporation). This electrode placement (Fig. 1B) allowed for transcranial sonication near the optic chiasm without interfering with the ultrasound beam or causing distortion in the MRI examination in the area of the optic tract or chiasm (Fig. 1C). Following placement of the electrodes, the skin was sutured, and at least 1 week was allowed for the animals to recover from the surgery.
For VEP acquisition, the animal was anesthetized, and its pupils were dilated using 1.0% tropicamide ophthalmic solution (Alcon Laboratories Inc.); 2.5% hypromellose ophthalmic demulcent solution (Akorn Inc.) was applied to relieve eye dryness and irritation. The animal was placed prone in a dark, electrically shielded box and allowed to adapt to darkness for 5 minutes. Visual stimuli consisted of 20-μsec light flashes generated by a stroboscope (model TSD122A, Biopac Systems Inc.) and repeated at a rate of 0.5 Hz or 1.0 Hz. Visual evoked potential recordings were obtained simultaneously from both eyes and then amplified and filtered between 0.1 and 100 Hz using a bioamplifier (ML138 Octal BioAmp, ADInstruments) and the PowerLab data acquisition system (ML870/P, ADInstruments). For each measurement, recordings from 256 flashes were acquired using Scope (ADInstruments) and were averaged to improve the signal-to-noise ratio. Three measurements were made during each session, with a pause of approximately 5 minutes between measurements.
Histological Analysis
After the last VEP recording session (24 hours–4 weeks after FUS), the animals were deeply anesthetized and killed, and their brains were fixed via transcardial perfusion (250 ml 0.9% NaCl and 500 ml 10% buffered formalin phosphate). The brains were removed, placed in 10% buffered formalin phosphate for immersion fixation, and cut into 2-mm blocks using a rat brain matrix (model RBM-4000DV, ASI-Instruments). Photomacrographs were obtained for both sides of each block, which were then embedded in paraffin and serially sectioned at 5 μm. Slides were stained with H & E for light microscopy evaluation of the resulting lesions. Luxol fast blue (LFB) staining was used to assess myelination. Select sections were stained with Bielschowsky silver to assess any axonal pathology produced by the sonication.
The optic nerve and retina were also evaluated in the animals euthanized 4 weeks after FUS to determine whether delayed effects, such as optic nerve degeneration, occurred. Specifically, we analyzed whether myelination was preserved in axons in the optic nerve and whether retinal ganglion cells remained intact. In these animals, after transcardial perfusion, the entire head was removed and submerged in 10% buffered formalin phosphate for immersion fixation. Then, in addition to the brain, both globes along with the attached optic nerves were carefully removed, embedded in paraffin, and sectioned at 5 μm. The sections were stained with H & E and LFB to assess demyelination and Bielschowsky silver to assess axonal pathology. Other sections were stained with cresyl violet for morphological analysis of the retina.
Experiments and Data Analysis
After baseline VEP measurements were obtained, multislice axial T1- or T2-weighted images were acquired, and the optic nerve, chiasm, and tract were identified in consultation with a rat brain atlas.48 A target for sonication was selected in 1 hemisphere (the other side served as a control). We aimed to place the center of the focal region approximately 1 mm lateral to the optic tract at the point it exited the chiasm. The depth of the focal region was approximately 1 mm from the ventral surface of the brain. Because of uncertainties presumably introduced by deflection of the FUS beam from the skull, the precision of the targeting was approximately ± 1 mm. For this reason, sonications were delivered on or adjacent to the optic tract or chiasm. Magnetic resonance images were acquired post-FUS, and the animal was allowed to recover from anesthesia. Whether the left or right side was targeted was based on the pre-FUS VEP measurement; if one side or the other appeared to have a more robust measurement, that side was sonicated. Otherwise, the sonicated side was randomly selected.
The initial 16 animals were euthanized between 24 hours and 3 weeks after sonication to evaluate the lesions and any effects on the optic tract or optic chiasm at different time points. In these initial 16 animals, VEP measurements were made before sonication and shortly before euthanization. The first 8 animals were sonicated at 195 kPa with a USCA dose of 10 μl/kg. While the sonications were successful in making small lesions, we were concerned that the targeting uncertainty in these experiments was insufficient to ensure that the small lesion was directly adjacent to the optic tract or chiasm. Thus, a larger USCA dose (20 μl/kg) but lower pressure amplitude (174 kPa) was used in the 8 remaining animals to produce a larger lesion. After such lesions were found to be acceptable, an additional 13 animals were sonicated to determine whether the lesions produced any long-term effects on nerve function. Visual evoked potential measurements were acquired in these animals every week for 4 weeks after sonication at 174 kPa and 20 μl/kg USCA. We did not perform sonications without the USCA in a control group because this mode of ablation was established with similar parameters in an earlier study.59 These pressure amplitudes are far below the reported thresholds to produce inertial cavitation in vivo without the microbubbles20,31 and alone are not expected to produce any significant tissue effects.
In each pre- and postsonication session, 3 VEP measurements were acquired. The rat VEP waveform presents positive and negative deflections with components that are commonly designated as P1, N1, P2, N2, P3, and N3.14 The early components are closely related to the retinogeniculate cortical pathway, which is the direct transmission of stimuli from the optic tract to the visual cortex via the lateral geniculate nucleus, whereas the late components are related to the thalamocortical circuit.14,25,44 We analyzed the difference in time (latency) and amplitude for the early VEP components (P1-N1 and N1-P2). The 3 measurements that were obtained during each session were averaged together for this comparison. Postsonication VEP measurements at each time point were compared with the pre-FUS values using a paired t-test; p < 0.05 was considered statistically significant. This comparison was made for both the sonicated and nonsonicated sides.
Results
Appearance of USCA-Enhanced Lesions on MRI and Histological Analysis
Magnetic resonance imaging examination suggested that the USCA-enhanced sonications produced hemorrhagic and/or edematous lesions with blood-brain barrier disruption. The lesions were hypointense on T2*-weighted imaging (Fig. 2A–B), consistent with extravasation of red blood cells. No evidence of bleeding outside the sonicated region was found. The lesions were enhancing on contrast-enhanced T1-weighted imaging (Fig. 2E–F), which suggested that blood flow into the vessels was not stopped at the time of imaging and that vessel damage and/or blood-brain barrier disruption occurred. Finally, the lesions were generally hyperintense on T2-weighted imaging, suggesting the lesions were edematous (Fig. 2C–D). Sonication at 195 kPa with 10 μl/kg Definity produced small MRI-visible lesions (approximately 2 mm in diameter) that extended from the skull base down to approximately half the thickness of the brain or less. The lesions produced by sonication at 174 kPa with 20 μl/kg Definity were larger on MRI (approximately 3–4 mm in diameter) and spanned a large thickness of the brain, with some cases showing effects down to almost the dorsal surface, as in the example featured in Fig. 2.
Fig. 2.
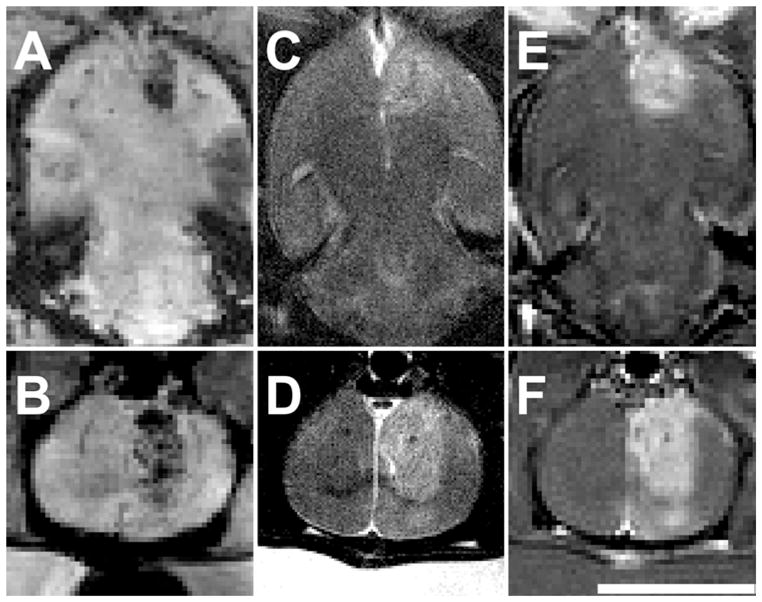
Magnetic resonance images of lesions immediately after sonication at 174 kPa combined with 20 μl/kg USCA. The lesions were somewhat heterogeneous in appearance, but in general were hypointense on T2*-weighted imaging (A–B), hyper-intense on T2-weighted imaging (C–D), and enhancing on T1-weighted FSE imaging after injection of MRI contrast (E–F). This was one of the larger lesions produced, with MRI-evident effects reaching down to the dorsal brain surface. Upper images, axial views; lower images, coronal views. Bar = 1 cm.
Examination of the lesions in tissue blocks showed hemorrhagic lesions adjacent to the optic chiasm or tract (Fig. 3). Histological examination revealed that USCA-enhanced sonications led to microvascular damage throughout the lesion that resulted in ischemic necrosis. Shortly after sonication (24–48 hours), there were multiple microhemorrhages caused by small vessel disruption in the targeted areas, and most cellular elements within the lesions disappeared (Fig. 4). Inflammatory cells were observed infiltrating the necrotic area. By 3–4 weeks after sonication, the damaged tissue was removed, resulting in shrinkage of the targeted tissue and enlargement of the adjacent ventricle (Fig. 5). In some cases a cyst was evident at the sonication target, surrounded by a rim of residual macrophages containing hemosiderin pigment.
Fig. 3.
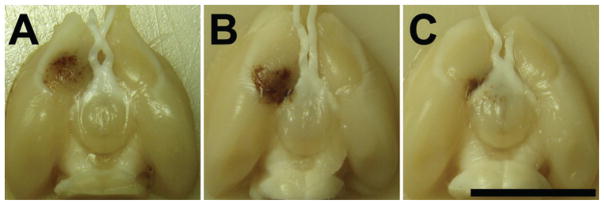
Photographs of formalin-fixed brains showing the lesions produced in 3 rats. A: The edge of the lesion was approximately 1 mm from the optic chiasm. B: The edge of the lesion just touched the optic tract, and some hemorrhage was evident in the space around the tract. C: The lesion was targeted directly on the tract itself. This targeting uncertainty was thought to be due to the effect of the rat skull, which can deflect the ultrasound field depending on the incident angle between the skull surface and the beam. Bar = 1 cm.
Fig. 4.

Photomicrographs of sections stained with H & E (purple) and LFB (blue) showing histological findings 24–48 hours after sonication. Portion of a lesion that overlapped the edge of the optic tract (A–C). The gray matter portion was a necrotic lesion with numerous sites with extravasated erythrocytes. The optic tract itself was largely unaffected. A hemorrhagic region in the optic tract was found on a different section in this example (C). A large lesion in a different animal that directly overlapped the optic tract (OT) at the point where it exited the chiasm (D–F). In a section dorsal to the optic tract, a large continuous necrotic lesion with numerous sites of microhemorrhage was observed in the gray matter (outline, D and E). There was damage to a blood vessel with associated hemorrhage and rarefaction of the fibers in a small area of the optic tract (F). However, only a few peripheral fibers in the descending part of the optic tract appeared damaged (arrow, E) without signs of demyelination. Sections from a different animal showing damage in the chiasm (G–I). Rarefied fibers were found in the edge of the tract (G–H). Markedly rarefied fibers were found at the chiasm edge in a more ventral section (I), with a few that were necrotic and demyelinated (purple fibers). Compared with the gray matter portion of the lesions, damage in the tract was substantially less; myelin preservation (blue) was observed in most fibers. Panels B, E, and H are magnified views of insets in A, D, and G, respectively. Panels C and I are different sections of the brains featured in A and G, respectively. Panel F is a magnified view of the area indicated by the arrow in E.
Fig. 5.

Photomicrographs showing histological features in 3 animals 3–4 weeks after sonication. A–C: In this example, the lesion observed on MRI adjacent to the chiasm was largely resolved at 3 weeks, and fibers in the optic nerves, chiasm, and tract (OT) appeared normal. D–F: In this animal, the lesion developed into a fluid-filled cyst. The optic nerve (ON), chiasm, and adjacent optic tract were unaffected. G–I: Coronal section of a third animal. In this case, macrophages and histiocytes almost completely resorbed the damaged tissues, resulting in shrinkage of the affected area and enlargement of the ventricle. Transverse sections of optic nerves (I) showed no evident abnormalities. Panels B, E, and H are magnified views of insets in A, D, and G, respectively. Panels C, F, and I are views of different sections in the same 3 respective brains. H & E and LFB (A–F); H & E (G–I).
Despite these lesions, which had substantial volume compared with the small rat brain, the adjacent optic tract and chiasm appeared comparatively unaffected, even when the lesion in gray matter was directly adjacent to them. When the lesion included the optic tract or chiasm, some damage was observed at their outer boundaries. However, compared with the gray matter portion of the lesion, which was completely destroyed, damage to the chiasm and tract was substantially less. Some small regions were observed with extravasated erythrocytes (Fig. 4B) or had rarefied fibers (Fig. 4F). However, most fibers were intact. In the most severe cases, some demyelinated and markedly rarefied fibers were observed at the outer boundary (Fig. 4I). In 1 case, a relatively large blood vessel adjacent to the optic tract was damaged, leading to more extensive extravasated erythrocytes in the tract and neighboring brain tissue. Even in this case, however, the fibers appeared mostly intact without evident demyelination.
Examination of the optic nerve and retina 4 weeks after FUS revealed no substantial delayed effects resulting from the sonications. In particular, no evidence for degradation of the myelinated fibers of the optic nerves or infiltration of the macrophages was observed. Axonal size and distribution were normal in both the control and the treated eyes. Examination under higher magnification revealed normal myelinated axons without axonal loss or demyelinated axons. In the retina no evidence of degenerative changes was observed, and the retinal ganglion cell layer appeared normal without apparent cell loss. Example histological findings in the optic nerve and retina are shown in Fig. 6.
Fig. 6.
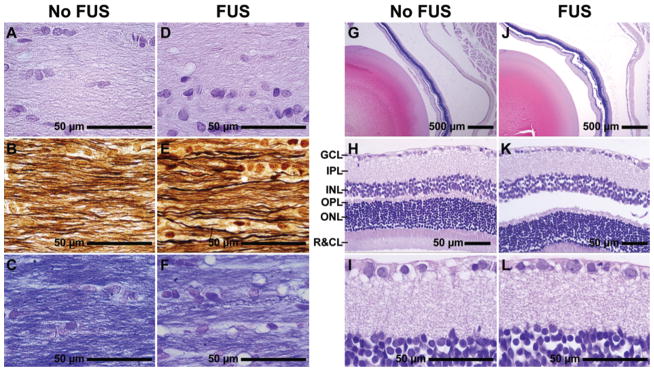
Photomicrographs showing histological features of the optic nerve and retina 4 weeks after sonication. A–F: Longitudinal optic nerve sections stained with H & E (A and D), Bielschowsky silver impregnation (B and E), and LFB (C and F). Optic nerves showed normal axonal size and fiber distribution. No demyelination or axonal loss was observed. G–L: Retinal histological features in sections stained with cresyl violet. No degenerative changes were apparent, and the retinal ganglion cell layer appears normal without any evident cell loss. The apparent separation of the retina from the epithelium, enlarged inter- and intracellular spaces, and lack of cellular detail were observed in both treated (FUS) and control (No FUS) eyes and were presumably artifacts resulting from formalin fixation. GCL = ganglion cell layer; IPL = inner plexiform layer; INL = inner nuclear layer; OPL = outer plexiform layer; ONL = outer nuclear layer; R&CL = photoreceptor layer: rods and cones.
Visual Evoked Potential Measurements
Despite the fact that the lesions were within approximately 1 mm of the optic tract or chiasm or overlapped it, visual function as measured by VEP recording persisted after the sonication and did not appear to be reduced except in 1 animal. Example pre- and post-FUS VEP traces for 4 rats are shown in Fig. 7. While variation from animal to animal was observed, there were no obvious changes in the magnitude or latency of the individual peaks. When all animals were considered, there was no significant (p > 0.05) reduction in the amplitudes of the early VEP components (P1-N1 and N1-P2) compared with presonication tests at every time point evaluated. Neither was there any significant difference (p > 0.05) in the latency measurements. The average differences between pre- and postsonication magnitude and latency measurements for the sonicated and control hemispheres as a function of time are shown in Figs. 8 and 9, respectively. The mean difference at each time point was 0, suggesting that these sonications did not measurably damage visual function on average.
Fig. 7.

Example VEP measurements acquired from 4 animals before and at different times (48 hours–3 weeks) after sonication (174 kPa and 20 μl/kg USCA) in 1 hemisphere on or adjacent to the optic tract. Each row of traces was obtained in 1 animal. A location on or adjacent to the optic tract in 1 hemisphere was sonicated; the other hemisphere served as a control. Thin blue lines are single measurements (average of recordings obtained during 256 light flashes). Thick red lines or thick blue lines show the average of these 3 measurements. While there was variation in the shape of the curves from animal to animal, it is clear that the measurements in these animals were not substantially changed because of the sonications.
Fig. 8.
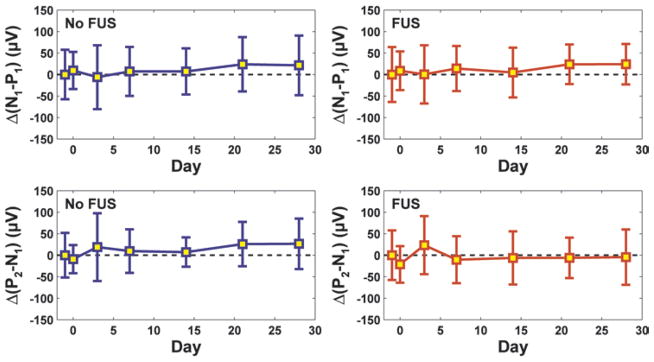
The mean difference (Δ) between post- and pre-FUS magnitudes of early components in the VEP measurement as a function of time for all animals in this study (means ± SDs). No significant differences (p > 0.05) were found between the pre- and post-FUS measurements at any time point. Measurements obtained in sonicated animals appear in red; those made in control animals appear in blue.
Fig. 9.
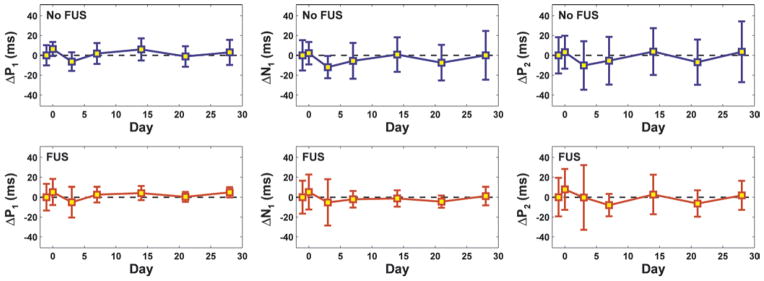
The mean difference (Δ) between post- and pre-FUS latencies of early components in the VEP measurement as a function of time for all animals tested (means ± SDs). No significant differences (p > 0.05) were found between the pre- and post-FUS measurements at any time point. Measurements obtained in sonicated animals appear in red; those made in control animals appear in blue.
Figure 10 features scatterplots of the average postsonication VEP amplitude as a function of the presonication measurement. While the range of magnitudes varied significantly from animal to animal (particularly on the nonsonicated control hemisphere), except for 1 outlier, there was similar agreement between the sonicated and nonsonicated sides. Histological features for this outlier are shown in Fig. 4C, which showed relatively extensive microhemorrhage in the optic tract. Examination of the VEP recordings showed an obvious reduction in VEP magnitude in this animal (Fig. 11).
Fig. 10.
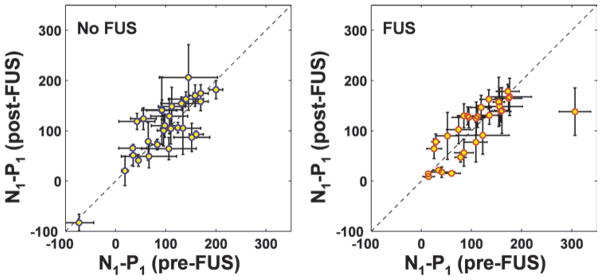
Scatterplots of post- versus pre-FUS measurements of the magnitude of the first VEP components (N1-P1) for all of the rats (nonsonicated control hemisphere, left; sonicated hemisphere, right). Overall, there was no significant difference (p > 0.05). However, a substantial decline in magnitude was observed for 1 animal (outlier in right plot). Histological features for this example are shown in Fig. 4A–C. The hemisphere with more robust signal in the pre-FUS measurement was selected for sonication. This choice is evident by the increased variability in the plot on the left of the measurements made for the control hemisphere (means ± SDs).
Fig. 11.

Visual evoked potential measurements from the animal that demonstrated a functional deficit 48 hours after FUS. A clear decrement is observed in the VEP magnitude in the sonicated hemisphere, but the control measurement was unchanged. Histological features for this animal are shown in Fig. 4A–C.
Discussion
In this work, low-duty-cycle sonications were combined with a USCA to mechanically ablate regions at the skull base that were targeted on or adjacent to the optic tract or chiasm. We found that creating such lesions is feasible, and with a single exception, we did not observe significant functional changes in the VEP measurements. The optic tract, chiasm, and nerve appeared normal or with only comparatively minor damage evident on histological analysis. Neither did this analysis show any evidence of thermal damage in the targeted area or surrounding tissue. Overall, this work provides encouraging evidence that our nonthermal approach may provide a means to ablate skull base tumors while sparing nearby nerve structures.
Presumably, these lesions resulted from vascular damage and, in some cases, rupture produced by inertial cavitation, which led to reactive vasospasm, ischemia, and subsequent ischemic necrosis. The exposure levels used here exceeded the inertial cavitation threshold measured elsewhere in other microbubble-enhanced FUS applications,39,57 and the lesions contained microhemorrhages, which is typical for cavitation-mediated capillary damage.31 Inertial cavitation is associated with the production of shockwaves and high-energy jets,7 which cause mechanical damage to nearby cells. Since the USCA microbubbles are present only in the vasculature, this damage would be directed on the endothelium. Indeed, we did not observe evidence of fragmentation of the parenchyma, which can be produced by inertial cavitation created during high-intensity ultrasound exposures. The microscopic appearance of lesions was reminiscent of early contusion. However, we did not observe an evolution to the more extensive perivascular hemorrhages that occur after traumatic head injury. To elucidate the mechanisms involved in this type of ablation, it could be useful in future studies to perform histological examination at earlier time points after FUS to determine when an inflammatory response occurs and compare the findings to prior work on ischemic brain damage in different contexts.
High temperatures can also be produced during inertial cavitation.18,20,31 However, given previous studies measuring bulk temperature rise during USCA-enhanced sonication at a higher duty cycle,42 simulations of microbubbles in the blood vessels at similar exposure levels,29 and the lack of histological evidence for thermal damage, we expect that any heating produced either was highly localized to the vicinity of the bubble and/or occurred over such a short duration that significant thermally induced bioeffects were avoided. Thus, we consider this ablation to be nonthermal in that the ultrasound-induced effects were primarily mechanical.
The ultrasound-induced damage appeared to preferentially affect gray matter structures. When the focal region partially overlapped the optic tract or chiasm, only comparatively minor effects were observed. This difference between gray and white matter may be the result of the relative paucity of blood vessels (and microbubbles) in the optic tract in comparison with those in the adjacent gray matter. This finding is perhaps encouraging, because preservation of function in the major cranial nerves is critical for skull base targets, and it can be challenging in some patients to identify even large cranial nerves on imaging, particularly when they are adjacent to tumors.62 Of course, one would want to avoid purposely targeting important nerve structures. Some damage to the optic tract and chiasm was seen on histological analysis and a significant functional deficit was produced in 1 case, and these findings suggest that nerves with a lower vascularity may possess some natural resistance to this ablation method. However, this finding may be detrimental if one wishes to target white matter–containing structures for ablation, such as some targets for functional neurosurgery. However, we do not know if other white matter structures show a resistance similar that in the optic tract and chiasm. This is a topic for future study.
The observed difference in sensitivity between gray and white matter structures is the opposite of what would be expected if we had used thermal ablation. With thermal ablation, the temperature increase achieved for a particular FUS exposure can strongly depend on tissue perfusion.5 One would expect white matter, with its lower vascularity and perfusion and higher absorption,4 to be more sensitive to ultrasound-induced thermal damage than gray matter since a greater temperature increase could be produced at a lower acoustic intensity. Indeed, previous studies on ultrasound-induced damage in the brain have reported such a difference.51 In the present study, the low vascularity in the optic tract and chiasm appeared to provide some resistance to USCA-enhanced sonication. This finding is consistent with recent results indicating that FUS-induced blood-brain barrier disruption, which utilizes a USCA with lower-intensity bursts, is significantly less in white matter than in gray matter.36 Note, however, that it is not known whether damage thresholds are the same for the rat and human optic tracts. Differences in the radiosensitivity of nerve structures in different species have been reported,43 and it is possible that more damage could occur in humans if there are similar differences with this type of ultrasound effect.
It is also possible that the sonications directly induced vascular spasm without significant inertial cavitation, which if maintained for a sufficient period could lead to hypoxia and cell death. Spasm in the brain microvasculature has been observed with sonication combined with a USCA without inertial cavitation.8,50 It has also been seen in large arteries with high-intensity sonications above the inertial cavitation threshold.21 If this spasm were maintained for the duration of the 5-minute sonication, it might have been sufficient to induce some of the hypoxic cell death observed on histological examination. Using only this FUS-induced vasospasm would be an advantage over inertial cavitation to create lesions, since inertial cavitation can be difficult to predict and control in practice. Future work with acoustic emission monitoring34 is needed to determine whether inertial cavitation is necessary to induce such lesions. At the time of these experiments, we did not have the ability to monitor acoustic emission in our setup for small-animal MRI.
This study has several other limitations. Visual evoked potential measurements are a somewhat blunt metric for evaluating visual function. While our VEP findings were supported by our histological findings of an absence of major nerve damage, more sensitive tests, such as visual field mapping, may elucidate minor functional deficits that may have been missed. For this reason, we can only conclude that the major function of the optic nerve was conserved after the sonications. Future work is needed to rule out more subtle functional deficits that may be produced by damaging a small number of fibers. Similarly, future studies should evaluate in more detail whether delayed fiber loss in the optic nerve occurs after sonication adjacent to the optic tract or chiasm. For example, one could measure axonal density in the transverse sections of the optic nerve. In the present study, we obtained longitudinal sections in most cases; thus, such quantification was impossible.
Another limitation of our study is the fact that we did not have any online guidance for the sonications. Our targeting accuracy was only about ± 1 mm, and we had significant uncertainty in our in vivo exposure level estimates. Methods such as MR temperature imaging24 or MR acoustic radiation force imaging38 can be used to localize the focal point before ablation, and passive cavitation imaging16 may be useful to ensure that cavitation activity is occurring at the target. With an ability to confirm the position of the focus before we ablate, we anticipate that we could achieve a precision equal to or even surpassing that of proton beam or other radiosurgery methods.
The effects of the skull probably created great uncertainty in our in vivo pressure estimates. In particular, reflections and standing waves within the small rat skull probably added a great deal of uncertainty to our experiments. Techniques that have been developed in other context, such as using pulse trains instead of continuous 10-msec bursts46 or rapidly modulating the acoustic frequency or phase,54 could mitigate this uncertainty and would be worth investigating in the future. The use of a phased array transducer and treatment planning methods to tailor the ultrasound exposures to minimize reflections from the skull base and on large blood vessels may also help to produce a more consistent outcome.
Future work is also needed to determine whether these exposures can be safely delivered to deep brain targets without damaging tissue in the acoustic beam path. Here, the length of the focal region was similar to the thickness of the rat brain, and damage along the beam path was observed—sometimes along the entire thickness of the brain but, surprisingly, not in the cortex. While this issue will not occur in the larger human brain, tests are nevertheless needed to ensure that beam path effects do not occur; therefore, tests in a primate model may be necessary. In particular, effects in large blood vessels, which may have a lower inertial cavitation threshold,52 should be explored. The technique should also be studied in tumors, which often have pathological blood vessels and will have a heterogeneous microbubble concentration. Recent work evaluating similar exposures in a glioma model is promising in this regard.6 Finally, the long-term effects of these lesions should be evaluated. Ablating tissue via vascular destruction may create a risk for later hemorrhage. While we did not observe such effects here, more extensive studies in different brain targets, in tumors, and in tissue previously treated with other therapies (radiation, chemotherapy, and so forth) should be performed to ensure that the technique does not create a risk for later vascular issues.
Conclusions
In summary, functional and histopathological analysis suggest that pulsed sonication combined with a USCA can be used to ablate brain targets at the skull base directly adjacent to the optic tract or chiasm while preserving major visual function. Histological evaluation revealed that the lesions were produced via destruction of the vasculature and subsequent ischemia in downstream tissues. White matter structures appeared to be more resistant to the ultrasound-induced effects, presumably because of a paucity of blood vessels compared with those in gray matter. This work is encouraging in developing a noninvasive alternative to resection that can ablate tissues while preserving surrounding nerve structures, especially for vascular targets, such as tumors, near the skull base. While future work is necessary to determine whether more subtle functional damage results from such exposures and to evaluate the safety profile of this method of noninvasive tissue ablation, the technique is a promising and unique means of noninvasively ablating deep brain structures.
Acknowledgments
The authors thank Dr. Elliot Feldbau, D.M.D., for loaning the dental cement and curing light used in this work, and Dr. Peter Jakab, for help in constructing the MRI coil.
This work was supported by a grant from the Focused Ultrasound Foundation and NIH Grant Nos. P41EB015898, P41RR019703, and R01EB003268.
Abbreviations used in this paper
- ETL
echo train length
- FSE
fast spin echo
- FUS
focused ultrasound
- LFB
Luxol fast blue
- USCA
ultrasound contrast agent
- VEP
visual evoked potential
Footnotes
Portions of this work were presented in abstract form at the 3rd International Symposium on MR-Guided Focused Ultrasound held October 14–17, 2012, in Bethesda, Maryland, and at the 2012 Symposium of the International Society for Therapeutic Ultrasound held June 10–13, 2012, in Heidelberg, Germany.
Disclosure
Author contributions to the study and manuscript preparation include the following. Conception and design: McDannold, Jolesz, Vykhodtseva. Acquisition of data: McDannold, Zhang, Power, Vykhodtseva. Analysis and interpretation of data: McDannold, Zhang, Power, Vykhodtseva. Drafting the article: McDannold, Vykhodtseva. Critically revising the article: all authors. Reviewed submitted version of manuscript: all authors. Approved the final version of the manuscript on behalf of all authors: McDannold. Statistical analysis: McDannold. Administrative/technical/material support: McDannold. Study supervision: McDannold, Jolesz.
References
- 1.Anzai Y, Lufkin R, DeSalles A, Hamilton DR, Farahani K, Black KL. Preliminary experience with MR-guided thermal ablation of brain tumors. AJNR Am J Neuroradiol. 1995;16:39–52. [PMC free article] [PubMed] [Google Scholar]
- 2.Aubry JF, Tanter M, Pernot M, Thomas JL, Fink M. Experimental demonstration of noninvasive transskull adaptive focusing based on prior computed tomography scans. J Acoust Soc Am. 2003;113:84–93. doi: 10.1121/1.1529663. [DOI] [PubMed] [Google Scholar]
- 3.Ballantine HT, Jr, Bell E, Manlapaz J. Progress and problems in the neurological applications of focused ultrasound. J Neurosurg. 1960;17:858–876. doi: 10.3171/jns.1960.17.5.0858. [DOI] [PubMed] [Google Scholar]
- 4.Bamber JC. Ultrasonic attenuation in fresh human tissues. Ultrasonics. 1981;19:187–188. doi: 10.1016/0041-624x(81)90101-3. [DOI] [PubMed] [Google Scholar]
- 5.Billard BE, Hynynen K, Roemer RB. Effects of physical parameters on high temperature ultrasound hyperthermia. Ultrasound Med Biol. 1990;16:409–420. doi: 10.1016/0301-5629(90)90070-s. [DOI] [PubMed] [Google Scholar]
- 6.Burke CW, Klibanov AL, Sheehan JP, Price RJ. Inhibition of glioma growth by microbubble activation in a subcutaneous model using low duty cycle ultrasound without significant heating. Laboratory investigation. J Neurosurg. 2011;114:1654–1661. doi: 10.3171/2010.11.JNS101201. [DOI] [PMC free article] [PubMed] [Google Scholar]
- 7.Chen H, Kreider W, Brayman AA, Bailey MR, Matula TJ. Blood vessel deformations on microsecond time scales by ultrasonic cavitation. Phys Rev Lett. 2011;106:034301. doi: 10.1103/PhysRevLett.106.034301. [DOI] [PMC free article] [PubMed] [Google Scholar]
- 8.Cho EE, Drazic J, Ganguly M, Stefanovic B, Hynynen K. Two-photon fluorescence microscopy study of cerebrovascular dynamics in ultrasound-induced blood-brain barrier opening. J Cereb Blood Flow Metab. 2011;31:1852–1862. doi: 10.1038/jcbfm.2011.59. [DOI] [PMC free article] [PubMed] [Google Scholar]
- 9.Chung DJ, Cho SH, Lee JM, Hahn ST. Effect of microbubble contrast agent during high intensity focused ultrasound ablation on rabbit liver in vivo. Eur J Radiol. 2012;81:e519–e523. doi: 10.1016/j.ejrad.2011.06.002. [DOI] [PubMed] [Google Scholar]
- 10.Clement GT, Hynynen K. Field characterization of therapeutic ultrasound phased arrays through forward and backward planar projection. J Acoust Soc Am. 2000;108:441–446. doi: 10.1121/1.429477. [DOI] [PubMed] [Google Scholar]
- 11.Clement GT, Hynynen K. A non-invasive method for focusing ultrasound through the human skull. Phys Med Biol. 2002;47:1219–1236. doi: 10.1088/0031-9155/47/8/301. [DOI] [PubMed] [Google Scholar]
- 12.Clement GT, Sun J, Giesecke T, Hynynen K. A hemisphere array for non-invasive ultrasound brain therapy and surgery. Phys Med Biol. 2000;45:3707–3719. doi: 10.1088/0031-9155/45/12/314. [DOI] [PubMed] [Google Scholar]
- 13.Colucci V, Strichartz G, Jolesz F, Vykhodtseva N, Hynynen K. Focused ultrasound effects on nerve action potential in vitro. Ultrasound Med Biol. 2009;35:1737–1747. doi: 10.1016/j.ultrasmedbio.2009.05.002. [DOI] [PMC free article] [PubMed] [Google Scholar]
- 14.Creel D, Dustman RE, Beck EC. Intensity of flash illumination and the visually evoked potential of rats, guinea pigs and cats. Vision Res. 1974;14:725–729. doi: 10.1016/0042-6989(74)90070-4. [DOI] [PubMed] [Google Scholar]
- 15.Fujishiro S, Mitsumori M, Nishimura Y, Okuno Y, Nagata Y, Hiraoka M, et al. Increased heating efficiency of hyperthermia using an ultrasound contrast agent: a phantom study. Int J Hyperthermia. 1998;14:495–502. doi: 10.3109/02656739809018250. [DOI] [PubMed] [Google Scholar]
- 16.Gyöngy M, Coussios CC. Passive cavitation mapping for localization and tracking of bubble dynamics. J Acoust Soc Am. 2010;128:EL175–EL180. doi: 10.1121/1.3467491. [DOI] [PubMed] [Google Scholar]
- 17.Herman BA, Harris GR. Calibration of miniature ultrasonic receivers using a planar scanning technique. J Acoust Soc Am. 1982;72:1357–1363. [Google Scholar]
- 18.Holland CK, Apfel RE. An improved theory for the prediction of microcavitation thresholds. IEEE Trans Ultrason Ferroelectr Freq Control. 1989;36:204–208. doi: 10.1109/58.19152. [DOI] [PubMed] [Google Scholar]
- 19.Hynynen K. Biophysics and technology of ultrasound hyperthermia. In: Gautherie M, editor. Methods of External Hyperthermic Heating. New York: Springer-Verlag; 1990. pp. 61–115. [Google Scholar]
- 20.Hynynen K. The threshold for thermally significant cavitation in dog’s thigh muscle in vivo. Ultrasound Med Biol. 1991;17:157–169. doi: 10.1016/0301-5629(91)90123-e. [DOI] [PubMed] [Google Scholar]
- 21.Hynynen K, Colucci V, Chung A, Jolesz FA. Noninvasive arterial occlusion using MRI-guided focused ultrasound. Ultrasound Med Biol. 1996;22:1071–1077. doi: 10.1016/s0301-5629(96)00143-3. [DOI] [PubMed] [Google Scholar]
- 22.Hynynen K, Jolesz FA. Demonstration of potential noninvasive ultrasound brain therapy through an intact skull. Ultrasound Med Biol. 1998;24:275–283. doi: 10.1016/s0301-5629(97)00269-x. [DOI] [PubMed] [Google Scholar]
- 23.Hynynen K, Vykhodtseva NI, Chung AH, Sorrentino V, Colucci V, Jolesz FA. Thermal effects of focused ultrasound on the brain: determination with MR imaging. Radiology. 1997;204:247–253. doi: 10.1148/radiology.204.1.9205255. [DOI] [PubMed] [Google Scholar]
- 24.Ishihara Y, Calderon A, Watanabe H, Okamoto K, Suzuki Y, Kuroda K, et al. A precise and fast temperature mapping using water proton chemical shift. Magn Reson Med. 1995;34:814–823. doi: 10.1002/mrm.1910340606. [DOI] [PubMed] [Google Scholar]
- 25.Iwamura Y, Fujii Y, Kamei C. The effects of certain H(1)-antagonists on visual evoked potential in rats. Brain Res Bull. 2003;61:393–398. doi: 10.1016/s0361-9230(03)00142-4. [DOI] [PubMed] [Google Scholar]
- 26.Jolesz FA, Bleier AR, Jakab P, Ruenzel PW, Huttl K, Jako GJ. MR imaging of laser-tissue interactions. Radiology. 1988;168:249–253. doi: 10.1148/radiology.168.1.3380968. [DOI] [PubMed] [Google Scholar]
- 27.Kahn T, Bettag M, Ulrich F, Schwarzmaier HJ, Schober R, Fürst G, et al. MRI-guided laser-induced interstitial thermotherapy of cerebral neoplasms. J Comput Assist Tomogr. 1994;18:519–532. doi: 10.1097/00004728-199407000-00002. [DOI] [PubMed] [Google Scholar]
- 28.Kettenbach J, Kuroda K, Hata N, Morrison P, McDannold N, Gering D, et al. Laser-induced thermotherapy of cerebral neoplasia under MR tomographic control. Minim Invas Ther Allied Technol. 1998;7:589–598. [Google Scholar]
- 29.Klotz AR, Lindvere L, Stefanovic B, Hynynen K. Temperature change near microbubbles within a capillary network during focused ultrasound. Phys Med Biol. 2010;55:1549–1561. doi: 10.1088/0031-9155/55/6/001. [DOI] [PMC free article] [PubMed] [Google Scholar]
- 30.Lele PP. Effects of focused ultrasonic radiation on peripheral nerve, with observations on local heating. Exp Neurol. 1963;8:47–83. [Google Scholar]
- 31.Lele PP. Effects of ultrasound on “solid” mammalian tissues and tumors in vivo. In: Repacholi MH, Grandolfo M, Rindi A, editors. Ultrasound: Medical Applications, Biological Effects and Hazard Potential. New York: Plenum Press; 1987. pp. 275–306. [Google Scholar]
- 32.Lipsman N, Schwartz ML, Huang Y, Lee L, Sankar T, Chapman M, et al. MR-guided focused ultrasound thalamotomy for essential tremor: a proof-of-concept study. Lancet Neurol. 2013;12:462–468. doi: 10.1016/S1474-4422(13)70048-6. [DOI] [PubMed] [Google Scholar]
- 33.Lynn JG, Putnam TJ. Histology of cerebral lesions produced by focused ultrasound. Am J Pathol. 1944;20:637–649. [PMC free article] [PubMed] [Google Scholar]
- 34.Madanshetty SI, Roy RA, Apfel RE. Acoustic microcavitation: its active and passive acoustic detection. J Acoust Soc Am. 1991;90:1515–1526. doi: 10.1121/1.401891. [DOI] [PubMed] [Google Scholar]
- 35.Martin E, Jeanmonod D, Morel A, Zadicario E, Werner B. High-intensity focused ultrasound for noninvasive functional neurosurgery. Ann Neurol. 2009;66:858–861. doi: 10.1002/ana.21801. [DOI] [PubMed] [Google Scholar]
- 36.McDannold N, Arvanitis CD, Vykhodtseva N, Livingstone MS. Temporary disruption of the blood-brain barrier by use of ultrasound and microbubbles: safety and efficacy evaluation in rhesus macaques. Cancer Res. 2012;72:3652–3663. doi: 10.1158/0008-5472.CAN-12-0128. [DOI] [PMC free article] [PubMed] [Google Scholar]
- 37.McDannold N, Clement GT, Black P, Jolesz F, Hynynen K. Transcranial magnetic resonance imaging-guided focused ultrasound surgery of brain tumors: initial findings in 3 patients. Neurosurgery. 2010;66:323–332. doi: 10.1227/01.NEU.0000360379.95800.2F. [DOI] [PMC free article] [PubMed] [Google Scholar]
- 38.McDannold N, Maier SE. Magnetic resonance acoustic radiation force imaging. Med Phys. 2008;35:3748–3758. doi: 10.1118/1.2956712. [DOI] [PMC free article] [PubMed] [Google Scholar]
- 39.McDannold N, Vykhodtseva N, Hynynen K. Targeted disruption of the blood-brain barrier with focused ultrasound: association with cavitation activity. Phys Med Biol. 2006;51:793–807. doi: 10.1088/0031-9155/51/4/003. [DOI] [PubMed] [Google Scholar]
- 40.McDannold N, Zhang Y, Vykhodtseva N. Blood-brain barrier disruption and vascular damage induced by ultrasound bursts combined with microbubbles can be influenced by choice of anesthesia protocol. Ultrasound Med Biol. 2011;37:1259–1270. doi: 10.1016/j.ultrasmedbio.2011.04.019. [DOI] [PMC free article] [PubMed] [Google Scholar]
- 41.McDannold NJ, Jolesz FA. Magnetic resonance image-guided thermal ablations. Top Magn Reson Imaging. 2000;11:191–202. doi: 10.1097/00002142-200006000-00005. [DOI] [PubMed] [Google Scholar]
- 42.McDannold NJ, Vykhodtseva NI, Hynynen K. Microbubble contrast agent with focused ultrasound to create brain lesions at low power levels: MR imaging and histologic study in rabbits. Radiology. 2006;241:95–106. doi: 10.1148/radiol.2411051170. [DOI] [PubMed] [Google Scholar]
- 43.Medin PM, Foster RD, van der Kogel AJ, Sayre JW, McBride WH, Solberg TD. Spinal cord tolerance to single-fraction partial-volume irradiation: a swine model. Int J Radiat Oncol Biol Phys. 2011;79:226–232. doi: 10.1016/j.ijrobp.2010.07.1979. [DOI] [PMC free article] [PubMed] [Google Scholar]
- 44.Meeren HK, Van Luijtelaar EL, Coenen AM. Cortical and thalamic visual evoked potentials during sleep-wake states and spike-wave discharges in the rat. Electroencephalogr Clin Neurophysiol. 1998;108:306–319. doi: 10.1016/s0168-5597(97)00101-9. [DOI] [PubMed] [Google Scholar]
- 45.Miller DL, Gies RA. Enhancement of ultrasonically-induced hemolysis by perfluorocarbon-based compared to air-based echo-contrast agents. Ultrasound Med Biol. 1998;24:285–292. doi: 10.1016/s0301-5629(97)00267-6. [DOI] [PubMed] [Google Scholar]
- 46.O’Reilly MA, Huang Y, Hynynen K. The impact of standing wave effects on transcranial focused ultrasound disruption of the blood-brain barrier in a rat model. Phys Med Biol. 2010;55:5251–5267. doi: 10.1088/0031-9155/55/18/001. [DOI] [PMC free article] [PubMed] [Google Scholar]
- 47.O’Reilly MA, Waspe AC, Ganguly M, Hynynen K. Focused-ultrasound disruption of the blood-brain barrier using closely-timed short pulses: influence of sonication parameters and injection rate. Ultrasound Med Biol. 2011;37:587–594. doi: 10.1016/j.ultrasmedbio.2011.01.008. [DOI] [PMC free article] [PubMed] [Google Scholar]
- 48.Paxinos G, Watson C. The Rat Brain in Stereotaxic Coordinates. 5. Burlington, MA: Elsevier Academic Press; 2004. [Google Scholar]
- 49.Porciatti V, Pizzorusso T, Maffei L. The visual physiology of the wild type mouse determined with pattern VEPs. Vision Res. 1999;39:3071–3081. doi: 10.1016/s0042-6989(99)00022-x. [DOI] [PubMed] [Google Scholar]
- 50.Raymond SB, Skoch J, Hynynen K, Bacskai BJ. Multiphoton imaging of ultrasound/Optison mediated cerebrovascular effects in vivo. J Cereb Blood Flow Metab. 2007;27:393–403. doi: 10.1038/sj.jcbfm.9600336. [DOI] [PubMed] [Google Scholar]
- 51.Robinson TC, Lele PP. An analysis of lesion development in the brain and in plastics by high-intensity focused ultrasound at low-megahertz frequencies. J Acoust Soc Am. 1972;51:1333–1351. doi: 10.1121/1.1912979. [DOI] [PubMed] [Google Scholar]
- 52.Sassaroli E, Hynynen K. Cavitation threshold of microbubbles in gel tunnels by focused ultrasound. Ultrasound Med Biol. 2007;33:1651–1660. doi: 10.1016/j.ultrasmedbio.2007.04.018. [DOI] [PMC free article] [PubMed] [Google Scholar]
- 53.Silveira LC, Heywood CA, Cowey A. Contrast sensitivity and visual acuity of the pigmented rat determined electrophysiologically. Vision Res. 1987;27:1719–1731. doi: 10.1016/0042-6989(87)90101-5. [DOI] [PubMed] [Google Scholar]
- 54.Tang SC, Clement GT. Standing-wave suppression for transcranial ultrasound by random modulation. IEEE Trans Biomed Eng. 2010;57:203–205. doi: 10.1109/TBME.2009.2028653. [DOI] [PMC free article] [PubMed] [Google Scholar]
- 55.Thomas JL, Fink MA. Ultrasonic beam focusing through tissue inhomogeneities with a time reversal mirror: application to transskull therapy. IEEE Trans Ultrason Ferroelectr Freq Control. 1996;43:1122–1129. [Google Scholar]
- 56.Tran BC, Seo J, Hall TL, Fowlkes JB, Cain CA. Microbubble-enhanced cavitation for noninvasive ultrasound surgery. IEEE Trans Ultrason Ferroelectr Freq Control. 2003;50:1296–1304. doi: 10.1109/tuffc.2003.1244746. [DOI] [PubMed] [Google Scholar]
- 57.Tung YS, Vlachos F, Choi JJ, Deffieux T, Selert K, Konofagou EE. In vivo transcranial cavitation threshold detection during ultrasound-induced blood-brain barrier opening in mice. Phys Med Biol. 2010;55:6141–6155. doi: 10.1088/0031-9155/55/20/007. [DOI] [PMC free article] [PubMed] [Google Scholar]
- 58.Umemura S, Kawabata K, Hashiba K. In: Yuhas DE, Schneider SC, editors. Enhancement of ultrasonic absorption by microbubbles for therapeutic application; 2001 IEEE Ultrasonics Symposium Proceedings: An International Symposium; October7–10, 2001; Omni Hotel, Atlanta, Georgia. Atlanta, GA: Institute of Electrical and Electronics Engineers; 2001. pp. 1311–1314. [Google Scholar]
- 59.Vykhodtseva N, Huang Y, Hynynen K. In: Matsumoto Y, Crum LA, ter Haar GR, editors. Histological findings in the brain after focused ultrasound ablation combined with definity using parameters suited for transcranial application; 10th International Symposium on Therapeutic Ultrasound (ISTU 2010); Tokyo, Japan. 9–12 June 2010; Melville, NY: American Institute of Physics; 2011. pp. 67–72. [Google Scholar]
- 60.Vykhodtseva N, McDannold N, Hynynen K. Induction of apoptosis in vivo in the rabbit brain with focused ultrasound and Optison. Ultrasound Med Biol. 2006;32:1923–1929. doi: 10.1016/j.ultrasmedbio.2006.06.026. [DOI] [PubMed] [Google Scholar]
- 61.Vykhodtseva NI, Sorrentino V, Jolesz FA, Bronson RT, Hynynen K. MRI detection of the thermal effects of focused ultrasound on the brain. Ultrasound Med Biol. 2000;26:871–880. doi: 10.1016/s0301-5629(00)00216-7. [DOI] [PubMed] [Google Scholar]
- 62.Watanabe K, Kakeda S, Yamamoto J, Watanabe R, Nishimura J, Ohnari N, et al. Delineation of optic nerves and chiasm in close proximity to large suprasellar tumors with contrast-enhanced FIESTA MR imaging. Radiology. 2012;264:852–858. doi: 10.1148/radiol.12111363. [DOI] [PubMed] [Google Scholar]
- 63.Yu T, Wang G, Hu K, Ma P, Bai J, Wang Z. A microbubble agent improves the therapeutic efficiency of high intensity focused ultrasound: a rabbit kidney study. Urol Res. 2004;32:14–19. doi: 10.1007/s00240-003-0362-x. [DOI] [PubMed] [Google Scholar]