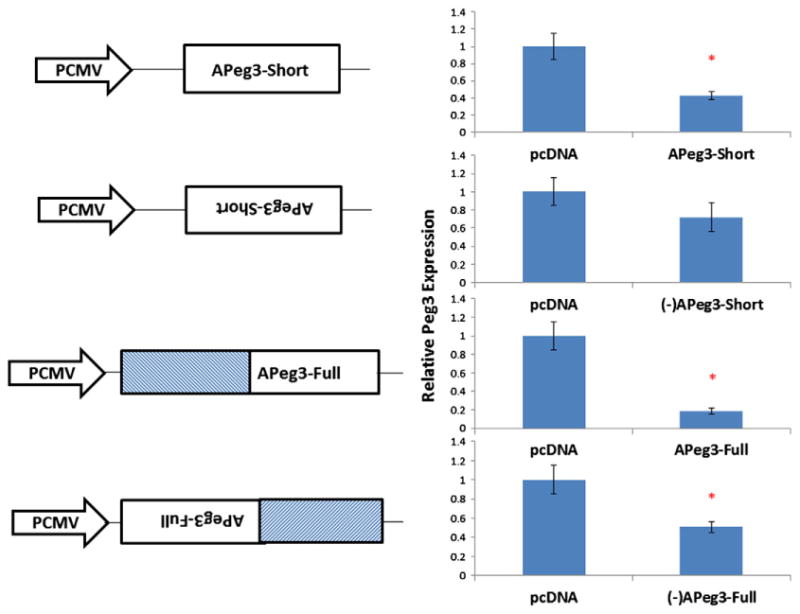
Fig. 3.

Effects of APeg3 overexpression on the transcription levels of Peg3. A series of constructs transcribing APeg3 were transfected into Neuro2A cells. APeg3 transcription was driven by the Cytomegalovirus (CMV) promoter, and terminated and polyadenylated by a Bovine Growth Hormone (BGH) terminator. Transfected cells were selected with hygromycin antibiotic (500 mg/mL). Potential effects of APeg3 overexpression were measured by determining the transcription levels of Peg3 using the total RNA isolated from the transfected cells with qRT-PCR. The transcription levels of Peg3 were first normalized to β-Actin, then compared to a control (pCDNA, empty vector). The results derived from multiple transfections (n = 6) with each trial representing three individual wells were summarized and presented as graphs with standard deviations. Asterisks represent statistically significant changes in the transcription levels of Peg3 between two constructs.
