Abstract
Fluorescent Timer, or DsRed1-E5, is a mutant of the red fluorescent protein, dsRed, in which fluorescence shifts over time from green to red as the protein matures. This molecular clock gives temporal and spatial information on protein turnover. To visualize mitochondrial turnover, we targeted Timer to the mitochondrial matrix with a mitochondrial-targeting sequence (coined “MitoTimer”) and cloned it into a tetracycline-inducible promoter construct to regulate its expression. Here we report characterization of this novel fluorescent reporter for mitochondrial dynamics. Tet-On HEK 293 cells were transfected with pTRE-tight-MitoTimer and production was induced with doxycycline (Dox). Mitochondrial distribution was demonstrated by fluorescence microscopy and verified by subcellular fractionation and western blot analysis. Dox addition for as little as 1 h was sufficient to induce MitoTimer expression within 4 h, with persistence in the mitochondrial fraction for up to 6 d. The color-specific conformation of MitoTimer was stable after fixation with 4% paraformaldehyde. Ratiometric analysis of MitoTimer revealed a time-dependent transition from green to red over 48 h and was amenable to analysis by fluorescence microscopy and flow cytometry of whole cells or isolated mitochondria. A second Dox administration 48 h after the initial induction resulted in a second round of expression of green MitoTimer. The extent of new protein incorporation during a second pulse was increased by administration of a mitochondrial uncoupler or simvastatin, both of which trigger mitophagy and biogenesis. MitoTimer is a novel fluorescent reporter protein that can reveal new insights into mitochondrial dynamics within cells. Coupled with organelle flow cytometry, it offers new opportunities to investigate mitochondrial subpopulations by biochemical or proteomic methods.
Keywords: mitochondria, fluorescence imaging, mitochondrial turnover, Fluorescent Timer protein, mitophagy
Introduction
Mitochondrial biogenesis and mitophagy are processes that determine mitochondrial turnover, along with fusion and fission.1 Mitophagy is the targeting and elimination of mitochondria by autophagy. Mitochondrial biogenesis, which balances mitophagy, requires mitochondrial DNA replication, expansion of inner and outer membranes, and coordinated synthesis, import, and assembly of nuclear- and mitochondrial-encoded proteins, followed by subsequent rounds of fusion and fission.2 Mitochondria undergo successive rounds of fission and fusion with a dynamic exchange of components to segregate functional and damaged elements.3 Impaired mitochondrial quality control has been implicated in neurodegenerative diseases such as Alzheimer, Parkinson, and Huntington diseases, and in the generation of excessive reactive oxygen species.4,5 Aging cells also exhibit impaired mitochondrial quality control, in which mitochondrial fission is defective, and results in the accumulation of large, senescent mitochondria.6 In addition, mitochondrial turnover plays a pivotal role in the heart, where mitophagy is essential for the cardioprotection achieved with ischemic preconditioning.7 Thus, monitoring mitochondrial turnover is of great importance given the essential role it plays in health and disease.
Mitochondrial turnover was first measured in the 1950s by monitoring 35S-methionine incorporation into newly synthesized proteins and their subsequent degradation, following a chase with unlabeled methionine. Measurements of mitochondrial protein turnover in rat heart and liver were used to establish a half-life for mitochondria of ~17 d.8 Bicarbonate labeling studies revealed coordinated turnover of matrix and inner membrane components with kinetics that were considerably slower than those of the outer mitochondrial membrane.9 More recently, Ping and colleagues established a novel technique employing deuterium labeling and mass spectrometry to monitor the turnover of hundreds of individual mitochondrial proteins.10 This technical tour de force revealed the surprising finding that these proteins had distinctive rates of turnover that varied quite widely. However, the electron transfer proteins of the inner membrane had relatively long half-lives, consistent with the relatively slow rate of diffusion of inner membrane constituents demonstrated in studies employing inner membrane-targeted fluorescent proteins.11 One limitation of the radiolabeling and deuterium labeling approaches is that they do not allow imaging of the process or detection of heterogeneity between cells in a population or among mitochondria within a cell.
Fluorescent Timer, or DsRed1-E5, is a mutant of the red fluorescent protein, dsRed, developed by Terskikh et al.12 Its fluorescence shifts over time from green (excitation and emission maxima = 483 nm and 500 nm) to red (excitation and emission maxima = 558 nm and 583 nm) as the protein matures. This 28-kDa fluorescent timer contains two amino acid substitutions, V105A and S197T, responsible for enhanced fluorescence intensity and shift in color over time.13 The maturation from green to red fluorescence is unaffected by pH, ionic strength, or protein concentration, but is affected by temperature, oxygen, and light exposure.12 This tetrameric mutant protein, referred to as Timer, can be used to derive temporal and spatial information on protein turnover.
The present work describes the development of a fluorescent tool that allows real-time visualization of mitochondrial turnover in living cells.
Results
Inducible expression and mitochondrial localization of MitoTimer
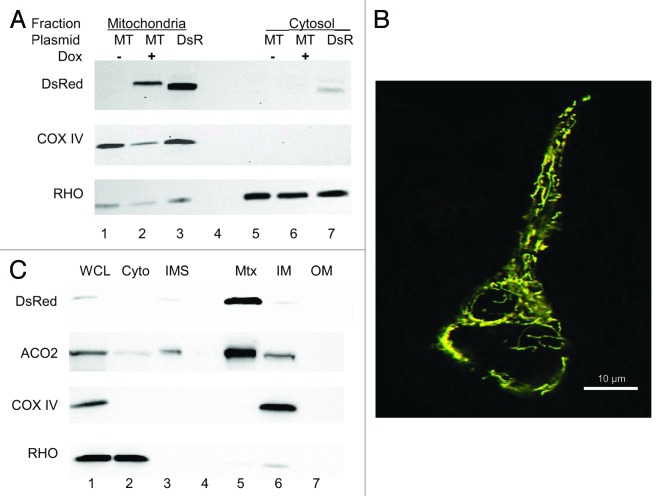
To determine localization of MitoTimer, Tet-On HEK 293 cells were transfected with 500 ng of pTRE-tight-MitoTimer and treated with Dox (2 µg/ml) continuously for 48 h following transfection. Cells were homogenized and subjected to subcellular fractionation to isolate mitochondria and cytosol. MitoTimer was detected in the mitochondrial fraction but absent in the cytosolic fraction, demonstrating specificity of mitochondrial targeting. In the absence of Dox, MitoTimer was not detected in pTRE-tight-MitoTimer-transfected Tet-On HEK 293 cells, indicating that MitoTimer protein expression was subject to tetracycline regulation (Fig. 1A). Fluorescence microscopy of transfected and Dox-exposed cells revealed a pattern consistent with mitochondrial targeting of MitoTimer (Fig. 1B).
Figure 1. MitoTimer localizes to mitochondria. (A) HEK 293 cells were transfected with pTRE-MitoTimer (MT), exposed to Dox (+) or vehicle (−) for 24 h, then subjected to subcellular fractionation to obtain mitochondria (lanes 1–3) and cytosol (lanes 5–7). As a positive control for the DsRed antibody, which recognizes DsRed as well as MitoTimer, a dish of cells were transfected with mitochondrial-targeted DsRed (DsR, lanes 3 and 7). Blots were probed with antibody to COX IV (mito marker) and RHO (cytosol marker). (B) Deconvolved fluorescence image (merged red and green channels) of a transfected and Dox-induced cell showing subcellular localization of MitoTimer. Scale bar: 10 µm. (C) Cells were transfected with MitoTimer and induced with Dox for 24 h, then disrupted to obtain whole cell lysate (WCL), cytosol (Cyto), and mitochondria, which were further disrupted to obtain intermembrane space (IMS), matrix (Mtx), inner membrane (IM), and outer membrane (OM). MitoTimer distribution was detected with antibody to DsRed. RHO was used as a cytosol marker, ACO2 as a matrix marker, and COX IV as an inner membrane marker.
To determine specific mitochondrial localization of MitoTimer, Tet-On HEK 293 cells were transfected with 500 ng of pTRE-tight-MitoTimer and treated with Dox for 48 h. Cells were homogenized to recover mitochondria, which were then fractionated to recover proteins from mitochondrial outer membrane, intermembrane space, inner membrane, and matrix compartments. MitoTimer was detected specifically in the mitochondrial matrix fraction (Fig. 1C).
Time-dependent expression of MitoTimer
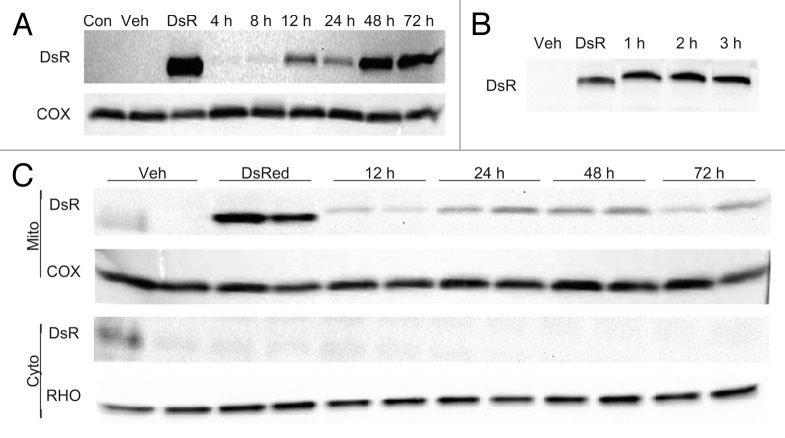
To assess MitoTimer protein expression over time, Tet-On HEK 293 cells were transfected with 500 ng of pTRE-tight-MitoTimer, exposed to Dox for various times as indicated in Figure 2A and expression of MitoTimer was assessed by western blot of cytosol and mitochondrial fractions. Results indicate MitoTimer expression was detected as early as 4 h and persisted (in the presence of continuous Dox) for at least 72 h.
Figure 2. MitoTimer expression. (A) Cells stably expressing rtTA were transfected with pTRE-MitoTimer and 24 h later exposed to Dox for 4 to 72 h. Cell lysates were prepared at the indicated times and probed for MitoTimer expression with anti-DsRed antibody. As a positive control for the antibody, one dish of cells was transfected with Mito-targeted DsRed driven by the CMV promoter (DsR). Negative controls were untransfected cells (Con), and transfected cells exposed to vehicle only for 24 h (Veh). (B) Cells stably expressing rtTA were transfected with pTRE-MitoTimer and 24 h later exposed to Dox for 1–3 h, which was then washed out and replaced with fresh media (without Dox). After 24 h, cell lysates were prepared. As a positive control for the antibody, one dish of cells was transfected with Mito-targeted DsRed driven by the CMV promoter (DsR). (C) Cells stably expressing rtTA were transfected with pTRE-MitoTimer and 24 h later exposed to Dox for 1 h, then harvested after culturing in Dox-free medium for the indicated times (12–72 h). Vehicle control cells were cultured for 72 h. As a positive control for the antibody, one dish of cells was transfected with Mito-targeted DsRed driven by the CMV promoter (DsR). Cells were fractionated to obtain cytosol and the crude mitochondrial pellet, and probed for MitoTimer expression using the antibody to DsRed. Loading was confirmed by COX IV antibody for the mitochondrial fraction and RHO for the cytosol.
To overcome the asynchronous incorporation of continuously synthesized new MitoTimer, it was necessary to induce MitoTimer expression with shorter Dox exposure times. Tet-On HEK 293 cells were transfected with 500 ng of pTRE-tight-MitoTimer, pulsed with Dox for intervals of 1, 2, or 3 h, then washed with PBS and cultured for an additional 24 h. Western blot analysis of whole cell lysates harvested 24 h after Dox showed that Dox exposure for as little as 1 h was sufficient to induce MitoTimer expression that could be detected up to 24 h later (Fig. 2B). To establish how long MitoTimer could be detected in the mitochondria following a 1 h Dox pulse, HEK 293 Tet-On cells were transfected with pTRE-tight-MitoTimer plasmid, and 24 h later exposed to Dox for 1 h followed by PBS wash and fresh media without Dox. Cells were harvested 12, 24, 48, or 72 h later. Results show that MitoTimer protein expression persisted in mitochondria for at least 72 h after the initial 1 h Dox exposure (Fig. 2C).
Imaging of MitoTimer
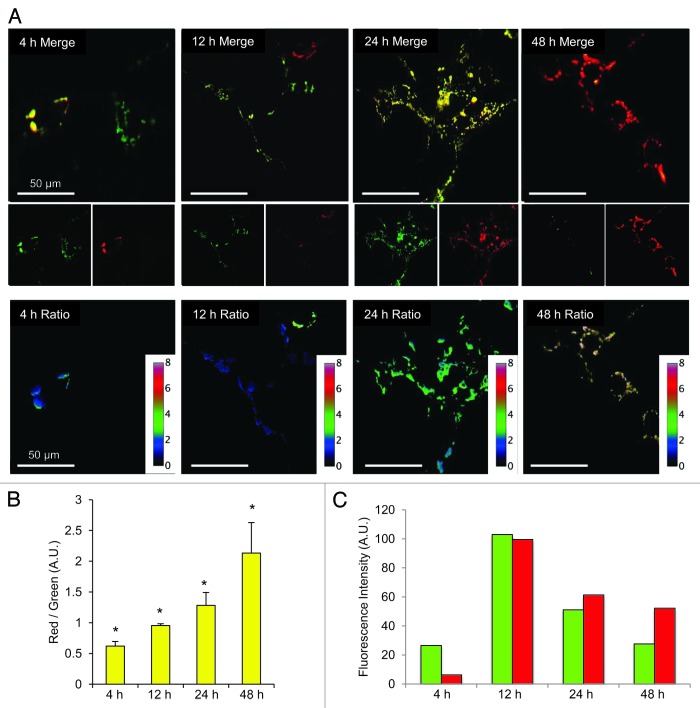
To visualize MitoTimer fluorescence over time, Tet-On HEK 293 cells were transfected with 500 ng of pTRE-tight-MitoTimer, exposed to Dox for 1 h, then imaged after 4 to 48 h. Over time, the predominant color shifted from green to red (Fig. 3A). The ratio of the fluorescence signal intensity in the red and green channels was determined pixel-by-pixel and displayed in false color (Fig. 3A). The average ratio determined from 100 cells was quantified at various times and revealed progressive maturation of MitoTimer (red conversion) (Fig. 3B); although some fluorescent protein could be detected as early as 4 h, maximal expression was apparent at 12 h, with color maturation out to 48 h (Fig. 3C). The kinetics of color maturation closely match the previously published kinetics using Timer expressed in the cytosol,12 suggesting that the mitochondrial matrix environment did not substantially alter the process.
Figure 3. Imaging of MitoTimer. (A) Cells stably expressing rtTA were transfected with pTRE-MitoTimer, exposed to Dox for 1 h, and then imaged 4, 12, 24, or 48 h later. Merged images of the green and red channels are shown; smaller insets show the green and red channels. Scale bar, 50 µm. The lower set of images show the red/green ratio plotted in false color, with a high red-to-green ratio as red (top of scale). (B) Red/green quantification of 100 cells per condition is shown. *P < 0.05 compared with the next time point. (C) The mean fluorescence intensity values of the individual channels are shown for each time point.
During live-cell imaging, we noted that prolonged light exposure accelerated the maturation (red photoconversion). We did not observe reversion to green fluorescence under any imaging conditions (data not shown). To establish whether fixation could prevent the time-dependent maturation of the fluorescence, Tet-On HEK 293 cells were transfected with the pTRE-tight-MitoTimer plasmid, induced with Dox for 24 h, then fixed in 4% paraformaldehyde. Images of the same region taken 4, 24 and 48 h after fixation revealed the same fluorescence characteristics, indicating that fixation of MitoTimer stabilizes the green and red conformations and prevents post-fixation color maturation (data not shown). This allows image analysis of cells expressing MitoTimer to be performed at convenient times after fixation without concern that the fluorescence characteristics will change over time.
Flow cytometry for analysis of MitoTimer
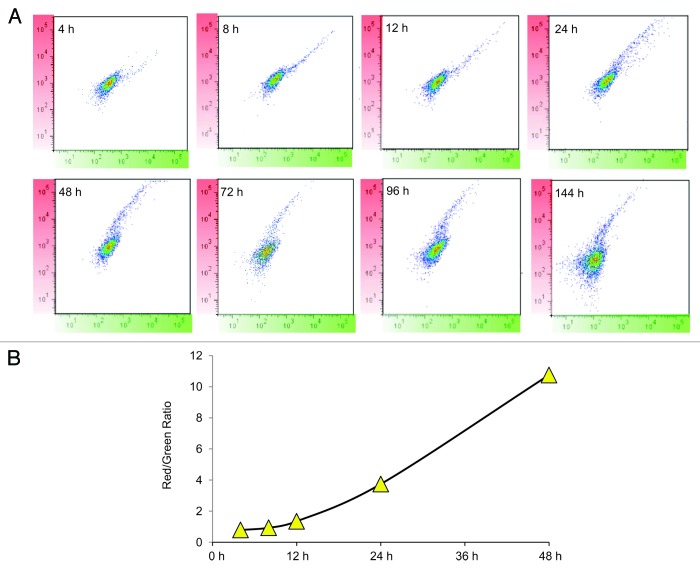
The fluorescence properties of MitoTimer are compatible with analysis by flow cytometry using a 488-nm laser for excitation and detection in the FITC and PE channels. HEK 293 Tet-On cells were seeded, transfected with 500 ng of pTRE-tight-MitoTimer plasmid 24 h later, exposed to Dox for 1 h, harvested and fixed in 4% paraformaldehyde at intervals from 4 to 144 h later. As early as 4 h after Dox, cells expressing MitoTimer were detected in the green channel. After gating out the nonfluorescent population, cells were analyzed with results plotted with green on the x-axis and red on the y-axis. Over time, the ratio of green to red shifted, with near-total absence of green signal by 48 h and persistence of the red fluorescence out to 144 h (Fig. 4A). The time-dependent change in the red:green ratio revealed a linear relationship that validates the utility of Timer as a molecular clock (Fig. 4B).
Figure 4. Flow cytometry analysis of MitoTimer in cells. (A) Transfected cells were exposed to Dox for 1 h, then cultured for the indicated times (4–144 h), harvested, and analyzed by flow cytometry (y-axis, red channel; x-axis, green channel). (B) The red/green ratio is plotted as a function of time.
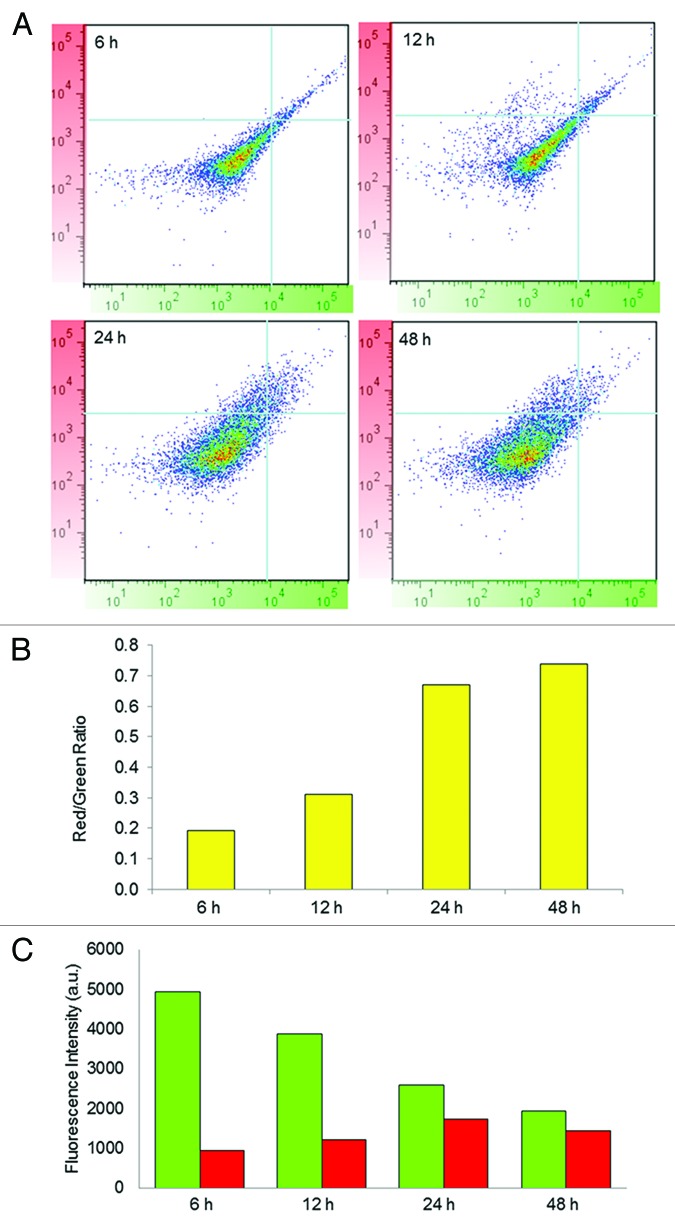
Flow cytometry is compatible with analysis of mitochondria-sized particles. To assess the utility of MitoTimer in isolated mitochondria, HEK293 Tet-On cells were seeded and transfected with pTRE-tight-MitoTimer. Cells were disrupted for mitochondrial isolation 6, 12, 24, and 48 h after 1 h Dox exposure. The mitochondria were then analyzed by flow cytometry as shown in Figure 5. The mitochondrial population shows MitoTimer color maturation with kinetics similar to that seen in whole cells.
Figure 5. Flow cytometry analysis of isolated mitochondria. (A) Cells were transfected, exposed to Dox for 1 h, cultured for the indicated time (6–48 h), and harvested. After cell disruption, mitochondria were isolated by differential centrifugation and analyzed by flow cytometry (y-axis, red channel; x-axis, green channel). (B) The red/green ratio is plotted as a function of time. (C) The mean fluorescence intensity values of the individual channels are shown for each time point.
Use of MitoTimer to assess new mitochondrial protein import
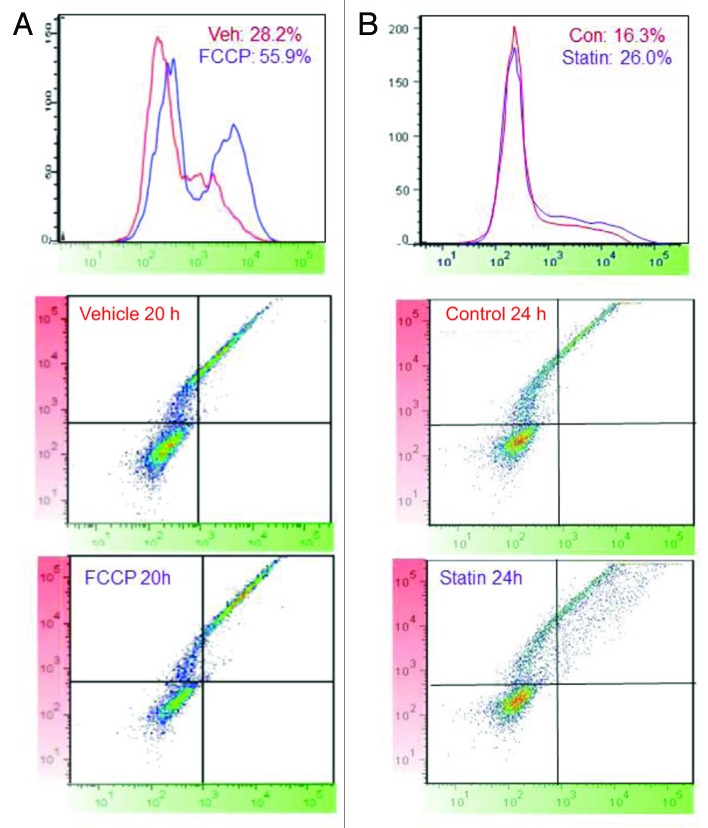
Mitophagy and biogenesis are linked,14 and we have previously shown loss of mitochondrial mass in response to FCCP or statins.15 However, when mitophagy is balanced by concurrent biogenesis, mitochondrial mass may be minimally affected. We used MitoTimer to investigate mitochondrial protein import as an indication of mitochondrial biogenesis. To distinguish between previously expressed MitoTimer and new protein import, we used a protocol involving two pulses of Dox separated by 48–72 h. We established a stably transfected cell line from C2C12 cells, expressing rtTA and pTRE-tight-MitoTimer. After sorting for cells that inducibly expressed MitoTimer, we treated cells with Dox for 1 h, and allowed the MitoTimer to mature for 72 h until all mitochondria exhibited only the red protein. These cells were then subjected to ethanol (vehicle control) or FCCP to trigger mitophagy. After 24 h, FCCP was washed out and Dox was added for 1 h, then washed out and replaced with full media. Cells were harvested 20 h later for analysis by flow cytometry. During the recovery from FCCP, brisk mitochondrial biogenesis occurred as indicated by the robust incorporation of newly synthesized (green) MitoTimer protein (Fig. 6A); by comparison, there was much less MitoTimer protein import in the vehicle control cells. Biogenesis in response to FCCP was confirmed by qRT-PCR of nontransfected cells, showing increased expression of peroxisome proliferator-activated receptor gamma coactivator 1-α (PPARGC1A) mRNA and its downstream target NRF1, as well as protein expression of PPARGC1A (Fig. S1).
Figure 6. Pulsed MitoTimer induction reveals enhanced protein import after stimulation. (A) Stably transduced C2C12 cells were pulsed for 1 h with Dox, then 72 h later were exposed to FCCP or vehicle control for 24 h, followed by washout, addition of Dox for 1 h, and replacement with fresh media. After another 20 h, cells were harvested, fixed, and analyzed by flow cytometry. Histograms of cell number vs. fluorescence intensity (FITC channel) are shown with the percent of cells exceeding the threshold (arbitrarily set at 103) indicated. (B) Transiently transfected HL-1 cells were exposed to Dox for 2 h followed by 48 h in fresh media. Dox was added a second time in the presence or absence of simvastatin, then cells were cultured for the indicated time before fixation and flow cytometric analysis. Histogram plots of cell number vs. green fluorescence intensity are shown, with gating indicating the percentage of cells expressing green MitoTimer after the second pulse. The threshold was set based on cells that did not receive the second pulse of Dox. Lower panels show a dot-plot profile of MitoTimer-expressing cells (y-axis, red channel; x-axis, green channel).
In the second series of experiments, HL-1 cells were transiently transfected with rtTA and pTRE-tight-MitoTimer, pulsed with Dox for 1 h followed by 48 h in full media. They were then exposed to a second Dox pulse for 1 h in the absence or presence of 1 µM simvastatin, which stimulates mitochondrial biogenesis.16 After 24 h, cells were fixed and analyzed by flow cytometry (Fig. 6B). In cells exposed to simvastatin, mitochondrial import of newly synthesized (green) MitoTimer was increased relative to control cells (Fig. 6B). Thus, a protocol employing two pulses of Dox separated by at least 48 h can allow real-time detection of enhanced mitochondrial protein import, a correlate of mitochondrial biogenesis.
Discussion
Timer fluorescent protein functions as a molecular clock over a 48 h span. To use this to monitor mitochondrial turnover, we targeted it to mitochondria and confirmed its selective localization in the mitochondrial matrix and also confirmed that the rate of color maturation was consistent with previous reports, indicating that the matrix environment did not affect the time constant of the clock. Timer protein is not affected by pH over the physiological range of 7.0–8.0, but is denatured with loss of fluorescence at pH 4.5;12 thus, its use for tracking delivery of mitochondria to lysosomes is limited to loss of signal intensity over time.
The studies demonstrated the utility of MitoTimer for imaging and flow cytometric analysis. The fluorescent protein persists in mitochondria for up to 6 d after a 1 h pulse of Dox. Fixation of cells arrested the color maturation, facilitating extended image acquisition and more convenient imaging protocols. The photoconversion in live cells may represent a useful tool much like photo-activatable GFP, which is non-fluorescent until after irradiation, and which has been widely used to track fusion and fission events.11 Recently-expressed (green) MitoTimer converts to red after photo-irradiation and would allow two-color imaging of fusion/fission events.
These studies utilize transient transfection of MitoTimer in cells expressing the rtTA (Tet-On) transactivator. Previous studies of bulk mitochondrial protein turnover have revealed a half-life of ~14 d. Loss of the MitoTimer red fluorescent signal intensity over time would reflect mitochondrial turnover, but is subject to limitations: (1) cell division would dilute the amount of MitoTimer remaining after a single Dox exposure; (2) one must assume that MitoTimer stability within mitochondria is comparable to native mitochondrial proteins; (3) fusion and fission events would result in homogeneous redistribution of MitoTimer among all mitochondria. For these reasons, MitoTimer will be most useful to monitor mitochondrial half-life in nondividing cells or in cells with limited mitochondrial dynamics.
The use of a second pulse of Dox to initiate another round of (green) MitoTimer synthesis allows monitoring of mitochondrial biogenesis revealed by an increase in fluorescent protein import. Comparison of the red and green signals independently can indicate mitophagy (progressive loss of red) and biogenesis (increased incorporation of green after the second Dox pulse) in response to a stimulus such as FCCP or simvastatin.
MitoTimer represents a novel tool to monitor mitochondrial turnover. It is of particular value where mitophagy is closely matched with biogenesis, as is the case in HL-1 cells exposed to simvastatin.15 It also has the potential to identify subpopulations on the basis of enhanced protein import, which may be a characteristic of a distinctive mitochondrial subpopulation. Coupled with organelle flow cytometry, it may be possible to conduct biochemical and proteomic analyses of import-active and import-poor mitochondria. MitoTimer represents a new approach to monitor mitochondrial turnover in cells.
Materials and Methods
Construction of pTRE-tight-MitoTimer
MitoTimer was generated by subcloning Timer (Clontech, 632402) in-frame into the Clontech mitochondria-targeting DsRed2 expression vector (pDsRed2-Mito, 632421) after excising DsRed2 using BamHI and NotI. The mitochondrial targeting sequence in this construct is derived from cytochrome c oxidase subunit VIII and has been used to deliver fusion proteins across the mitochondrial inner membrane.17 Subsequent proteolytic processing of the targeted protein results in its accumulation in the matrix compartment. MitoTimer was then subcloned into a tetracycline-inducible promoter construct (pTRE-tight) (Clontech, 631059) using the NheI and XbaI sites.
Cell culture and pTRE-tight-MitoTimer transfection
HEK 293 cells engineered with the Tet-On expression system obtained from Clontech were used in the characterization of MitoTimer. HEK 293 Tet-On cells were maintained in DMEM 1X + GlutaMax media (Gibco, 10569-010) containing 10% tetracycline-free fetal bovine serum (Clontech, 631106), 5% antibiotic-antimycotic (Gibco, 15240) and 5% D-glucose. HEK 293 Tet-On cells were transfected with the pTRE-tight-MitoTimer plasmid using the Effectene Transfection Reagent (Qiagen, 301427) according to the manufacturer’s instructions (500 ng DNA for 35- and 60-mm dishes and 1 µg for larger dishes). The day after transfection, media containing Dox (2 µg/ml) was added to cells for 1 h or as indicated, then replaced with fresh media. In some experiments, Dox was added a second time (48 h later) to initiate a second round of MitoTimer expression, and cells were analyzed 12–32 h after the second Dox pulse.
The C2C12-mitoTimer cells were established utilizing self-inactivating lentiviral and retroviral particles. The mitoTimer DNA was cloned into the pTRE-Tet-On lentiviral transfer vector.18 The lentiviral particles were produced by transfecting a 10-cm2 plate of 293T cells with a combination of plasmids containing 2 µg of packaging vector pCMV d8.2 containing the gag-pol proteins of HIV-1, 3 µg of the transfer vector18 pTRE mitoTimer, 3 µg of envelope glycoprotein of the vesicular stomatitis virus (pCI-VSVg), and 1.5 µg of pci-Vpr. The plasmids were combined with 125 µl of FCS-free DMEM and 30 µg of polyethylenimine (linear, MW 25000; Polysciences, Inc., 23966-2), and added to the 293T cells. Media (DMEM with 10% fetal calf serum, Pen-Strep and L-glutamine) was replaced 24 h post-transfection and viral supernatant was collected at 48 and 72 h. The media was then filtered through a 0.45-micron PTFE filter (Pall Corporation, 4422). In parallel, nonreplicative Moloney’s murine leukemia virus particles encoding reverse Tet transactivator (rtTA) were produced by transfecting a 10-cm2 plate of Phoenix-GP cells (Courtesy of Dr Garry Nolan) with 3 µg of the packaging vector (pBMN.rtTA.i.Zeo) and 3 µg of pCI-VSVg, and collected as per the lentiviral particle production protocol. Both supernatants were used to spin-infect naïve C2C12 cells in a 6-well plate format. Briefly, viral supernatants were mixed with polybrene (Sigma, 107689; 5 µg/mL final concentration), added to cells seeded at 1 × 10⁵ per well, and spun at 1500× g, 32°C for 80 min in a hanging bucket rotors centrifuge (Becton Dickinson). The transduced cells were activated with Dox (2 µg/ml) and sorted by Flow Cytometry on a BD FACSAria using 405-nm, 488-nm and 633-nm lasers. Data were collected on FACSDiva 6.1.1 at the San Diego State University FACS core facility.
Fluorescence microscopy
After transfection and treatments as indicated, cells cultured in glass bottom dishes (MatTek, P35G-1.5-14-C) were fixed with 4% paraformaldehyde in PBS for 10 min and washed 3 × 5 min with 1× PBS. One drop of Aqua/Polymount (PolySciences, 186-06-20) was added to the center of the MatTek dish, covered with a coverglass circle (Fisher, 12-545-80), and stored at 4 °C in the dark. Cells were imaged on a Nikon TE300 fluorescence microscope equipped with a cooled charge-coupled device camera (Orca-ER, Hamamatsu). Images were deconvolved using Autodeblur Software. Analysis and formatting of images was performed using NIH ImageJ software. Fluorescence images were captured using primary mirror/filter mirror set (Chroma, 61002) with the addition of secondary emission filters (Chroma D520/40 and D605/55). This provided excitation at 490 nm (green) and 550 nm (red) with detection of green (500–540 nm) and red (580–640 nm) fluorescence signals. Imaging conditions are critical: exposure time and illumination must be held constant across samples. The excitation and emission optima require appropriate filter sets, although signal detection with commonly available filter sets is possible, though with far lower sensitivity (see Fig. S2).
Image processing
Ratiometric images were generated using NIH ImageJ software. Rolling ball background subtraction (rolling ball radius = 50 pixels) was executed on both green and red images. A threshold was set to the mitochondrial regions and the images were converted to a 32-bit format. Dividing the red image over the green image on a pixel-by-pixel basis (ratio = red/green) generated the final ratiometric image. A custom false-color scale with its corresponding calibration bar was then applied to the image Quantification of red/green ratio was performed using the mean pixel intensities of the ratiometric images generated.
Flow cytometry
For flow cytometry, cells were plated in 60-mm tissue culture plates (Falcon, 353002) and after transfection and treatments as described in the text, were harvested by brief trypsinization, followed by neutralization of trypsin, washing, and fixation in 4% paraformaldehyde in PBS. The FACS-BD FACSCanto was used for analysis with 488-nm laser for excitation and detection using FITC (green) and PE (red) channels. On average, 10,000 events were analyzed per sample. HEK 293 Tet-On cells transfected with Mito-DsRed or GFP-LC3 served as positive controls for red and green fluorescence. HEK 293 Tet-On cells transfected with pTRE-Tight-MitoTimer not exposed to Dox served as a negative control.
Subcellular fractionation
For subcellular fractionation, cells were plated in 10-cm tissue culture dishes (Falcon, 353003). After transfection and the indicated treatments, cells were washed with 1× PBS followed by addition of Mitochondrial Isolation Buffer (1 mM EDTA, 10 mM 4-(2-hydroxyethyl)-1-piperazineethanesulfonic acid (HEPES), 250 mM sucrose, pH 7.4) supplemented with protease inhibitor cocktail (Roche, 11873580001). Cells were detached with a tissue culture cell scraper (Fisher, 08-100-240) and mechanically lysed by passing through a 27½ gauge needle. Lysates were centrifuged at 600× g for 5min. Postnuclear supernatants were used as whole cell lysates or centrifuged at 8000× g for 15 min to isolate mitochondria. The resulting supernatant fraction representing cytosol and light membranes was collected. The mitochondrial pellet fraction was washed with Mitochondrial Isolation Buffer and centrifuged at 8000× g for 10 min. The resulting supernatant fraction was aspirated and the mitochondrial pellet fraction was resuspended in a small volume of Mitochondrial Isolation Buffer. The whole cell lysates, cytosol, and mitochondrial fractions were used for protein determination and western blot analysis.
Mitochondrial fractionation
Cells from a 15-cm tissue culture dish were transfected and after the indicated treatments, were recovered by scraping in 1 ml PBS and centrifuged at 300× g for 5 min at 4 °C. The pellet was resuspended in KCl Respiration Buffer [140 mM KCl, 10 mM MgCl2, 10 mM 3-(N-morpholino)propanesulfonic acid, 5 mM KH2PO4, 1 mM ethylene glycol tetraacetic acid, 0.2% bovine serum albumin (fatty acid free; Sigma, A6003-25G)], supplemented with protease inhibitor cocktail. Cells were disrupted via Dounce homogenization and centrifuged at 600× g for 5min. The resulting supernatant fraction was centrifuged at 8000× g for 15 min to pellet the mitochondria and washed twice for 10 min at 8000× g. To swell the mitochondria in order to rupture the outer membrane, the mitochondrial pellet fraction was resuspended in hypotonic buffer (1 mM ethylene glycol tetraacetic acid, 10 mM potassium phosphate, pH 7.4) by trituration and stored on ice for 15 min; MgCl2 was supplemented to a final concentration of 1 mM for an additional 5 min, then the mitochondria were centrifuged at 16,000× g for 15 min at 4 °C. The resulting pellet fraction, designated the mitoplast fraction (mitochondrial inner membrane and matrix), was reserved for further processing, while the supernatant fraction, representing proteins from the outer mitochondrial membrane and the intermembrane space was centrifuged at 100,000× g for 60 min at 4 °C to obtain a pellet fraction of outer membrane proteins and a supernatant fraction containing intermembrane space constituents. The mitoplasts were resuspended in Respiration Buffer without albumin, sonicated, and centrifuged at 100,000× g for 60 min at 4 °C, to obtain a pellet fraction of inner membrane proteins and a supernatant fraction of matrix constituents. Pellet fractions were resuspended in consistent volumes to maintain mitochondria-equivalent fractions.
Western blot analysis
Sample proteins from experiments were quantified using the Bio-Rad protein assay kit. Equal amounts of protein were resolved on 10–20% Tris-glycine SDS-PAGE gels (Invitrogen, EC6135 BOX) and transferred to nitrocellulose membranes. The membranes were blocked with 5% nonfat dry milk for 1 h then incubated with 1:1000 diluted primary antibodies against dsRed (Clontech, 632392), COXIV (Cell Signaling, 4844S), TOMM70 (Calbiochem, AP1058), ACO2/aconitase (Cell Signaling, 6922S, cytochrome c (Santa Cruz SC-13560), RHO-GDI (Santa Cruz, SC-373724), and actin (Sigma, A4700). Membranes were washed with Tris-buffered saline (150 mM NaCl, 100 mM Tris-HCl, pH 7.4) with 1% Tween 20 at room temperature and incubated with peroxidase-conjugated goat anti-rabbit or anti-mouse secondary antibodies (KPL, 074-1516, 074-1806, respectively; 1:2500). Blots were developed with SuperSignal West Dura Extended Duration Substrate (Thermo-Pierce, 34076), and immunoreactive bands were visualized using the ChemiDoc XRS system (Bio-Rad).
Statistical analysis
The Student t-test was used to determine statistical significance with P values less than 0.05 accepted as significant. Error bars indicate the standard deviation.
Supplementary Material
Acknowledgments
This work was supported by NIH 5R01HL060590-15 and 5R01AG033283-05 (to RAG). GH is supported by SDSU MBRS/IMSD Program 2R25GM058906-09A2. We also acknowledge the expertise of Brett Hilton of the San Diego State University Flow Cytometry Core Facility.
Glossary
Abbreviations:
- DMEM
Dulbecco’s modified Eagle’s medium
- Dox
doxycycline
- FCCP
carbonyl cyanide 4- (trifluoromethoxy) phenylhydrazone
- GFP
green fluorescent protein
- PPARGC1A
peroxisome proliferator-activated receptor gamma coactivator 1-alpha
Disclosure of Potential Conflicts of Interest
The authors state that there are no conflicts of interest.
Supplemental Materials
Supplemental materials may be found here: www.landesbioscience.com/journals/autophagy/article/26501
Footnotes
Previously published online: www.landesbioscience.com/journals/autophagy/article/26501
References
- 1.Hyde BB, Twig G, Shirihai OS. Organellar vs cellular control of mitochondrial dynamics. Semin Cell Dev Biol. 2010;21:575–81. doi: 10.1016/j.semcdb.2010.01.003. [DOI] [PMC free article] [PubMed] [Google Scholar]
- 2.Scarpulla RC. Transcriptional paradigms in mammalian mitochondrial biogenesis and function. Physiol Rev. 2008;88:611–38. doi: 10.1152/physrev.00025.2007. [DOI] [PubMed] [Google Scholar]
- 3.Twig G, Elorza A, Molina AJ, Mohamed H, Wikstrom JD, Walzer G, Stiles L, Haigh SE, Katz S, Las G, et al. Fission and selective fusion govern mitochondrial segregation and elimination by autophagy. EMBO J. 2008;27:433–46. doi: 10.1038/sj.emboj.7601963. [DOI] [PMC free article] [PubMed] [Google Scholar]
- 4.Gogvadze V, Orrenius S, Zhivotovsky B. Mitochondria as targets for chemotherapy. Apoptosis. 2009;14:624–40. doi: 10.1007/s10495-009-0323-0. [DOI] [PubMed] [Google Scholar]
- 5.Matsuda N, Sato S, Shiba K, Okatsu K, Saisho K, Gautier CA, Sou YS, Saiki S, Kawajiri S, Sato F, et al. PINK1 stabilized by mitochondrial depolarization recruits Parkin to damaged mitochondria and activates latent Parkin for mitophagy. J Cell Biol. 2010;189:211–21. doi: 10.1083/jcb.200910140. [DOI] [PMC free article] [PubMed] [Google Scholar]
- 6.Brunk UT, Terman A. The mitochondrial-lysosomal axis theory of aging: accumulation of damaged mitochondria as a result of imperfect autophagocytosis. Eur J Biochem. 2002;269:1996–2002. doi: 10.1046/j.1432-1033.2002.02869.x. [DOI] [PubMed] [Google Scholar]
- 7.Huang C, Andres AM, Ratliff EP, Hernandez G, Lee P, Gottlieb RA. Preconditioning involves selective mitophagy mediated by Parkin and p62/SQSTM1. PLoS One. 2011;6:e20975. doi: 10.1371/journal.pone.0020975. [DOI] [PMC free article] [PubMed] [Google Scholar]
- 8.Menzies RA, Gold PH. The turnover of mitochondria in a variety of tissues of young adult and aged rats. J Biol Chem. 1971;246:2425–9. [PubMed] [Google Scholar]
- 9.Lipsky NG, Pedersen PL. Mitochondrial turnover in animal cells. Half-lives of mitochondria and mitochondrial subfractions of rat liver based on [14C]bicarbonate incorporation. J Biol Chem. 1981;256:8652–7. [PubMed] [Google Scholar]
- 10.Kim TY, Wang D, Kim AK, Lau E, Lin AJ, Liem DA, Zhang J, Zong NC, Lam MP, Ping P. Metabolic labeling reveals proteome dynamics of mouse mitochondria. Mol Cell Proteomics. 2012;11:1586–94. doi: 10.1074/mcp.M112.021162. [DOI] [PMC free article] [PubMed] [Google Scholar]
- 11.Haigh SE, Twig G, Molina AA, Wikstrom JD, Deutsch M, Shirihai OS. PA-GFP: a window into the subcellular adventures of the individual mitochondrion. Novartis Found Symp. 2007;287:21–36, discussion 36-46. doi: 10.1002/9780470725207.ch3. [DOI] [PubMed] [Google Scholar]
- 12.Terskikh A, Fradkov A, Ermakova G, Zaraisky A, Tan P, Kajava AV, Zhao X, Lukyanov S, Matz M, Kim S, et al. “Fluorescent timer”: protein that changes color with time. Science. 2000;290:1585–8. doi: 10.1126/science.290.5496.1585. [DOI] [PubMed] [Google Scholar]
- 13.Terskikh AV, Fradkov AF, Zaraisky AG, Kajava AV, Angres B. Analysis of DsRed Mutants. Space around the fluorophore accelerates fluorescence development. J Biol Chem. 2002;277:7633–6. doi: 10.1074/jbc.C100694200. [DOI] [PubMed] [Google Scholar]
- 14.Shin JH, Ko HS, Kang H, Lee Y, Lee YI, Pletinkova O, Troconso JC, Dawson VL, Dawson TM. PARIS (ZNF746) repression of PGC-1α contributes to neurodegeneration in Parkinson’s disease. Cell. 2011;144:689–702. doi: 10.1016/j.cell.2011.02.010. [DOI] [PMC free article] [PubMed] [Google Scholar]
- 15.Andres AM, Hernandez G, Lee P, Huang C, Ratliff EP, Sin J, Thornton CA, Damasco MV, Gottlieb RA. Mitophagy is required for acute cardioprotection by simvastatin. Antioxid Redox Signal. 2013 doi: 10.1089/ars.2013.5416. In press. [DOI] [PMC free article] [PubMed] [Google Scholar]
- 16.Bouitbir J, Charles AL, Echaniz-Laguna A, Kindo M, Daussin F, Auwerx J, Piquard F, Geny B, Zoll J. Opposite effects of statins on mitochondria of cardiac and skeletal muscles: a ‘mitohormesis’ mechanism involving reactive oxygen species and PGC-1. Eur Heart J. 2012;33:1397–407. doi: 10.1093/eurheartj/ehr224. [DOI] [PMC free article] [PubMed] [Google Scholar]
- 17.Rutter GA, Theler JM, Murgia M, Wollheim CB, Pozzan T, Rizzuto R. Stimulated Ca2+ influx raises mitochondrial free Ca2+ to supramicromolar levels in a pancreatic beta-cell line. Possible role in glucose and agonist-induced insulin secretion. J Biol Chem. 1993;268:22385–90. [PubMed] [Google Scholar]
- 18.Hilton BJ, Wolkowicz R. An assay to monitor HIV-1 protease activity for the identification of novel inhibitors in T-cells. PLoS One. 2010;5:e10940. doi: 10.1371/journal.pone.0010940. [DOI] [PMC free article] [PubMed] [Google Scholar]
Associated Data
This section collects any data citations, data availability statements, or supplementary materials included in this article.


