Abstract
How cellular metabolic activities regulate autophagy and determine the susceptibility to oxidative stress and ultimately cell death in neuronal cells is not well understood. An important example of oxidative stress is 4-hydroxynonenal (HNE), which is a lipid peroxidation product that is formed during oxidative stress, and accumulates in neurodegenerative diseases causing damage. The accumulation of toxic oxidation products such as HNE, is a prevalent feature of neurodegenerative diseases, and can promote organelle and protein damage leading to induction of autophagy. In this study, we used differentiated SH-SY5Y neuroblastoma cells to investigate the mechanisms and regulation of cellular susceptibility to HNE toxicity and the relationship to cellular metabolism. We found that autophagy is immediately stimulated by HNE at a sublethal concentration. Within the same time frame, HNE induces concentration dependent CASP3/caspase 3 activation and cell death. Interestingly, both basal and HNE-activated autophagy, were regulated by glucose metabolism. Inhibition of glucose metabolism by 2-deoxyglucose (2DG), at a concentration that inhibited autophagic flux, further exacerbated CASP3 activation and cell death in response to HNE. Cell death was attenuated by the pan-caspase inhibitor Z-VAD-FMK. Specific inhibition of glycolysis using koningic acid, a GAPDH inhibitor, inhibited autophagic flux and exacerbated HNE-induced cell death similarly to 2DG. The effects of 2DG on autophagy and HNE-induced cell death could not be reversed by addition of mannose, suggesting an ER stress-independent mechanism. 2DG decreased LAMP1 and increased BCL2 levels suggesting that its effects on autophagy may be mediated by more than one mechanism. Furthermore, 2DG decreased cellular ATP, and 2DG and HNE combined treatment decreased mitochondrial membrane potential. We conclude that glucose-dependent autophagy serves as a protective mechanism in response to HNE.
Keywords: autophagy, oxidative stress, 4-hydroxynonenal, glycolysis, apoptosis, ATP, glutathione, Z-VAD, 3-MA
Introduction
Oxidative stress, as well as cellular bioenergetic and autophagic dysfunction, is a prevalent feature of stroke and neurodegenerative diseases.1 Neurons are particularly vulnerable to oxidative damage, due to their high oxidative metabolic activity, low antioxidant capacity, abundance of polyunsaturated fatty acids and postmitotic nature.2-4 As a major consequence of oxidative stress, accumulation of lipid peroxidation products is prevalent in stroke, cerebral ischemia and neurodegenerative diseases.5-9 An important example is 4-hydroxynonenal, a highly reactive lipid peroxidation product that is increased in the brains of stroke victims and neurodegenerative disease, and is capable of forming protein adducts and stimulating the formation of other reactive species.5-13 Physiologically, the concentration of free HNE in human blood ranges from 0.069 ± 0.015 μM for healthy subjects under the age of 30, and increases to 0.107 ± 0.027 μM for individuals over age 70.14 Pathologically, levels increase substantially due to the initiation of lipid peroxidation with free levels reported in the range of 1–10 μM in patient plasma, tissues, and neurons.15-17 Since HNE readily forms adducts with proteins, measurement of unreacted HNE represents a lower estimate of levels produced in vivo. In this study we selected concentrations that could be generated locally at a site of oxidative stress and mediate acute stress to neurons in regions subject to neurodegeneration, stroke or seizure. The presence of HNE has been suggested to lead to depletion of cellular glutathione (GSH) levels in both Alzheimer and Parkinson disease brains,18,19 which leads to increased overall oxidative stress and mitochondrial dysfunction. Importantly, mitochondria are major targets of HNE, which has been shown to form adducts with respiratory chain subunits, increase reactive species production, and decrease mitochondrial reserve capacity, all of which contribute to bioenergetic dysfunction.20-22
Damaged mitochondria, which are capable of generating secondary reactive oxygen species and amplifying the initial oxidative insult, are removed by autophagy.23,24 In neurodegenerative diseases, both autophagy25,26 and apoptosis27,28 result from oxidative stress. As autophagy is important in clearing damaged proteins and organelles,29,30 particularly during oxidative stress, changes in autophagic activity can modulate the effects of HNE on cellular bioenergetics and therefore have an impact on cell death. So far, there have been a limited number of studies on how HNE affects autophagy and cell survival, for example in the eye and smooth muscle cells,31,32 but no studies of HNE effects on neuronal autophagy have been reported.
Cellular bioenergetics at the level of the mitochondrion is intimately linked to glucose metabolism through the provision of pyruvate as a substrate for respiration and NADPH for protection against oxidative stress. Importantly, glucose metabolism is altered in stroke and neurodegenerative diseases,33-37 emphasizing the need for understanding the potential link between cellular bioenergetics, autophagy and neuronal viability. In support of this concept, our published studies in differentiated SH-SY5Y neuroblastoma cells have shown that HNE decreases mitochondrial function and glycolysis, and can cause cell death.21,22 This observation prompted us to further investigate how not only glycolysis, but glucose metabolism as a whole, is involved in the cellular response to HNE. Glycolysis is a major metabolic pathway that produces key mitochondrial substrates that feed into the electron transport chain. Furthermore, when mitochondria are dysfunctional, glycolysis provides an alternative energy source to the cell. In addition, glucose metabolism through the pentose phosphate pathway is important for maintenance of cellular antioxidants critical for defense against oxidative stress.38,39 However, very little is known about the link between glucose metabolism, autophagy and cell survival in neurodegenerative diseases.
In this study, we investigated how glucose metabolism plays a role in modulating the cellular response to HNE-induced oxidative stress using 2DG, a competitive substrate of hexokinase, which is a key enzyme that converts glucose to glucose-6-phosphate. We found that 2DG exacerbated HNE-induced apoptosis, by mechanisms involving the inhibition of autophagy and decreasing cellular ATP levels. These data were verified by the use of koningic acid, which inhibits glycolysis (at GAPDH) and autophagy, and enhanced HNE-dependent toxicity. Taken together these data highlight an important role for glycolysis in modulating autophagy and therefore protecting against oxidative stress.
Results
HNE induces MAP1LC3A-II/LC3-II accumulation and CASP3 activation, both of which precede cell death
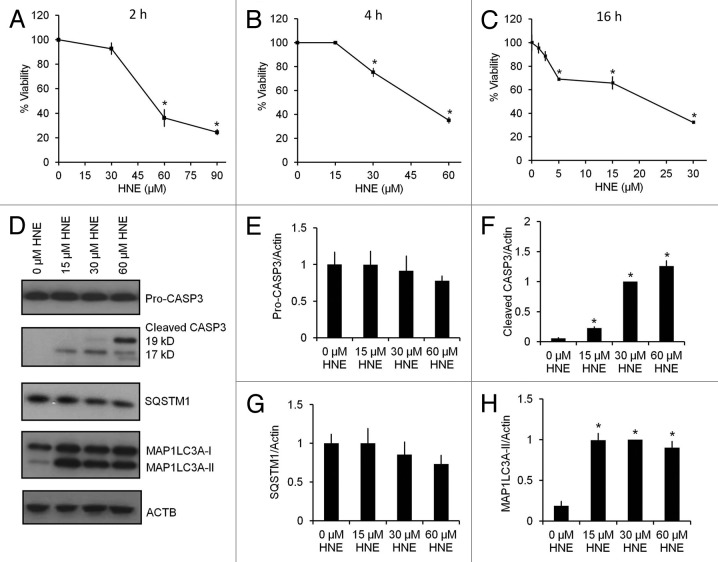
To determine the effects of HNE on cell survival and apoptosis, we differentiated SH-SY5Y human neuroblastoma cells as reported previously.22,40,41 Cells were exposed to 0–90 μM HNE, and cell viability was assessed by the trypan blue exclusion method at 2, 4, and 16 h after HNE exposure. At 2 h, HNE (30 μM) did not decrease cell viability, whereas significant cell death was induced at 60 and 90 μM. Although HNE (30 µM) induced cell death at 4 h, HNE at a lower concentration of 5 μM did not induce cell death until 16 h (Fig. 1A–C). For subsequent experiments a concentration of 30 μM HNE was selected to determine the early responses of the cells to an acute oxidative stress. To determine whether HNE induced apoptosis or autophagy prior to cell death, we measured CASP3 activation by western blot analyses of both pro-CASP3 and the active cleaved fragments (19 kD and 17 kD), at the same time points as we measured MAP1LC3A-II/microtubule-associated protein 1 light chain 3 α-II and SQSTM1/p62 levels (Fig. 1D–H), following 2 h of HNE exposure. While pro-CASP3 levels did not change significantly (Fig. 1E), cleaved CASP3 was increased compared with control in response to 15–60 μM HNE, and maximally at 60 μM HNE (Fig. 1F). The levels of the ubiquitin-binding autophagy substrate SQSTM1 showed no significant changes in response to increasing concentrations of HNE (Fig. 1G). In contrast, MAP1LC3A-II was significantly increased to a similar extent with HNE exposure at 15, 30, and 60 μM (Fig. 1H).
Figure 1. HNE induces caspase activation, MAP1LC3A-II accumulation, and cell death. SH-SY5Y cells were differentiated for 5 d using 10 μM retinoic acid. Cell viability was assessed by the trypan blue exclusion method after exposure to HNE at the indicated concentrations and for the indicated duration. (A) Cell viability after exposure to 0–90 μM HNE for 2 h. (B) Cell viability after exposure to 0–60 μM HNE for 4 h. (C) Cell viability after exposure to 0–30 μM HNE for 16 h. (D) Western blot analyses of protein extracts from cells exposed for 2 h to 0 μM, 15 μM, 30 μM, and 60 μM HNE for pro (32 kD) and cleaved/activated CASP3 (19-kD and 17-kD fragments), as well as SQSTM1, MAP1LC3A-I, and MAP1LC3A-II. ACTB was used as a protein loading control. (E) Quantification of the band intensity of pro-CASP3 (32 kD) from (D), normalized to 0 μM HNE. (F) Quantification of the band intensity of cleaved CASP3 (17-kD + 19-kD fragments) from (D), normalized to 30 μM HNE. (G) Quantification of the band intensity of SQSTM1 from (D), normalized to 0 μM HNE. (H) Quantification of the intensity of MAP1LC3A-II from (D), normalized to 30 μM HNE. Data represent mean ± SEM (n = 3). *P < 0.05 compared with control; the Student t test.
2DG exacerbates HNE-induced caspase activation and cell death and inhibits autophagy
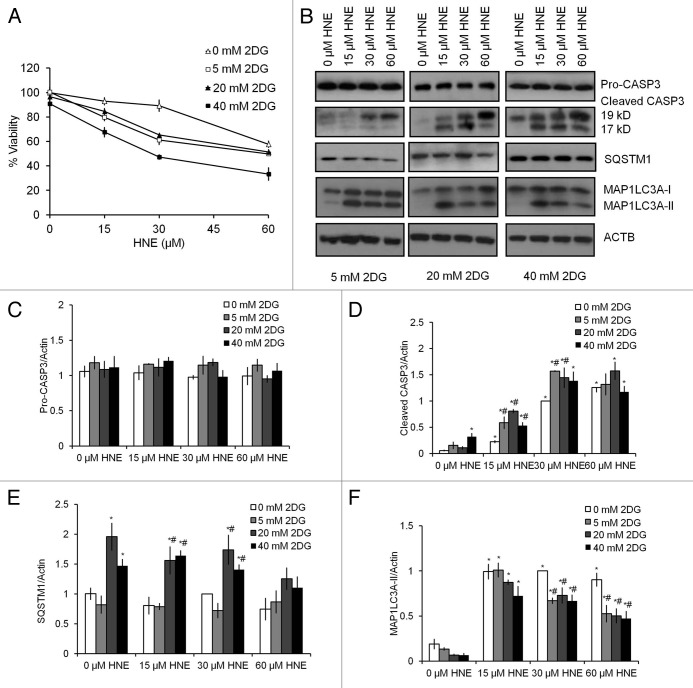
To investigate whether glucose metabolism facilitated cell survival, differentiated SH-SY5Y cells were treated for 24 h with 0–40 mM 2DG, followed by 0–60 μM HNE. 2DG treatment alone at 0–40 mM did not decrease cell survival. In the absence of 2DG, HNE exposure for 2 h at 60 μM resulted in approximately 40% loss of viability. Increasing concentrations of 2DG (5–40 mM) exacerbated HNE toxicity (Fig. 2A). Two-way ANOVA analysis indicated that cell viability was dependent on 2DG concentration (0 mM > 5 mM = 20 mM > 40 mM), and HNE concentration (0 μM > 15 μM > 30 μM > 60 μM). Furthermore, the extent of decreased cell viability in response to HNE was greater at 5–40 mM 2DG compared with at 0 mM 2DG concentrations, supporting an interactive role of HNE and 2DG exposure in promoting cell death.
Figure 2. 2DG exacerbates HNE-induced cell death. SH-SY5Y cells were differentiated for 5 d using 10 μM retinoic acid. Cell viability was assessed by the trypan blue exclusion method after exposure to 2DG at indicated concentrations for 24 h, followed by HNE at the indicated concentrations for 2 h. (A) Cell viability after combined exposure to 2DG and HNE. Viability was normalized to 0 mM 2DG and 0 μM HNE. Data represent mean ± SEM (n = 3). (B) Western blot analyses of protein extracts from cells exposed to 24 h of 0, 20, or 40 mM 2DG, followed by 2 h of 0 μM, 15 μM, 30 μM, and 60 μM HNE for pro (32 kD) and cleaved/activated CASP3 (19-kD and 17-kD fragments), as well as SQSTM1, MAP1LC3A-I, and MAP1LC3A-II. ACTB was used as a protein loading control. (C) Quantification of the band intensity of pro CASP3 (32 kD) from (B). (D) Quantification of the band intensity of cleaved CASP3 (17-kD + 19-kD fragments) from (B). (E) Quantification of the band intensity of SQSTM1 from (B). (F) Quantification of the intensity of MAP1LC3A-II from (B). Data represent mean ± SEM (n = 3), normalized to 0 mM 2DG + 30 μM HNE. *P < 0.05 compared with 0 mM 2DG + 0 μM HNE; #P < 0.05 compared with 0 mM 2DG at the same dose of HNE; the Student t test.
Next, we assessed whether 2DG affected HNE-dependent CASP3 activation. As shown in Figure 1D–F, HNE at 15–60 μM for 2 h induced CASP3 activation. We found that while 5 and 20 mM 2DG alone did not induce CASP3 activation, 40 mM 2DG alone induced CASP3 activation (Fig. 2B–D). When cotreated with 15 μM or 30 μM HNE, 2DG at 5–20 mM further increased CASP3 activation (Fig. 2B–D; Fig. 3A and B). Since the 40 mM concentration of 2DG alone increased CASP3 activation, 20 mM 2DG was selected in subsequent studies for investigating the interactive mechanisms of 2DG and HNE.
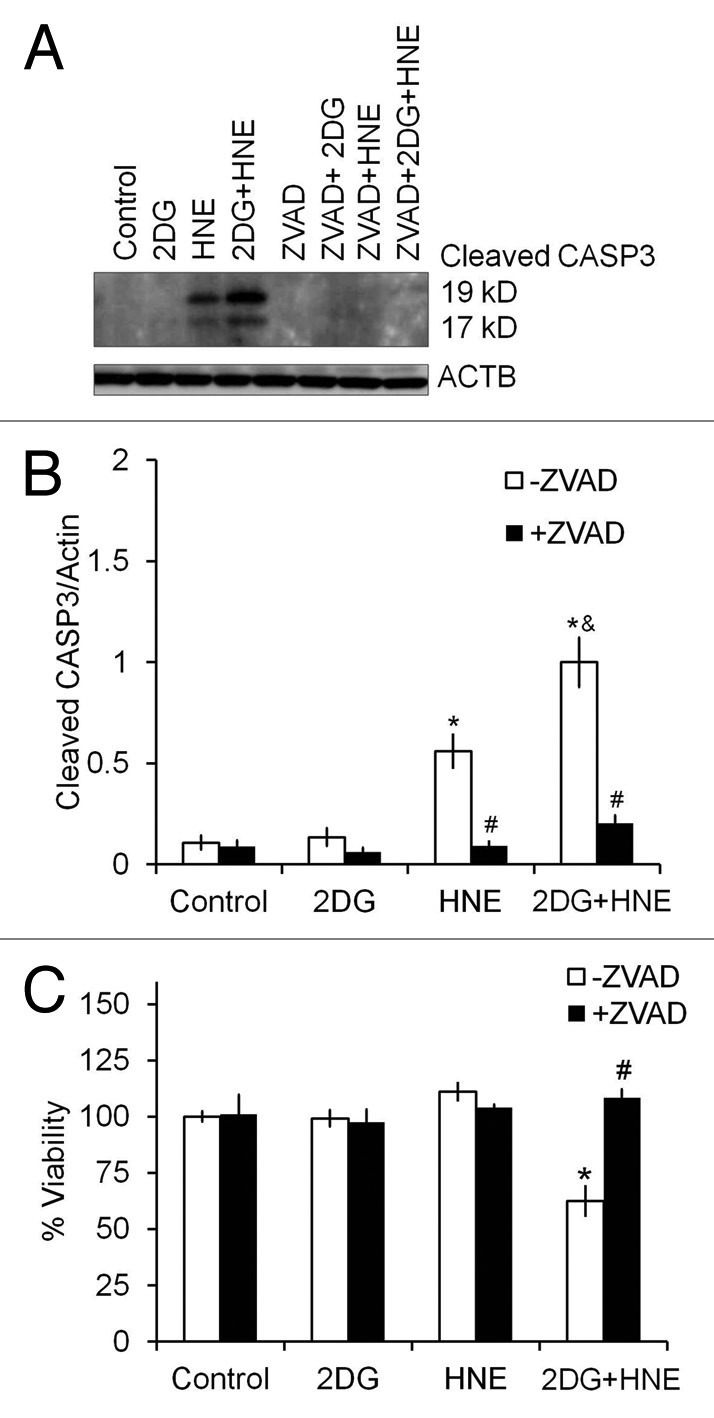
Figure 3. Z-VAD-fmk inhibits caspase activation and cell death. Differentiated SH-SY5Y cells were treated with 20 mM 2DG for 24 h, followed by 30 μM HNE for 2 h in the presence or absence of 10 μM Z-VAD-fmk. (A) Western blot analyses of cleaved/activated CASP33(19-kD and 17-kD fragments), using an anti-active CASP3 antibody, for protein extracts from cells exposed to 2DG, HNE, or 2DG and HNE, in the presence or absence of 10 μM Z-VAD-fmk. ACTB was used as a protein loading control. (B) Quantification of the 19-kD and 17-kD CASP3 fragments from (A). Data represent mean ± SEM (n = 3), normalized to the 2DG + HNE lane. (C) Cell viability after exposure to 2DG and HNE in the presence or absence of Z-VAD-fmk. Cell viability was assessed by trypan blue exclusion method. Data represent mean ± SEM (n = 3), *P < 0.05 compared with control; #P < 0.05 compared with - Z-VAD-fmk, &P < 0.05 compared with HNE, the Student t test.
Interestingly, while not toxic in differentiated SH-SY5Y cells, 20 mM 2DG alone caused substantial cell death in human embryonic kidney HEK293 cells, mouse RAW macrophages, mouse embryonic fibroblasts, and rat primary cortical neurons (Fig. S1A–S1D). HEK293 cells in our experiments were the most sensitive to HNE toxicity (Fig. S1C). Almost complete cell death was observed in response to 2DG in RAW and HEK293 cells (Fig. S1A and S1C). In both mouse embryonic fibroblasts and rat primary cortical neurons, the combined treatment of HNE and 2DG caused more increased cell death than HNE or 2DG alone, as we observed in differentiated SH-SY5Y cells (Fig. S1B and S1D).
To determine if inhibition of caspase activation could attenuate cell death, we treated cells with 2DG for 24 h followed by HNE for 2 h in the presence or absence of the pan-caspase inhibitor Z-VAD-FMK. We found that Z-VAD-FMK significantly attenuated caspase activation (Fig. 3A and B), as well as cell death (Fig. 3C), suggesting that HNE-2DG toxicity is mediated by an apoptotic process.
2DG decreases autophagy
We next examined potential mechanisms through which 2DG enhances SH-SY5Y cell death in the presence of HNE. We found that SQSTM1 levels were significantly increased with 20–40 mM 2DG compared with control (Fig. 2B and E; Fig 4C and D). In contrast, 2DG alone for 24 h at 5–40 mM did not significantly increase the levels of MAP1LC3A-II. HNE exposure (15–60 µM) resulted in higher MAP1LC3A-II levels compared with untreated controls (Fig. 2B and F). Moreover, the increase in MAP1LC3A-II in response to 30–60 µM HNE was significantly decreased by 5–40 mM 2DG (Fig. 2B and F).
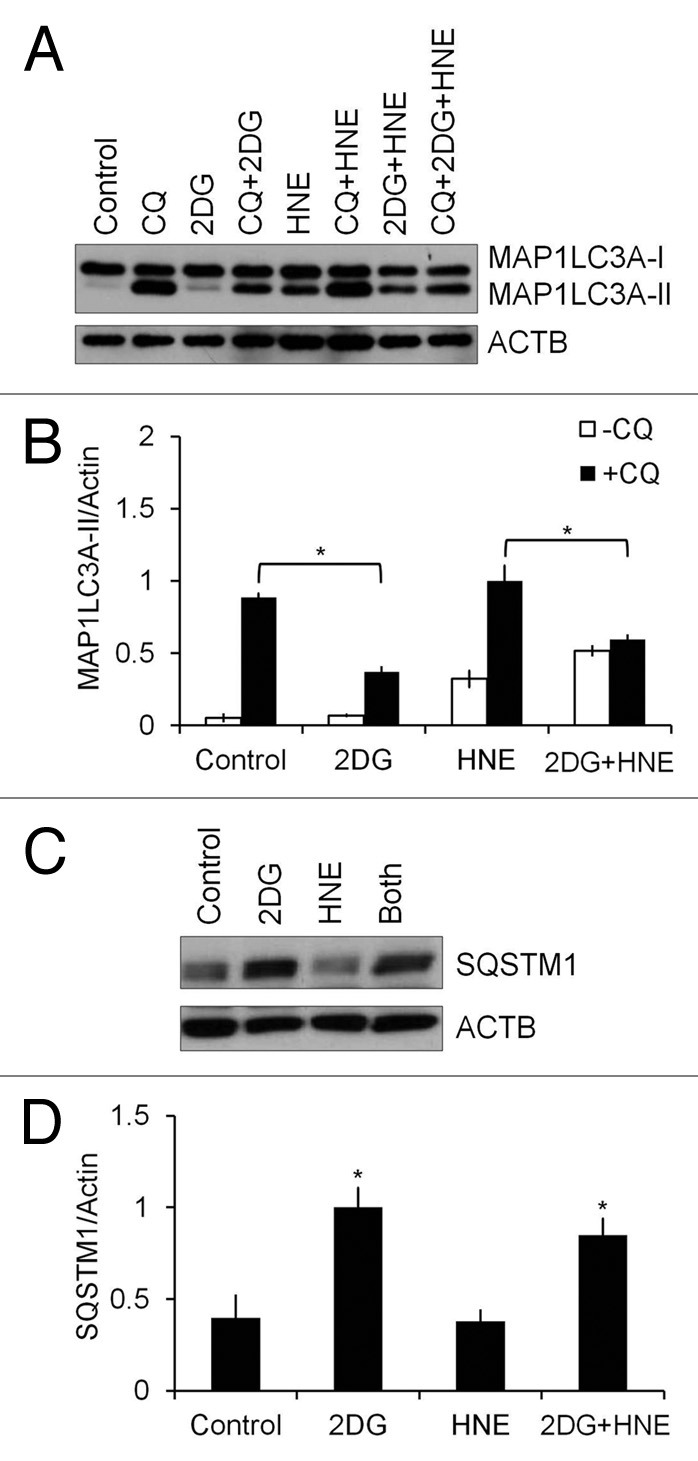
Figure 4. 2DG inhibits autophagic flux. Differentiated SH-SY5Y cells were treated with 20 mM 2DG for 24 h, followed by 30 μM HNE in the presence or absence of 40 μM chloroquine (CQ) for 2 h. (A) Western blot analyses of protein extracts from control or 2DG- and HNE-treated cells in the presence or absence of 40 μM CQ for MAP1LC3A-I and MAP1LC3A-II. (B) Quantification of MAP1LC3A-II from (A). Data represent mean ± SEM (n = 3), normalized to HNE+CQ. *P < 0.05, the Student t test. (C) Western blot analyses of protein extracts from control or 2DG- and HNE-treated cells for SQSTM1. (D) Quantification of SQSTM1 from (C). Data represent mean ± SEM (n = 3), normalized to 2DG. *P < 0.05, the Student t test.
Autophagic flux analyses in the presence and absence of 40 μM chloroquine (CQ), an inhibitor of autophagosome-lysosome fusion, was performed next. After exposure to 20 mM 2DG for 24 h, the levels of MAP1LC3A-II were significantly lower in 2DG+CQ cells compared with CQ alone, and lower in the combined 2DG+HNE+CQ treatment, compared with HNE+CQ (Fig. 4A and B). Furthermore, 2DG increased levels of SQSTM1, compared with control, consistent with an attenuation of autophagic flux (Fig. 4C and D). At nonsaturating concentrations of CQ (2.5 and 5 μM) (Fig. S2), 2DG+CQ also decreased MAP1LC3A-II levels compared with CQ alone. MAP1LC3A-II levels in cells treated with HNE+CQ (2.5 or 5 μM) were higher than cells treated with CQ alone. The levels of SQSTM1 were consistently higher in cells treated with 2DG, both in the absence and presence of CQ, but not significantly different in HNE-treated cells (Fig. S2). To examine whether 2DG suppresses autophagy in primary neurons, we performed autophagic flux analyses with 20 mM 2DG for 24 h, followed by 30 μM HNE in the absence and presence of 10 nM bafilomycin A1 for 2 h in rat primary cortical neurons (Fig. S3). We found that similar to differentiated SH-SY5Y cells, primary neurons also exhibited an increase of MAP1LC3A-II in response to HNE and decreased autophagic flux in response to 2DG (Fig. S3).
Interestingly, incubating the cells in glucose-free medium did not produce the same effects as 2DG, with no enhancement of the toxicity of HNE detected (Fig. 5A). We performed the same autophagic flux analyses as in Figure 4A and B; however, compared with 2DG treatment, cells in glucose-free medium had a higher basal autophagic flux consistent with a starvation condition (Fig. 5B–D). This higher level of autophagy was associated with no detectable HNE toxicity, consistent with the hypothesis that autophagy protects against HNE-dependent toxicity.
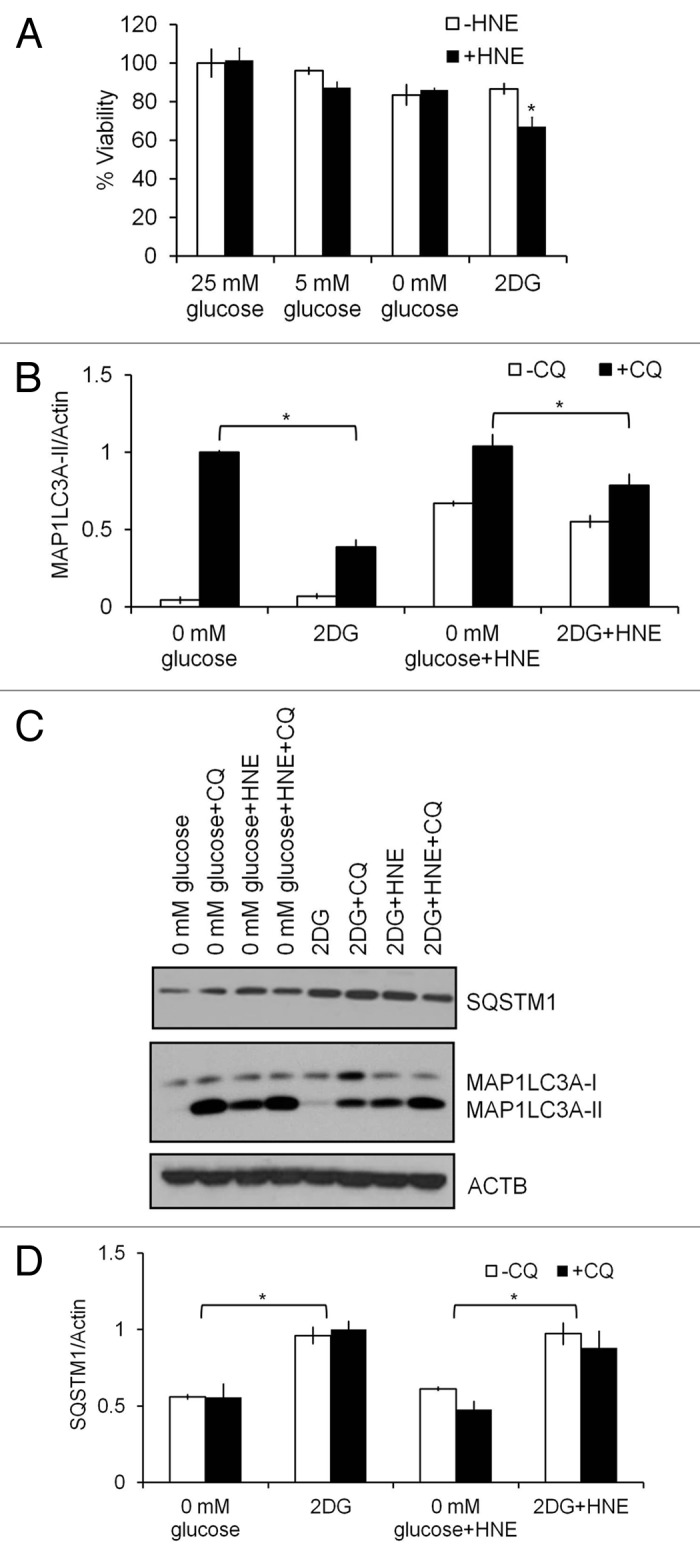
Figure 5. Glucose deprivation does not alter HNE-induced cell death. Differentiated SH-SY5Y cells were cultured in medium with 25 mM, 5 mM or 0 mM glucose, or 20 mM 2DG, for 24 h, followed by 30 μM HNE in the presence or absence of 40 μM CQ for 2 h. (A) Comparison of cell viability in response to lower glucose concentration vs. 20 mM 2DG for 24 h, followed by 30 μM HNE for 2 h. (B) Western blot analyses of protein extracts from cells treated with glucose-free medium or 2DG for SQSTM1, MAP1LC3A-I, and MAP1LC3A-II. ACTB was used as a protein loading control. (C) Quantification of MAP1LC3A-II from (B). Data represent mean ± SEM (n = 3), normalized to 0 mM glucose+CQ. *P < 0.05, the Student t test. (D) Quantification of SQSTM1 from (B). Data represent mean ± SEM (n = 3), normalized to 2DG. *P < 0.05, the Student t test.
Autophagy is protective against cell death
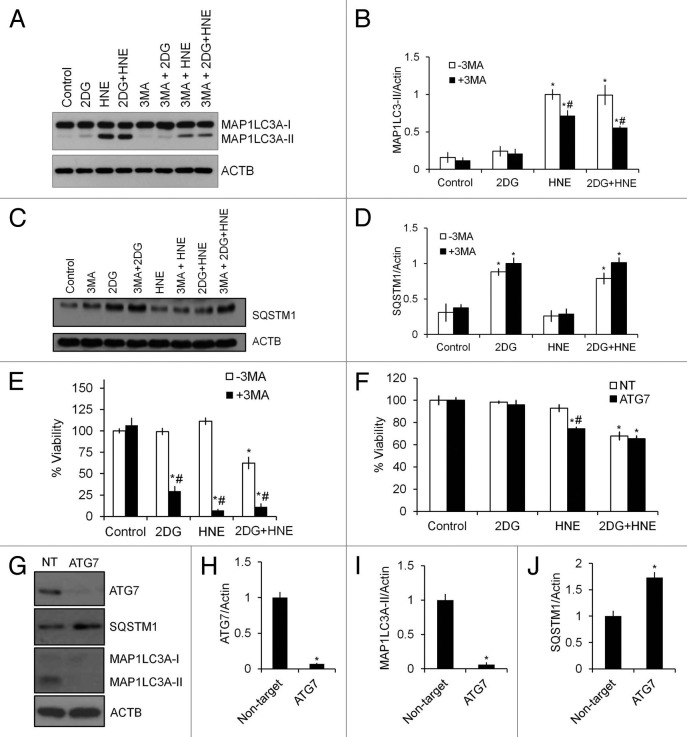
To determine whether autophagy is protective against cell death in cells exposed to 2DG and HNE, we treated cells with 3-methyladenine (3-MA), an inhibitor of the class III phosphatidylinositol 3-kinase (PtdIns3K), at the same time as cells were exposed to HNE. 3-MA significantly decreased the HNE-induction of MAP1LC3A-II (Fig. 6A and B), and had no effect on SQSTM1 levels (Fig. 6C and D). As we predicted, cell survival was significantly decreased by 3-MA treatment in response to both 2DG and HNE (Fig. 6E), indicating a protective role of autophagy against stress-induced cell death. As an additional test of the protective role of autophagy against HNE-induced cell death, we transfected cells with ATG7/autophagy related 7 siRNA and examined its effect on autophagy and HNE-induced cell death. As shown in Figure 6G–J, ATG7 and MAP1LC3A were decreased approximately 95% after 48 h, and SQSTM1 was increased. Compared with 3-MA, ATG7 siRNA did not enhance toxicity in the presence of 2DG, suggesting 3-MA may have additional effects other than simple inhibition of autophagy. Importantly, under these conditions, cells were afterward more sensitive to HNE-induced cell death, albeit to a lesser extent than 3-MA, compared with cells transfected with non-targeting siRNA (Fig. 6F).
Figure 6. Inhibition of autophagy by 3-MA or siRNA of ATG7 exacerbates cell death in response to 2DG or HNE. Differentiated SH-SY5Y cells were treated with 20 mM 2DG for 24 h, followed by 30 μM HNE for 2 h in the presence or absence of 10 mM 3-MA. (A) Western blot analyses of protein extracts from control or 2DG- and HNE-treated cells in the presence or absence of 3-MA for MAP1LC3A-I and MAP1LC3A-II. ACTB was used as a protein loading control. (B) Quantification of MAP1LC3A-II from (A). Data = mean ± SEM (n = 3), normalized to HNE. *P < 0.05 compared with control, #P < 0.05 compared with -3MA, the Student t test. (C) Western blot analyses of protein extracts from control or 2DG- and HNE-treated cells in the presence or absence of 3-MA for SQSTM1. ACTB was used as a protein loading control. (D) Quantification of SQSTM1 from (C). Data = mean ± SEM (n = 3), normalized to 2DG+3MA. *P < 0.05, the Student t test. (E) Cell viability following 2DG and HNE exposure in the presence or absence of 3-MA. Cell viability was measured by the Trypan Blue exclusion method. Data = mean ± SEM (n = 3), normalized to control. *P < 0.05 compared with control; #P < 0.05 compared with -3MA. The Student t test. (F–J) Differentiated SH-SY5Y cells were transfected with 750 nM non-targeting (NT) or ATG7 siRNA, allowed to recover for 48 h, then treated with 20 mM 2DG for 24 h, followed by 30 μM HNE for 2 h. (F) Cell viability following ATG7 knockdown and exposure to 2DG and HNE. Cell viability was measured by the Trypan Blue exclusion method. Data were normalized to control. *P < 0.05 compared with control; #P < 0.05 compared with NT. The Student t test. (G) Western blot analyses of protein extracts from cells transfected with nontargeting siRNA (NT) or ATG7 siRNA (ATG7) for ATG7, MAP1LC3A-I, MAP1LC3A-II, and SQSTM1. ACTB/β-actin was used as a protein loading control. (H) Quantification of ATG7 from (G). (I) Quantification of MAP1LC3A-II from (G). (J) Quantification of SQSTM1 from (G). Data = mean ± SEM (n = 3), normalized to the nontarget control. *P < 0.05 compared with NT. The Student t test.
Effect of 2DG and HNE on other autophagy proteins, ATP, and glutathione
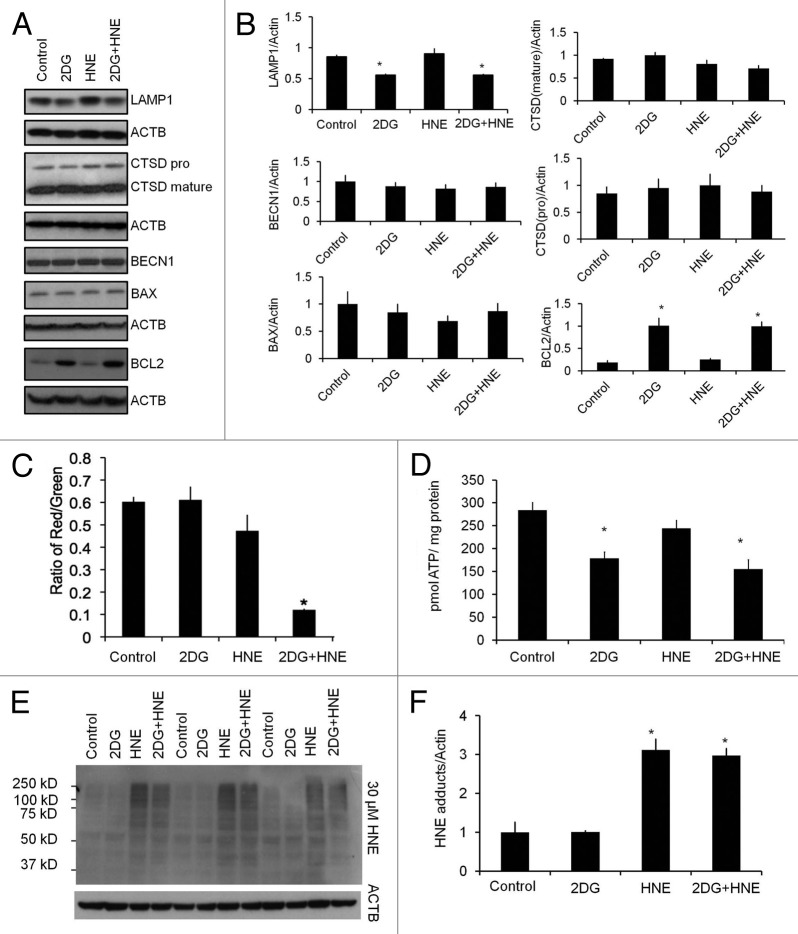
To further dissect the mechanisms by which 2DG inhibits autophagy and exacerbates HNE-induced cell death, we examined the levels of other autophagy proteins including, LAMP1/lysosomal-associated membrane protein 1, CTSD/cathepsin D, a lysosomal protease, BECN1/Beclin 1, an autophagy-initiation protein, BCL2/B-cell CLL/lymphoma 2, and BAX/BCL2-associated X protein, a pro-apoptotic protein. Interestingly, we found that LAMP1 was decreased, and that BCL2 was increased, as a result of 2DG treatment, but CTSD, BECN1, and BAX levels were all unchanged (Fig. 7A and B). A more systematic evaluation of changes in all autophagy-lysosomal pathway proteins will need to be performed in future studies. In terms of cellular bioenergetics, we have previously shown that HNE decreases mitochondrial function in differentiated SH-SY5Y cells.22 In this study, we found that neither 2DG nor HNE significantly changed mitochondrial membrane potential; however, the combined treatment significantly decreased the membrane potential, consistent with a decrease in cell survival (Fig. 7C). Cellular ATP levels were decreased by 2DG, but not by HNE (Fig. 7D), indicating that HNE-exposed cells still had sufficient ATP to meet the energy demands. Consistent with previous studies,31,42 HNE exposure in SH-SY5Y cells also significantly increased HNE-protein adducts in the cell, whereas 2DG did not significantly change the overall levels of HNE-induced protein aggregation, indicating that the metabolism of HNE was not significantly altered by 2DG treatment (Fig. 7E and F).
Figure 7. Effects of 2DG on other selective autophagy proteins, mitochondrial membrane potential, cellular ATP, and HNE-protein adducts. Differentiated SH-SY5Y cells were treated with 20 mM 2DG for 24 h, followed by 30 μM HNE. (A) Western blot analyses of BECN1, BCL2, BAX, CTSD, and LAMP1 following exposure to 2DG and HNE. ACTB was used as a protein loading control. (B) Quantification of autophagy proteins in (A). Data = mean ± SEM (n = 3), normalized to lane with highest signal. (C) Mitochondrial membrane potential was measured using the JC-1 membrane potential assay. Red to green fluorescence ratio was calculated. Data = mean ± SEM (n = 8). (D) ATP levels were measured as described in Materials and Methods. Data were normalized to protein (mg). Data = mean ± SEM (n = 3). (E) Western blot analyses of protein extracts following exposure to 2DG and HNE for HNE-protein adducts. (F) Quantification of (E). Data = mean ± SEM (n = 3), normalized to control. *P < 0.05, the Student t test.
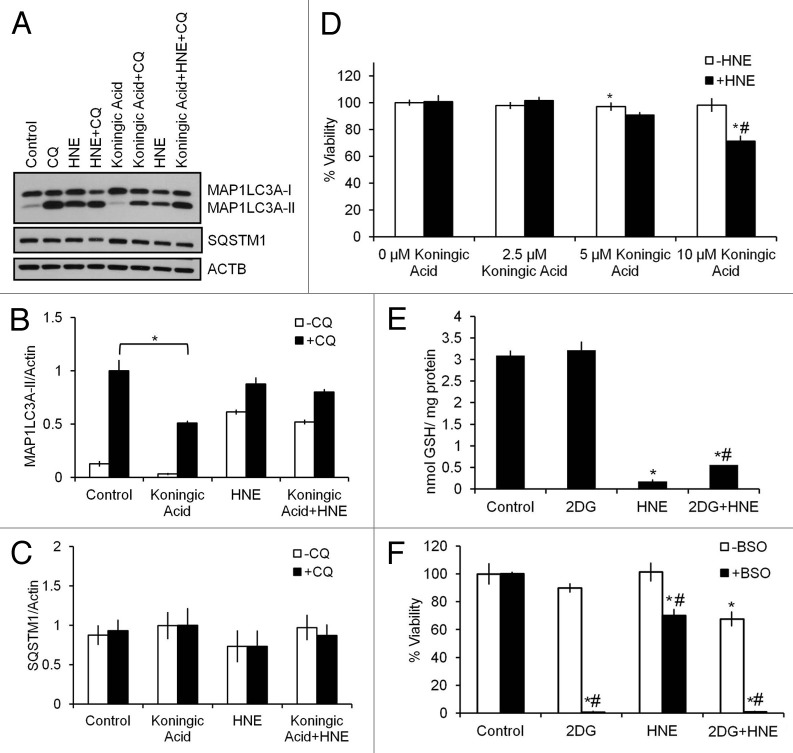
2DG decreases glycolysis in differentiated SH-SY5Y cells as we have published previously.21,22 However, the mechanisms of 2DG action may not be restricted to inhibition of glycolysis. For example, 2DG has also been reported to cause ER stress and alter autophagy.43,44 In addition, the pentose phosphate pathway is also downstream of glucose-6-phosphate and potentially could be affected by 2DG exposure. Prior studies have shown that 2DG does not inhibit the first step of the pentose phosphate pathway in breast cancer cells, and that inhibition of glutamate cysteine ligase activity sensitizes 2DG toxicity.45 Under certain conditions it has been reported that 2DG could also rescue cells from oxidative stress-induced cell death.45-47 However, whether 2DG effects in differentiated SH-SY5Y cells were mediated by inhibition of glycolysis, alteration of the pentose phosphate pathway and glutathione production, or attenuating glycosylation and inducing ER stress is unknown. As an alternative approach to determine if inhibition of glycolysis can alter autophagy and exacerbate HNE-induced cell death, we used a GAPDH/glyceraldehydes-3-phosphate dehydrogenase inhibitor, koningic acid (KA), to treat the differentiated SH-SY5Y cells 30 min before exposure to HNE. We found that KA at 10 μM also significantly decreased autophagic flux (Fig. 8A and B), as was found with 2DG treatment. In contrast to the 24 h exposure to 2DG or ATG7 siRNA treatment, KA treatment did not increase levels of SQSTM1, an effect similar to 3-MA treatment (Fig. 8C). The lack of effect on SQSTM1 may reflect the shorter time course for this experiment. As found with 2DG, KA at 10 μM significantly sensitized the cells to cell death in response to HNE, again supporting a key role of glycolysis in HNE-dependent toxicity (Fig. 8D).
Figure 8. Inhibition of glycolysis or glutathione synthesis exacerbates HNE-induced cell death. Differentiated SH-SY5Y cells were treated 30 μM HNE for 2 h in the presence or absence of 10 μM of the GAPDH inhibitor koningic acid (KA) or 1 mM of the glutathione synthesis inhibitor L-buthionine sulfoximine (BSO). (A) Western blot analyses of protein extracts following exposure to KA and HNE for SQSTM1, MAP1LC3A-I, and MAP1LC3A-II. ACTB was used as a protein loading control. (B) Quantification of MAP1LC3A-II from (A). Data = mean ± SEM (n = 3), normalized to CQ. *P < 0.05 compared with control; the Student t test. (C) Quantification of SQSTM1 from (A). Data = mean ± SEM (n = 3), normalized to KA+CQ. (D) Cell viability following exposure to increasing concentrations of KA and 30 μM HNE. Data = mean ± SEM (n = 3), normalized to 0 μM KA. *P < 0.05 compared with control; #P < 0.05 compared with –HNE; the Student t test. (E) Glutathione levels were measured as described in Materials and Methods. Data were normalized to protein (mg). Data = mean ± SEM (n = 3). (F) Cell viability following exposure to 2DG and HNE in the presence or absence of BSO. Data = mean ± SEM (n = 3), normalized to control. *P < 0.05 compared with control; #P < 0.05 compared with –BSO; the Student t test.
To determine if 2DG alters glutathione synthesis in differentiated SH-SY5Y cells, we measured glutathione levels in cells exposed to 2DG and/or HNE. We found that while HNE depleted glutathione, 2DG had no effect on glutathione levels (Fig. 8E). As a positive control cells were exposed to 1 mM L-buthionine sulfoximine (BSO) for 24 h, an inhibitor of the glutamyl cysteine ligase, and cell death was significantly increased when combined with either 2DG or HNE (Fig. 8F). To determine whether 2DG induced ER stress due to blockade of glucose availability, we assessed HSAP5/heat shock 70kDa protein 5 (glucose-regulated protein, 78kDa) levels as a marker for ER stress. We found that 2DG did not change HSPA5 levels. In addition, treating cells with D-mannose, which attenuates inhibition of glycosylation,43 did not change the autophagic response or cell viability in response to 2DG and HNE treatment, suggesting a minor role for ER stress in the 2DG effect on differentiated SH-SY5Y cells (Fig. S4).
Discussion
Mitochondria are both a source and target of oxidative stress. Autophagy plays an important role in removing damaged mitochondria, thereby preventing a further deterioration in the quality of the mitochondrial population.29,30 Defects in autophagy or mitochondrial quality control pathways contribute to neurodegeneration.48-50 How autophagy is regulated in response to various forms of oxidative stress in different cell types is still unclear. Using an endogenously generated lipid peroxidation product, HNE, which accumulates in stroke, Alzheimer, and Parkinson disease brains, we investigated the mechanisms of HNE toxicity in differentiated human dopaminergic, acetylcholinergic, glutamatergic, and adenosinergic SH-SY5Y neuroblastoma cells. We found that HNE induced autophagy and apoptosis in a concentration-dependent and time-dependent manner. 2DG, a competitive substrate of hexokinase, which is a key enzyme in glucose metabolism, decreased cellular ATP and suppressed autophagic flux as indicated by decreased formation of MAP1LC3A-II and increased SQSTM1. 2DG combined with HNE induced loss of mitochondrial membrane potential, further increased CASP3 cleavage and apoptotic cell death. Both caspase activation and cell death could be reversed by the pan-caspase inhibitor Z-VAD. Inhibition of autophagy by 3-MA or siRNA of ATG7 significantly decreased cell viability in 2DG- or HNE-exposed cells. Furthermore, we found that HNE significantly decreased cellular glutathione without changing cellular ATP. In contrast, 2DG significantly decreased ATP without changing cellular glutathione. 2DG also induces complex changes in autophagy-lysosomal, and apoptosis pathway protein levels. The glycolytic inhibitor koningic acid, which acts to inhibit glycolysis through a different mechanism, also inhibited autophagic flux and exacerbated HNE-induced cell death, as found with 2DG. The glutathione synthesis inhibitor BSO exacerbated cell death in response to both 2DG and HNE, with more cell death when combined with 2DG than with HNE.
Our finding that HNE induced the highest MAP1LC3A-II at 15–30 μM, while causing the highest caspase activation at 30–60 μM, suggests that autophagy is more sensitive to HNE exposure and could be an earlier response than apoptosis (Fig. 1). SQSTM1 did not change during these experimental paradigms. One likely interpretation is that SQSTM1 degradation through autophagy depends on prolonged alteration of autophagy, more than the 2 h time point used in our experiments. Furthermore, at this time point and HNE dose, cell death is completely attenuated by the caspase inhibitor Z-VAD, suggesting that cells did not die as a result of necrosis in response to decreased ATP (Fig. 3).
Deprivation of essential amino acids or growth factors regulates autophagy.51 2DG competes with glucose for hexokinase, preventing proper utilization of glucose, depleting cellular ATP levels. In our experiments, 2DG at 5–40 mM did not change basal levels of MAP1LC3A-II. However, measurement of autophagic flux revealed that autophagy is attenuated at 20 mM 2DG, as evidenced by the autophagic flux assay (Figs. 2–4). Associated with attenuated autophagy, 2DG decreased the levels of LAMP1 and increased the level of BCL2 (Fig. 7). This raises the possibility that the increased BCL2 leads to formation of more BCL2-BECN1 complex and results in less BECN1 participation in autophagy, or the decreased LAMP1 indicates a decrease in lysosomal number and function. We found that the SQSTM1 levels accumulate with inhibition of autophagy by 2DG and ATG7 siRNA, but do not change with 3-MA, or koningic acid treatment. As mentioned above for HNE, this may be due to the fact that cells were incubated with 2DG for 24 h and ATG7 siRNA for 48 h, thus allowing sufficient time for SQSTM1 to accumulate. In contrast, cells were incubated with HNE, 3-MA, or koningic acid for 2–2.5 h, which may not be sufficient time to observe changes in SQSTM1. Autophagy is protective against cell death induced by HNE as evidenced by both 3-MA and siRNA of ATG7 (Fig. 6). However, 3-MA also decreased cell survival in response to 2DG. This may be due either to 3-MA targeting of other metabolic and cell survival pathways,52,53 or to ATG7- or MAP1LC3A-independent cytoprotective autophagy mechanisms that function in the absence of ATG7 activity.54
We previously reported that 2DG and HNE decrease glycolysis, as well as mitochondrial function and mitochondrial reserve capacity.21,22 Here we found that 2DG significantly decreased cellular ATP, whereas HNE did not (Fig. 7). This may be due to a decreased consumption of cellular ATP in response to HNE-induced stress, or a reflection of a cellular reserve of ATP, which is only marginally affected in the short time frame of the HNE exposure.
The impact of 2DG on cellular metabolic status is clearly different from that of glucose deprivation in several important respects. First, in contrast to glucose deprivation, 2DG does not inhibit the first step of the pentose phosphate pathway, and thus may not further decrease glutathione. Second, 2DG is a hexokinase substrate and depletes two molecules of cellular ATP when converted to 2-deoxyglucose-6-phosphate by hexokinase. Third, hexokinase is localized both in the cytosol and the mitochondrion and interacts with other cellular components suggesting other potential regulatory mechanisms beyond the flux of glucose. Importantly, the 2DG interaction with hexokinase may affect the interactions of this critical enzyme within the cell, particularly the mitochondrion. Studies from other investigators have found that under certain conditions, 2DG rescues cells from oxidative stress-induced cell death;55,56 and that 2DG does not inhibit the first step of the pentose phosphate pathway, but rather requires co-inhibition of glutamate cysteine ligase activity to sensitize human breast cancer cells to the toxicity of 2DG exposure, which we also found in the present study.45 The additive effects of 2DG and HNE also appear not to be due to further decreasing glutathione, since 2DG did not affect glutathione on its own, and slightly attenuated glutathione depletion in response to HNE (Fig. 8), consistent with evidence that 2DG does not inhibit the first step of the pentose phosphate pathway.45 Furthermore, supporting the distinct effects of 2DG and glucose deprivation on cell survival, we found that 2DG has more significant effects on autophagy and HNE-induced cell death compared with glucose deprivation (Fig. 5). Furthermore, in our studies, ER stress did not appear to play an important role in mediating effects of 2DG (Fig. S4).
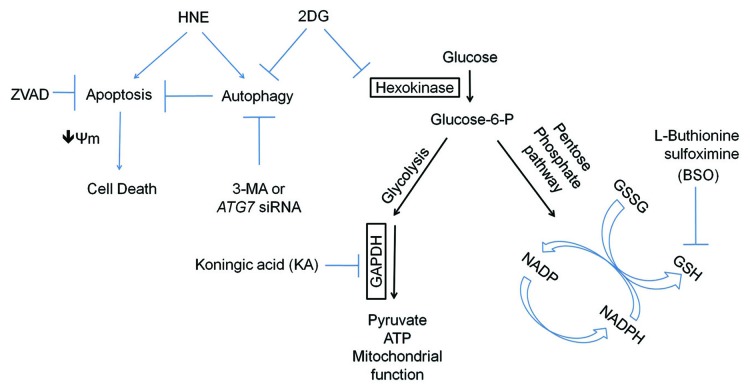
Overall, our findings demonstrate a clear modulatory role of glycolysis on autophagy and cellular susceptibility to oxidative stress (Fig. 9). Although both HNE and 2DG affect mitochondrial function, their impact on cellular glutathione, ATP, caspase activation and autophagy are distinct (Fig. 9). HNE depletes glutathione, without depleting ATP, whereas 2DG did not affect glutathione, but decreased ATP. Downstream inhibition of glycolysis using koningic acid, glutathione synthesis using BSO, or autophagy using 3-MA or ATG7 siRNA, all exacerbate HNE-induced cell death. Cell death appears to be a result of apoptosis, and not necrosis, as the inhibition of apoptosis attenuated cell death. Attenuation of autophagy by 2DG is not related to HNE-protein adduct formation as shown in Figure 7, and apparently not related to glycosylation (Fig. S4). In contrast, our evidence supports the interpretation that inhibition of glycolysis provides a mechanism through which 2DG exerts its effects since the GAPDH inhibitor koningic acid had similar effects on autophagy as 2DG. Future studies in identifying detailed molecular signaling mechanisms regarding how glycolysis regulates the cellular response to oxidative stress and autophagy will be important to aid the development of better therapeutic interventions to treat degenerative diseases.
Figure 9. Working model. HNE activates both autophagy and apoptosis as indicated by increased MAP1LC3A-II formation and CASP3 cleavage. 2DG suppresses both basal and HNE-induced autophagy, resulting in increased SQSTM1, and decreased MAP1LC3A-II in the presence of the autophagy flux inhibitor chloroquine (CQ). Combined treatment with 2DG and HNE results in decreased mitochondrial membrane potential, increased CASP3 cleavage, and cell death. Cell death is attenuated by blocking caspase activation with Z-VAD-FMK, and enhanced by blocking autophagy with 3-MA or siRNA knockdown of ATG7. In addition to an effect on autophagy, 2DG also decreases cellular ATP, while having negligible effects on ER stress, basal glutathione levels, or HNE-induced glutathione depletion, as assessed by HSPA5 and glutathione level determination. Inhibition of glycolysis by koningic acid (KA) exacerbates HNE-induced cell death, while inhibition of glutathione synthesis by buthionine sulfoximine (BSO) exacerbates 2DG- or HNE-induced cell death.
Materials and Methods
Materials
4-hydroxynonenal (HNE) (393204) and Z-VAD-FMK (627610) were obtained from Calbiochem. All-trans-retinoic acid (AC207341000) and diethylene triamine pentaacetic acid (DTPA) (67-43-6) were obtained from Acros Organics/Fisher. D-Mannose (G5500), L-buthionine sulfoximine (BSO) (B2515), L-glutathione (reduced) (G4251), chloroquine (C6628), 3-methyladenine (3-MA) (M9281), carbonyl cyanide p-[trifluoromethoxy]-phenyl-hydrazone (FCCP) (C2920), and 2-deoxyglucose (2DG) (D8375) were obtained from Sigma. Dulbecco’s modified Eagle’s medium (DMEM) (12800-017), neurobasal medium (21103-049), B-27 supplement (17504044-044), L-glutamine (25030-081) and penicillin-streptomycin (15140-122) were obtained from Life Technologies. Trypan blue solution (25-900-CI) was obtained from CellGro. Fetal bovine serum (FBS) (S11050H) was obtained from Atlanta Biologicals. Koningic acid (KA) (57710-57-3) was obtained from TMS Co. Ltd. ATG7 siRNA (M-020112-01-0005) and non-targeting control siRNA (D-001206-13-05) were obtained from DharmaCon (Thermo Scientific).
Cell culture
We cultured and used early passage (P11-P17) human neuroblastoma SH-SY5Y cells grown in DMEM supplemented with 10% FBS, 2 mM glutamine, and 1% penicillin-streptomycin. Differentiation was induced by the addition of 10 µM all-trans retinoic acid on day 1, 24 h after plating, and continued for 5 d.22,40,41 On day 4, complete media containing retinoic acid was replaced with media containing retinoic acid and 1% FBS. All treatments began on day 6. Human embryonic kidney cells, mouse RAW macrophages, and mouse embryonic fibroblasts were all grown in DMEM supplemented with 10% FBS, 2 mM glutamine, and 1% penicillin-streptomycin. Cells were allowed to grow for 24 h, with treatments beginning on day 1. Primary cortical neurons were cultured in neurobasal medium containing 2% B-27 supplement, 1% penicillin-streptomycin and 0.5 mM L-glutamine, from embryonic day 18 (E18) rat embryos. All experiments used 7 d in vitro cultures. All animal procedures were approved by the UAB institutional IACUC.
Assessment of cell viability
Cell viability was determined using the trypan blue exclusion method. Differentiated SH-SY5Y cells, human embryonic kidney cells, mouse RAW macrophages and mouse embryonic fibroblasts were grown in 12-well cell culture plates, and, following treatment, trypsinized and resuspended in DMEM supplemented with 1% FBS. Primary cortical neurons were grown in Seahorse XF 24-well plates (Seahorse Biosciences, 100777-004), and, following treatment, trypsinized and resuspended in neurobasal medium. Trypan blue was added, and the cells nonpermeable to trypan blue were counted as viable.
Western blot analysis
Protein lysates were separated by SDS-PAGE and probed with the following antibodies: SQSTM1/p62 (Abnova, H00008878-M01), BCL2/B-cell CLL/lymphoma 2 (Santa Cruz, sc-492), BECN1/Beclin 1 (Santa Cruz, sc-11427), pro-CASP3/caspase 3 (Santa Cruz, sc-7148), cleaved CASP3/caspase 3 (Cell Signaling, 9661), BAX/BCL2-associated X protein (Santa Cruz, sc-526), LAMP1/Lysosomal-associated membrane protein 1 (Developmental Studies, H4A3), HSPA5/GRP78 (Santa Cruz, sc-1050), ATG7 (Abcam, ab133528), microtubule-associated protein 1 light chain 3 α/LC3A (Sigma, L8918), ACTB/β-actin (Sigma, A5441), and CTSD/cathepsin D (Santa Cruz, sc-6486). Relative levels of protein to ACTB loading control were quantified by densitometry using ImageJ, and normalized to the lane with the highest signal.
ATP luminescence assay
Differentiated SH-SY5Y cells were grown in 96-well cell culture plates. After treatment, cells were lysed, substrate solution was added (Perkin Elmer ATPlite Luminescence Assay System, 6016943), and the mixture agitated for 5 min. After dark adaptation (10 min), luminescence was measured and converted to ATP levels using a standard curve, then normalized to protein.
Assessment of cellular glutathione
Glutathione levels were determined using the Tietze recycling assay.57 Cells were washed twice with ice-cold phosphate buffered saline (PBS) containing 10 µM DTPA, and then lysed in PBS-DTPA buffer containing 0.1% Triton X-100 for 10 min on ice. After which, lysates were centrifuged at 12,500 rpm at 4 °C for 15 min. Cleared supernatant fractions were assayed for glutathione content by following the absorbance at 412 nm over 5 min and extrapolating the data to a standard curve established using reduced glutathione. Results are expressed as nmol GSH/mg protein.
Assessment of mitochondrial membrane potential
Mitochondrial membrane potential was assessed using the cationic membrane permeable dye JC-1 (Invitrogen, T3168). Following HNE and/or 2DG treatment, cells were washed with medium and incubated with 7.7 µM JC-1 dye for 30 min. Cells were then washed with PBS, and red/green fluorescence was measured using a fluorescence plate reader with excitation/emission filters (560/595 nm and 484/535 nm). Results are expressed as the ratio of red to green fluorescence.58
Statistical analysis
Data are reported as mean ± SEM. Comparisons between two groups were performed with unpaired Student t tests. Comparisons among multiple groups or between two groups at multiple time-points were performed by either one-way or two-way analysis of variance, as appropriate, followed by post-hoc Tukey HSD test. A P value of ≤ 0.05 was considered statistically significant.
Supplementary Material
Acknowledgments
We thank members of the laboratories of Dr Zhang and Dr Darley-Usmar for technical help and discussions. This work was supported by NIHR01-NS064090 and a VA merit award (to JZ).
Glossary
Abbreviations:
- 2DG
2-deoxyglucose
- 3-MA
3-methyladenine
- BSO
L-buthionine sulfoximine
- CQ
chloroquine
- DMEM
Dulbecco’s modified Eagle’s medium
- DTPA
diethylene triamine pentaacetic acid
- FBS
fetal bovine serum
- FCCP
carbonyl cyanide p-[trifluoromethoxy]-phenyl-hydrazone
- GSH
glutathione
- HNE
4-hydroxynonenal
- KA
koningic acid
- LAMP1
lysosomal-associated membrane protein 1
Disclosure of Potential Conflicts of Interest
No potential conflicts of interest were disclosed.
Supplemental Materials
Supplemental materials may be found here: www.landesbioscience.com/journals/autophagy/article/26094
Footnotes
Previously published online: www.landesbioscience.com/journals/autophagy/article/26094
References
- 1.Malkus KA, Tsika E, Ischiropoulos H. Oxidative modifications, mitochondrial dysfunction, and impaired protein degradation in Parkinson’s disease: how neurons are lost in the Bermuda triangle. Mol Neurodegener. 2009;4:24. doi: 10.1186/1750-1326-4-24. [DOI] [PMC free article] [PubMed] [Google Scholar]
- 2.Zhang J, Darley-Usmar V. Mitochondrial Dysfunction in Neurodegenerative Disease: Protein Aggregation, Autophagy and Oxidative Stress. In: Reeve AK, Krishnan KJ, Duchen MR, Turnbull DM, eds. Mitochondrial Dysfunction in Neurodegenerative Disorders. London: Springer-Verlag, 2012:95-113 [Google Scholar]
- 3.Uttara B, Singh AV, Zamboni P, Mahajan RT. Oxidative stress and neurodegenerative diseases: a review of upstream and downstream antioxidant therapeutic options. Curr Neuropharmacol. 2009;7:65–74. doi: 10.2174/157015909787602823. [DOI] [PMC free article] [PubMed] [Google Scholar]
- 4.Emerit J, Edeas M, Bricaire F. Neurodegenerative diseases and oxidative stress. Biomed Pharmacother. 2004;58:39–46. doi: 10.1016/j.biopha.2003.11.004. [DOI] [PubMed] [Google Scholar]
- 5.Butterfield DA, Lauderback CM. Lipid peroxidation and protein oxidation in Alzheimer’s disease brain: potential causes and consequences involving amyloid beta-peptide-associated free radical oxidative stress. Free Radic Biol Med. 2002;32:1050–60. doi: 10.1016/S0891-5849(02)00794-3. [DOI] [PubMed] [Google Scholar]
- 6.Sultana R, Perluigi M, Butterfield DA. Protein oxidation and lipid peroxidation in brain of subjects with Alzheimer’s disease: insights into mechanism of neurodegeneration from redox proteomics. Antioxid Redox Signal. 2006;8:2021–37. doi: 10.1089/ars.2006.8.2021. [DOI] [PubMed] [Google Scholar]
- 7.Butterfield DA, Bader Lange ML, Sultana R. Involvements of the lipid peroxidation product, HNE, in the pathogenesis and progression of Alzheimer’s disease. Biochim Biophys Acta. 2010;1801:924–9. doi: 10.1016/j.bbalip.2010.02.005. [DOI] [PMC free article] [PubMed] [Google Scholar]
- 8.Muralikrishna Adibhatla R, Hatcher JF. Phospholipase A2, reactive oxygen species, and lipid peroxidation in cerebral ischemia. Free Radic Biol Med. 2006;40:376–87. doi: 10.1016/j.freeradbiomed.2005.08.044. [DOI] [PubMed] [Google Scholar]
- 9.Ferretti G, Bacchetti T, Masciangelo S, Nanetti L, Mazzanti L, Silvestrini M, Bartolini M, Provinciali L. Lipid peroxidation in stroke patients. Clin Chem Lab Med. 2008;46:113–7. doi: 10.1515/CCLM.2008.011. [DOI] [PubMed] [Google Scholar]
- 10.Dubinina EE, Dadali VA. Role of 4-hydroxy-trans-2-nonenal in cell functions. Biochemistry (Mosc) 2010;75:1069–87. doi: 10.1134/S0006297910090014. [DOI] [PubMed] [Google Scholar]
- 11.Yoritaka A, Hattori N, Uchida K, Tanaka M, Stadtman ER, Mizuno Y. Immunohistochemical detection of 4-hydroxynonenal protein adducts in Parkinson disease. Proc Natl Acad Sci U S A. 1996;93:2696–701. doi: 10.1073/pnas.93.7.2696. [DOI] [PMC free article] [PubMed] [Google Scholar]
- 12.Perluigi M, Coccia R, Butterfield DA. 4-Hydroxy-2-nonenal, a reactive product of lipid peroxidation, and neurodegenerative diseases: a toxic combination illuminated by redox proteomics studies. Antioxid Redox Signal. 2012;17:1590–609. doi: 10.1089/ars.2011.4406. [DOI] [PMC free article] [PubMed] [Google Scholar]
- 13.Reed TT, Pierce WM, Markesbery WR, Butterfield DA. Proteomic identification of HNE-bound proteins in early Alzheimer disease: Insights into the role of lipid peroxidation in the progression of AD. Brain Res. 2009;1274:66–76. doi: 10.1016/j.brainres.2009.04.009. [DOI] [PubMed] [Google Scholar]
- 14.Poli G, Schaur RJ, Siems WG, Leonarduzzi G. 4-hydroxynonenal: a membrane lipid oxidation product of medicinal interest. Med Res Rev. 2008;28:569–631. doi: 10.1002/med.20117. [DOI] [PubMed] [Google Scholar]
- 15.Lee WC, Wong HY, Chai YY, Shi CW, Amino N, Kikuchi S, Huang SH. Lipid peroxidation dysregulation in ischemic stroke: plasma 4-HNE as a potential biomarker? Biochem Biophys Res Commun. 2012;425:842–7. doi: 10.1016/j.bbrc.2012.08.002. [DOI] [PubMed] [Google Scholar]
- 16.Urabe T, Yamasaki Y, Hattori N, Yoshikawa M, Uchida K, Mizuno Y. Accumulation of 4-hydroxynonenal-modified proteins in hippocampal CA1 pyramidal neurons precedes delayed neuronal damage in the gerbil brain. Neuroscience. 2000;100:241–50. doi: 10.1016/S0306-4522(00)00264-5. [DOI] [PubMed] [Google Scholar]
- 17.Berg MJ, Durrie R, Sapirstein VS, Marks N. Composition of white matter bovine brain coated vesicles: evidence that several components influence beta-amyloid peptide to form oligomers and aggregates in vitro. Brain Res. 1997;752:72–80. doi: 10.1016/S0006-8993(96)01445-X. [DOI] [PubMed] [Google Scholar]
- 18.Aoyama K, Watabe M, Nakaki T. Regulation of neuronal glutathione synthesis. J Pharmacol Sci. 2008;108:227–38. doi: 10.1254/jphs.08R01CR. [DOI] [PubMed] [Google Scholar]
- 19.Völkel W, Sicilia T, Pähler A, Gsell W, Tatschner T, Jellinger K, Leblhuber F, Riederer P, Lutz WK, Götz ME. Increased brain levels of 4-hydroxy-2-nonenal glutathione conjugates in severe Alzheimer’s disease. Neurochem Int. 2006;48:679–86. doi: 10.1016/j.neuint.2005.12.003. [DOI] [PubMed] [Google Scholar]
- 20.Chen J, Schenker S, Frosto TA, Henderson GI. Inhibition of cytochrome c oxidase activity by 4-hydroxynonenal (HNE). Role of HNE adduct formation with the enzyme subunits. Biochim Biophys Acta. 1998;1380:336–44. doi: 10.1016/S0304-4165(98)00002-6. [DOI] [PubMed] [Google Scholar]
- 21.Dranka BP, Benavides GA, Diers AR, Giordano S, Zelickson BR, Reily C, Zou L, Chatham JC, Hill BG, Zhang J, et al. Assessing bioenergetic function in response to oxidative stress by metabolic profiling. Free Radic Biol Med. 2011;51:1621–35. doi: 10.1016/j.freeradbiomed.2011.08.005. [DOI] [PMC free article] [PubMed] [Google Scholar]
- 22.Schneider L, Giordano S, Zelickson BR, S Johnson M, A Benavides G, Ouyang X, Fineberg N, Darley-Usmar VM, Zhang J. Differentiation of SH-SY5Y cells to a neuronal phenotype changes cellular bioenergetics and the response to oxidative stress. Free Radic Biol Med. 2011;51:2007–17. doi: 10.1016/j.freeradbiomed.2011.08.030. [DOI] [PMC free article] [PubMed] [Google Scholar]
- 23.Hill BG, Benavides GA, Lancaster JR, Jr., Ballinger S, Dell’Italia L, Jianhua Z, Darley-Usmar VM. Integration of cellular bioenergetics with mitochondrial quality control and autophagy. Biol Chem. 2012;393:1485–512. doi: 10.1515/hsz-2012-0198. [DOI] [PMC free article] [PubMed] [Google Scholar]
- 24.Lee J, Giordano S, Zhang J. Autophagy, mitochondria and oxidative stress: cross-talk and redox signalling. Biochem J. 2012;441:523–40. doi: 10.1042/BJ20111451. [DOI] [PMC free article] [PubMed] [Google Scholar]
- 25.Kiffin R, Bandyopadhyay U, Cuervo AM. Oxidative stress and autophagy. Antioxid Redox Signal. 2006;8:152–62. doi: 10.1089/ars.2006.8.152. [DOI] [PubMed] [Google Scholar]
- 26.Pan T, Kondo S, Le W, Jankovic J. The role of autophagy-lysosome pathway in neurodegeneration associated with Parkinson’s disease. Brain. 2008;131:1969–78. doi: 10.1093/brain/awm318. [DOI] [PubMed] [Google Scholar]
- 27.Shibata N, Kobayashi M. [The role for oxidative stress in neurodegenerative diseases] Brain Nerve. 2008;60:157–70. [PubMed] [Google Scholar]
- 28.Mattson MP. Apoptosis in neurodegenerative disorders. Nat Rev Mol Cell Biol. 2000;1:120–9. doi: 10.1038/35040009. [DOI] [PubMed] [Google Scholar]
- 29.Sarkar S, Ravikumar B, Floto RA, Rubinsztein DC. Rapamycin and mTOR-independent autophagy inducers ameliorate toxicity of polyglutamine-expanded huntingtin and related proteinopathies. Cell Death Differ. 2009;16:46–56. doi: 10.1038/cdd.2008.110. [DOI] [PubMed] [Google Scholar]
- 30.Pan T, Kondo S, Zhu W, Xie W, Jankovic J, Le W. Neuroprotection of rapamycin in lactacystin-induced neurodegeneration via autophagy enhancement. Neurobiol Dis. 2008;32:16–25. doi: 10.1016/j.nbd.2008.06.003. [DOI] [PubMed] [Google Scholar]
- 31.Hill BG, Haberzettl P, Ahmed Y, Srivastava S, Bhatnagar A. Unsaturated lipid peroxidation-derived aldehydes activate autophagy in vascular smooth-muscle cells. Biochem J. 2008;410:525–34. doi: 10.1042/BJ20071063. [DOI] [PubMed] [Google Scholar]
- 32.Krohne TU, Stratmann NK, Kopitz J, Holz FG. Effects of lipid peroxidation products on lipofuscinogenesis and autophagy in human retinal pigment epithelial cells. Exp Eye Res. 2010;90:465–71. doi: 10.1016/j.exer.2009.12.011. [DOI] [PubMed] [Google Scholar]
- 33.Peppard RF, Martin WR, Carr GD, Grochowski E, Schulzer M, Guttman M, McGeer PL, Phillips AG, Tsui JK, Calne DB. Cerebral glucose metabolism in Parkinson’s disease with and without dementia. Arch Neurol. 1992;49:1262–8. doi: 10.1001/archneur.1992.00530360060019. [DOI] [PubMed] [Google Scholar]
- 34.Berding G, Odin P, Brooks DJ, Nikkhah G, Matthies C, Peschel T, Shing M, Kolbe H, van Den Hoff J, Fricke H, et al. Resting regional cerebral glucose metabolism in advanced Parkinson’s disease studied in the off and on conditions with [(18)F]FDG-PET. Mov Disord. 2001;16:1014–22. doi: 10.1002/mds.1212. [DOI] [PubMed] [Google Scholar]
- 35.Mosconi L, Mistur R, Switalski R, Brys M, Glodzik L, Rich K, Pirraglia E, Tsui W, De Santi S, de Leon MJ. Declining brain glucose metabolism in normal individuals with a maternal history of Alzheimer disease. Neurology. 2009;72:513–20. doi: 10.1212/01.wnl.0000333247.51383.43. [DOI] [PMC free article] [PubMed] [Google Scholar]
- 36.Mosconi L, Mistur R, Switalski R, Tsui WH, Glodzik L, Li Y, Pirraglia E, De Santi S, Reisberg B, Wisniewski T, et al. FDG-PET changes in brain glucose metabolism from normal cognition to pathologically verified Alzheimer’s disease. Eur J Nucl Med Mol Imaging. 2009;36:811–22. doi: 10.1007/s00259-008-1039-z. [DOI] [PMC free article] [PubMed] [Google Scholar]
- 37.Matz K, Keresztes K, Tatschl C, Nowotny M, Dachenhausen A, Brainin M, Tuomilehto J. Disorders of glucose metabolism in acute stroke patients: an underrecognized problem. Diabetes Care. 2006;29:792–7. doi: 10.2337/diacare.29.04.06.dc05-1818. [DOI] [PubMed] [Google Scholar]
- 38.Bolaños JP, Almeida A, Moncada S. Glycolysis: a bioenergetic or a survival pathway? Trends Biochem Sci. 2010;35:145–9. doi: 10.1016/j.tibs.2009.10.006. [DOI] [PubMed] [Google Scholar]
- 39.Rodriguez-Rodriguez P, Fernandez E, Almeida A, Bolaños JP. Excitotoxic stimulus stabilizes PFKFB3 causing pentose-phosphate pathway to glycolysis switch and neurodegeneration. Cell Death Differ. 2012;19:1582–9. doi: 10.1038/cdd.2012.33. [DOI] [PMC free article] [PubMed] [Google Scholar]
- 40.Presgraves SP, Ahmed T, Borwege S, Joyce JN. Terminally differentiated SH-SY5Y cells provide a model system for studying neuroprotective effects of dopamine agonists. Neurotox Res. 2004;5:579–98. doi: 10.1007/BF03033178. [DOI] [PubMed] [Google Scholar]
- 41.Wernicke C, Hellmann J, Finckh U, Rommelspacher H. Chronic ethanol exposure changes dopamine D2 receptor splicing during retinoic acid-induced differentiation of human SH-SY5Y cells. Pharmacol Rep. 2010;62:649–63. doi: 10.1016/s1734-1140(10)70322-4. [DOI] [PubMed] [Google Scholar]
- 42.Selley ML. (E)-4-hydroxy-2-nonenal may be involved in the pathogenesis of Parkinson’s disease. Free Radic Biol Med. 1998;25:169–74. doi: 10.1016/S0891-5849(98)00021-5. [DOI] [PubMed] [Google Scholar]
- 43.Xi H, Kurtoglu M, Liu H, Wangpaichitr M, You M, Liu X, Savaraj N, Lampidis TJ. 2-Deoxy-D-glucose activates autophagy via endoplasmic reticulum stress rather than ATP depletion. Cancer Chemother Pharmacol. 2011;67:899–910. doi: 10.1007/s00280-010-1391-0. [DOI] [PMC free article] [PubMed] [Google Scholar]
- 44.Xi H, Barredo JC, Merchan JR, Lampidis TJ. Endoplasmic reticulum stress induced by 2-deoxyglucose but not glucose starvation activates AMPK through CaMKKβ leading to autophagy. Biochem Pharmacol. 2013;85:1463–77. doi: 10.1016/j.bcp.2013.02.037. [DOI] [PubMed] [Google Scholar]
- 45.Andringa KK, Coleman MC, Aykin-Burns N, Hitchler MJ, Walsh SA, Domann FE, Spitz DR. Inhibition of glutamate cysteine ligase activity sensitizes human breast cancer cells to the toxicity of 2-deoxy-D-glucose. Cancer Res. 2006;66:1605–10. doi: 10.1158/0008-5472.CAN-05-3462. [DOI] [PubMed] [Google Scholar]
- 46.Lowman XH, McDonnell MA, Kosloske A, Odumade OA, Jenness C, Karim CB, Jemmerson R, Kelekar A. The proapoptotic function of Noxa in human leukemia cells is regulated by the kinase Cdk5 and by glucose. Mol Cell. 2010;40:823–33. doi: 10.1016/j.molcel.2010.11.035. [DOI] [PubMed] [Google Scholar]
- 47.Zabos P, Kyner D, Mendelsohn N, Schreiber C, Waxman S, Christman J, Acs G. Catabolism of 2-deoxyglucose by phagocytic leukocytes in the presence of 12-O-tetradecanoyl phorbol-13-acetate. Proc Natl Acad Sci U S A. 1978;75:5422–6. doi: 10.1073/pnas.75.11.5422. [DOI] [PMC free article] [PubMed] [Google Scholar]
- 48.Wong E, Cuervo AM. Autophagy gone awry in neurodegenerative diseases. Nat Neurosci. 2010;13:805–11. doi: 10.1038/nn.2575. [DOI] [PMC free article] [PubMed] [Google Scholar]
- 49.Chen H, Chan DC. Mitochondrial dynamics--fusion, fission, movement, and mitophagy--in neurodegenerative diseases. Hum Mol Genet. 2009;18(R2):R169–76. doi: 10.1093/hmg/ddp326. [DOI] [PMC free article] [PubMed] [Google Scholar]
- 50.Hill BG, Benavides GA, Lancaster JR, Jr., Ballinger S, Dell’Italia L, Jianhua Z, Darley-Usmar VM. Integration of cellular bioenergetics with mitochondrial quality control and autophagy. Biol Chem. 2012;393:1485–512. doi: 10.1515/hsz-2012-0198. [DOI] [PMC free article] [PubMed] [Google Scholar]
- 51.Levine B, Yuan J. Autophagy in cell death: an innocent convict? J Clin Invest. 2005;115:2679–88. doi: 10.1172/JCI26390. [DOI] [PMC free article] [PubMed] [Google Scholar]
- 52.Caro LH, Plomp PJ, Wolvetang EJ, Kerkhof C, Meijer AJ. 3-Methyladenine, an inhibitor of autophagy, has multiple effects on metabolism. Eur J Biochem. 1988;175:325–9. doi: 10.1111/j.1432-1033.1988.tb14200.x. [DOI] [PubMed] [Google Scholar]
- 53.Petiot A, Ogier-Denis E, Blommaart EF, Meijer AJ, Codogno P. Distinct classes of phosphatidylinositol 3′-kinases are involved in signaling pathways that control macroautophagy in HT-29 cells. J Biol Chem. 2000;275:992–8. doi: 10.1074/jbc.275.2.992. [DOI] [PubMed] [Google Scholar]
- 54.Nishida Y, Arakawa S, Fujitani K, Yamaguchi H, Mizuta T, Kanaseki T, Komatsu M, Otsu K, Tsujimoto Y, Shimizu S. Discovery of Atg5/Atg7-independent alternative macroautophagy. Nature. 2009;461:654–8. doi: 10.1038/nature08455. [DOI] [PubMed] [Google Scholar]
- 55.Duan W, Mattson MP. Dietary restriction and 2-deoxyglucose administration improve behavioral outcome and reduce degeneration of dopaminergic neurons in models of Parkinson’s disease. J Neurosci Res. 1999;57:195–206. doi: 10.1002/(SICI)1097-4547(19990715)57:2<195::AID-JNR5>3.0.CO;2-P. [DOI] [PubMed] [Google Scholar]
- 56.Guo ZH, Mattson MP. In vivo 2-deoxyglucose administration preserves glucose and glutamate transport and mitochondrial function in cortical synaptic terminals after exposure to amyloid beta-peptide and iron: evidence for a stress response. Exp Neurol. 2000;166:173–9. doi: 10.1006/exnr.2000.7497. [DOI] [PubMed] [Google Scholar]
- 57.Tietze F. Enzymic method for quantitative determination of nanogram amounts of total and oxidized glutathione: applications to mammalian blood and other tissues. Anal Biochem. 1969;27:502–22. doi: 10.1016/0003-2697(69)90064-5. [DOI] [PubMed] [Google Scholar]
- 58.Perry SW, Norman JP, Barbieri J, Brown EB, Gelbard HA. Mitochondrial membrane potential probes and the proton gradient: a practical usage guide. Biotechniques. 2011;50:98–115. doi: 10.2144/000113610. [DOI] [PMC free article] [PubMed] [Google Scholar]
Associated Data
This section collects any data citations, data availability statements, or supplementary materials included in this article.


