Abstract
Commercial off-the-shelf digital cameras are inexpensive and easy-to-use instruments that can be used for quantitative scientific data acquisition if images are captured in raw format and processed so that they maintain a linear relationship with scene radiance. Here we describe the image-processing steps required for consistent data acquisition with color cameras. In addition, we present a method for scene-specific color calibration that increases the accuracy of color capture when a scene contains colors that are not well represented in the gamut of a standard color-calibration target. We demonstrate applications of the proposed methodology in the fields of biomedical engineering, artwork photography, perception science, marine biology, and underwater imaging.
1. INTRODUCTION
State-of-the-art hardware, built-in photo-enhancement software, waterproof housings, and affordable prices enable widespread use of commercial off-the-shelf (COTS) digital cameras in research laboratories. However, it is often overlooked that these cameras are not optimized for accurate color capture, but rather for producing photographs that will appear pleasing to the human eye when viewed on small gamut and low dynamic range consumer devices [1,2]. As such, use of cameras as black-box systems for scientific data acquisition, without control of how photographs are manipulated inside, may compromise data accuracy and repeatability.
A consumer camera photograph is considered unbiased if it has a known relationship to scene radiance. This can be a purely linear relationship or a nonlinear one where the nonlinearities are precisely known and can be inverted. A linear relationship to scene radiance makes it possible to obtain device-independent photographs that can be quantitatively compared with no knowledge of the original imaging system. Raw photographs recorded by many cameras have this desired property [1], whereas camera-processed images, most commonly images in jpg format, do not.
In-camera processing introduces nonlinearities through make- and model-specific and often proprietary operations that alter the color, contrast, and white balance of images. These images are then transformed to a nonlinear RGB space and compressed in an irreversible fashion (Fig. 1). Compression, for instance, creates artifacts that can be so unnatural that they may be mistaken for cases of image tampering (Fig. 2) [3]. As a consequence, pixel intensities in consumer camera photographs are modified such that they are no longer linearly related to scene radiance. Models that approximate raw (linear) RGB from nonlinear RGB images (e.g., sRGB) exist, but at their current stage they require a series of training images taken under different settings and light conditions as well as ground-truth raw images [2].
Fig. 1.

Basic image-processing pipeline in a consumer camera.
Fig. 2.
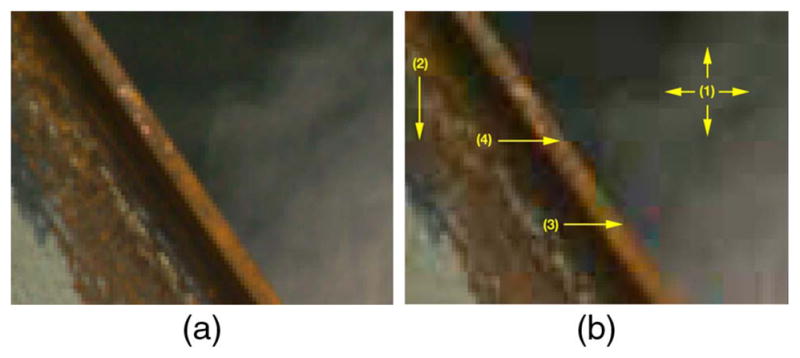
(a) An uncompressed image. (b) Artifacts after jpg compression: (1) grid-like pattern along block boundaries, (2) blurring due to quantization, (3) color artifacts, (4) jagged object boundaries. Photo credit: Dr. Hany Farid. Used with permission. See [3] for full resolution images.
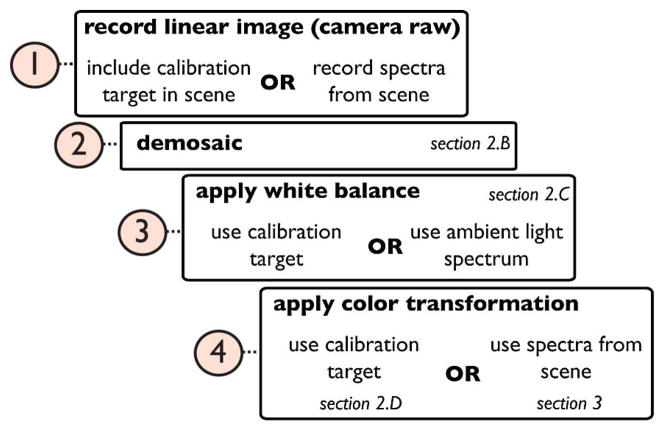
The limitations and merit of COTS cameras for scientific applications have previously been explored, albeit disjointly, in ecology [4], environmental sciences [5], systematics [6], animal coloration [7], dentistry [8], and underwater imaging [9,10]. Stevens et al. [7] wrote: “… most current applications of digital photography to studies of animal coloration fail to utilize the full potential of the technology; more commonly, they yield data that are qualitative at best and uninterpretable at worst.” Our goal is to address this issue and make COTS cameras accessible to researchers from all disciplines as proper data-collection instruments. We propose a simple framework (Fig. 3) and show that it enables consistent color capture (Sections 2.A–2.D). In Section 3, we introduce the idea of scene-specific color calibration (SSCC) and show that it improves color-transformation accuracy when a non-ordinary scene is photographed. We define an ordinary scene as one that has colors within the gamut of a commercially available color-calibration target. Finally, we demonstrate how the proposed workflow can be applied to real problems in different fields (Section 4).
Fig. 3.
Workflow proposed for processing raw images. Consumer cameras can be used for scientific data acquisition if images are captured in raw format and processed manually so that they maintain a linear relationship to scene radiance.
Throughout this paper, “camera” will refer to “COTS digital cameras,” also known as “consumer,” “digital still,” “trichromatic,” or “RGB” cameras. Any references to RGB will mean “linear RGB,” and nonlinear RGB images or color spaces will be explicitly specified as such.
2. COLOR IMAGING WITH COTS CAMERAS
Color vision in humans (and other animals) is used to distinguish objects and surfaces based on their spectral properties. Normal human vision is trichromatic; the retina has three cone photoreceptors referred to as short (S, peak 440 nm), medium (M, peak 545 nm), and long (L, peak 580 nm). Multiple light stimuli with different spectral shapes evoke the same response. This response is represented by three scalars known as tri-stimulus values, and stimuli that have the same tri-stimulus values create the same color perception [11]. Typical cameras are also designed to be trichromatic; they use color filter arrays on their sensors to filter broadband light in the visible part of the electromagnetic spectrum in regions humans perceive as red (R), green (G), and blue (B). These filters are characterized by their spectral sensitivity curves, unique to every make and model (Fig. 4). This means that two different cameras record different RGB values for the same scene.
Fig. 4.
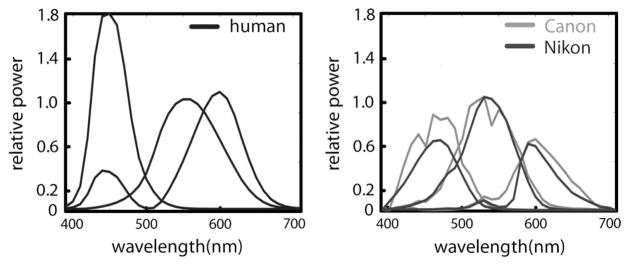
Human color-matching functions for the CIE XYZ color space for 2° observer and spectral sensitivities of two cameras; Canon EOS 1Ds mk II and Nikon D70.
Human photoreceptor spectral sensitivities are often modeled by the color-matching functions defined for the 2° observer (foveal vision) in the CIE 1931 XYZ color space. Any color space that has a well-documented relationship to XYZ is called device-independent [12]. Conversion of device-dependent camera colors to device-independent color spaces is the key for repeatability of work by others; we describe this conversion in Sections 2.D and 3.
A. Image Formation Principles
The intensity recorded at a sensor pixel is a function of the light that illuminates the object of interest (irradiance, Fig. 5), the light that is reflected from the object toward the sensor (radiance), the spectral sensitivity of the sensor, and optics of the imaging system:
| (1) |
Fig. 5.
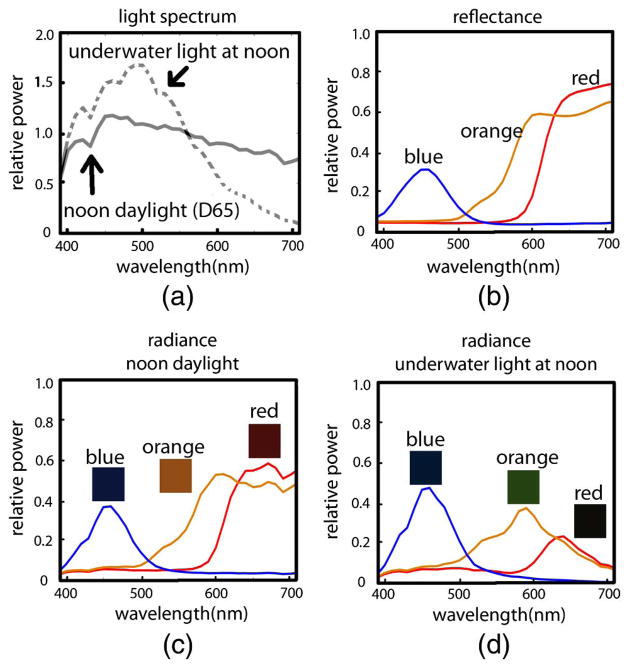
(a) Irradiance of daylight at noon (CIE D65 illuminant) and noon daylight on a sunny day recorded at 3 m depth in the Aegean Sea. (b) Reflectance spectra of blue, orange, and red patches from a Macbeth ColorChecker (MCC). Reflectance is the ratio of reflected light to incoming light at each wavelength, and it is a physical property of a surface, unaffected by the ambient light field, unlike radiance. (c) Radiance of the same patches under noon daylight on land and (d) underwater.
Here c is the color channel (e.g., RGB), Sc(λ) is the spectral sensitivity of that channel, Li(λ) is the irradiance, F(λ, θ) is the bi-directional reflectance distribution function, and λmin and λmax denote the lower and upper bounds of the spectrum of interest, respectively [13]. Scene radiance is given by
| (2) |
where F(λ, θ) is dependent on the incident light direction as well as the camera viewing angle where θ = (θi, ϕi, θr, ϕr). The function k(γ) depends on optics and other imaging parameters, and the cos θi term accounts for the changes in the exposed area as the angle between surface normal and illumination direction changes. Digital imaging devices use different optics and sensors to capture scene radiance according to these principles (Table 1).
Table 1.
Basic Properties of Color Imaging Devices
| Device | Spatial | Spectral | Image Size | Cost (USD) |
|---|---|---|---|---|
| Spectrometer | ✕ | ✓ | 1 × p | ≥2, 000 |
| COTS camera | ✓ | ✕ | n × m × 3 | ≥200 |
| Hyperspectral imager | ✓ | ✓ | n × m × p | ≥20, 000 |
B. Demosaicing
In single-sensor cameras, the raw image is a 2D array [Fig. 6(a), inset]. At each pixel, it contains intensity values that belong to one of RGB channels according to the mosaic layout of the filter array. A Bayer pattern is the most commonly used mosaic. At each location, the two missing intensities are estimated through interpolation in a process called demosaicing [14]. The highest-quality demosaicing algorithm available should be used regardless of its computation speed (Fig. 6), because speed is only prohibitive when demosaicing is carried out using the limited resources in a camera, not when it is done by a computer.
Fig. 6.
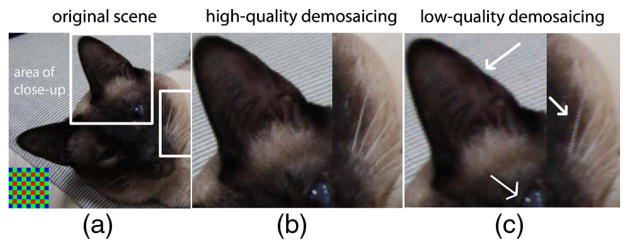
(a) An original scene. Inset at lower left: Bayer mosaic. (b) Close-ups of marked areas after high-quality (adaptive) and (c) low-quality (non-adaptive) demosaicing. Artifacts shown here are zippering on the sides of the ear and false colors near the white pixels of the whiskers and the eye.
C. White Balancing
In visual perception and color reproduction, white has a privileged status [15]. This is because through a process called chromatic adaptation, our visual system is able to discount small changes in the color of an illuminant, effectively causing different lighting conditions to appear “white” [12]. For example, a white slate viewed underwater would still be perceived as white by a SCUBA diver, even though the color of the ambient light is likely to be blue or green, as long as the diver is adapted to the light source. Cameras cannot adapt like humans and therefore cannot discount the color of the ambient light. Thus photographs must be white balanced to appear realistic to a human observer. White balancing often refers to two concepts that are related but not identical: RGB equalization and chromatic adaptation transform (CAT), described below.
In scientific imaging, consistent capture of scenes often has more practical importance than capturing them with high perceptual accuracy. White balancing as described here is a linear operation that modifies photos so they appear “natural” to us. For purely computational applications in which human perception does not play a role, and therefore a natural look is not necessary, white balancing can be done using RGB equalization, which has less perceptual relevance than CAT, but is simpler to implement (see examples in Section 4). Here we describe both methods of white balancing and leave it up to the reader to decide which method to use.
1. Chromatic Adaptation Transform
Also called white point conversion, CAT models approximate the chromatic adaptation phenomenon in humans and have the general form:
| (3) |
where VXYZ denotes the 3 × N matrix of colors in XYZ space, whose appearance is to be transformed from the source illuminant (S) to the destination illuminant (D); MA is a 3 × 3 matrix defined uniquely for the CAT model and ρ, γ, and β represent the tri-stimulus values in the cone response domain and are computed as follows:
| (4) |
Here, WP is a 3 × 1 vector corresponding to the white point of the light source. The most commonly used CAT models are Von Kries, Bradford, Sharp, and CMCCAT2000. The MA matrices for these models can be found in [16].
2. RGB Equalization
RGB equalization, often termed the “wrong von Kries model” [17], effectively ensures that the RGB values recorded for a gray calibration target are equal to each other. For a pixel p in the ith color channel of a linear image, RGB equalization is performed as
| (5) |
where is the intensity of the resulting white-balanced pixel in the ith channel, and DSi and WSi are the values of the dark standard and the white standard in the ith channel, respectively. The dark standard is usually the black patch in a calibration target, and the white standard is a gray patch with uniform reflectance spectrum (often, the white patch). A gray photographic target (Fig. 7) is an approximation to a Lamber-tian surface (one that appears equally bright from any angle of view) and has a uniformly distributed reflectance spectrum. On such a surface, the RGB values recorded by a camera are expected to be equal, but this is almost never the case due to a combination of camera sensor imperfections and spectral properties of the light field [17]. RGB equalization compensates for that.
Fig. 7.
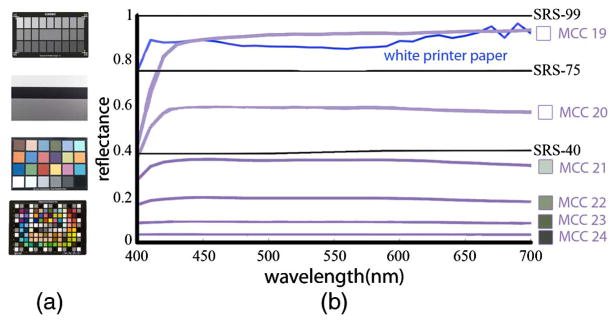
(a) Examples of photographic calibration targets. Top to bottom: Sekonik Exposure Profile Target II, Digital Kolor Kard, Macbeth ColorChecker (MCC) Digital. (b) Reflectance spectra (400–700 nm) of Spectralon targets (black curves, prefixed with SRS-), gray patches of the MCC (purple), and a white sheet of printer paper (blue). Note that MCC 23 has a flatter spectrum than the white patch (MCC 19). The printer paper is bright and reflects most of the light, but it does not do so uniformly at each wavelength.
D. Color Transformation
Two different cameras record different RGB values for the same scene due to differences in color sensitivity. This is true even for cameras of the same make and model [7]. Thus the goal of applying a color transformation is to minimize this difference by converting device-specific colors to a standard, device-independent space (Fig. 8). Such color transformations are constructed by imaging calibration targets. Standard calibration targets contain patches of colors that are carefully selected to provide a basis to the majority of natural reflectance spectra. A transformation matrix T between camera color space and a device-independent color space is computed as a linear least-squares regression problem:
| (6) |
Fig. 8.
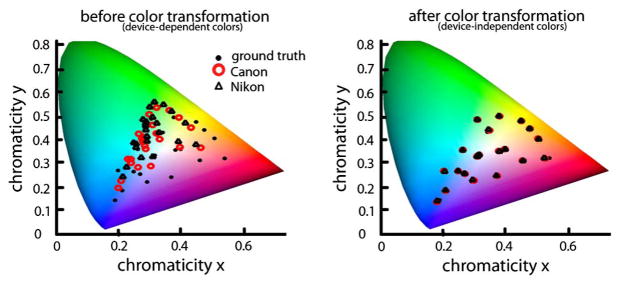
Chromaticity of MCC patches captured by two cameras, whose sensitivities are given in Fig. 4, in device-dependent and independent color spaces.
Here and are 3 × N matrices where N is the number of patches in the calibration target. The ground truth XYZ tri-stimulus values can either be the published values specific to that chart, or they could be calculated from measured spectra (Section 3). The RGB values are obtained from the linear RGB image of the calibration target. Note that the published XYZ values for color chart patches can be used only for the illuminants that were used to construct them (e.g., CIE illuminants D50 or D65); for other illuminants, a white point conversion [Eqs. (3) and (4)] should first be performed on linear RGB images.
The 3 × 3 transformation matrix T (see [17] for other polynomial models) is then estimated from Eq. (6):
| (7) |
where the superscript + denotes the Moore–Penrose pseudo-inverse of the matrix . This transformation T is then applied to a white-balanced novel image :
| (8) |
to obtain the color-corrected image , which is the linear, device-independent version of the raw camera output.
The resulting image needs to be converted to RGB before it can be displayed on a monitor. There are many RGB spaces, and one that can represent as many colors as possible should be preferred for computations (e.g., Adobe wide gamut) but, when displayed, the image will eventually be shown within the boundaries of the monitor’s gamut.
In Eq. (6), we did not specify the value of N, the number of patches used to derive the matrix T. Commercially available color targets vary in their number of patches, ranging between tens and hundreds. In general, a higher number of patches used does not guarantee an increase in color transformation accuracy. Alsam and Finlayson [18] found that 13 of the 24 patches of a Macbeth ColorChecker (MCC) are sufficient for most transformations. Intuitively, using patches whose radiance spectra span the subspace of those in the scene yields the most accurate transforms; we demonstrate this in Fig. 9. Given a scene that consists of a photograph of a MCC taken under daylight, we derive T using an increasing number of patches (1–24 at a time) and compare the total color transformation error in each case. We use the same image of the MCC for training and testing because this simple case provides a lower bound on error. We quantify the total error using
Fig. 9.

Using more patches for a color transformation does not guarantee increased transformation accuracy. In this example, color-transformation error is computed after 1–24 patches are used. There were many possible ways the patches could have been selected; only three are shown here. Regardless of patch ordering, overall color-transformation error is minimized after the inclusion of the 18th patch. The first six patches of orders 1 and 2 are chromatic, and for order 3, they are achromatic. The errors associated with order 3 are higher initially because the scene, which consists of a photo of an MCC, is mostly chromatic. Note that it is not possible to have the total error be identically zero even in this simple example due to numerical error and noise.
| (9) |
where an LAB triplet is the representation of an XYZ triplet in the CIE LAB color space (which is perceptually uniform); i indicates each of the N patches in the MCC, and GT is the ground-truth value for the corresponding patch. Initially, the total error depends on the ordering of the color patches. Since it would not be possible to simulate 24 (6.2045 × 10²³) different ways the patches could be ordered, we computed errors for three cases (see Fig. 9 legend). The initial error is the highest for patch order 3 because the first six patches of this ordering are the achromatic, and this transformation does poorly for the MCC, which is composed of mostly chromatic patches. Patch orderings 1 and 2, on the other hand, start with chromatic patches, and the corresponding initial errors are roughly an order of magnitude lower. Regardless of patch ordering, the total error is minimized after the inclusion of the 18th patch.
3. SCENE-SPECIFIC COLOR CALIBRATION
In Section 2.D, we outlined the process for building a 3 × 3 matrix T that transforms colors from a camera color space to the standard CIE XYZ color space. It is apparent from this process that the calibration results are heavily dependent on the choice of the calibration target or the specific patches used. Then we can hypothesize that if we had a calibration target that contained all the colors found in a given scene, and only those colors, we would obtain a color transformation with minimum error. In other words, if the colors used to derive the transformation T were also the colors used to evaluate calibration performance, the resulting error would be minimal—this is the goal of SSCC.
The color signal that reaches the eye, or camera sensor, is the product of reflectance and irradiance (Fig. 5), i.e., radiance [Eqs. (1) and (2)]. Therefore, how well a calibration target represents a scene depends on the chromatic composition of the features in the scene (reflectance) and the ambient light profile (irradiance). For example, a scene viewed under daylight will appear monochromatic if it only contains different shades of a single hue, even though daylight is a broadband light source. Similarly, a scene consisting of an MCC will appear monochromatic when viewed under a narrowband light source, even though the MCC patches contain many different hues.
Consumer cameras carry out color transformations from camera-dependent color spaces (i.e., raw image) to camera-independent color spaces assuming that a scene consists of reflectances similar to those in a standard color target, and that the ambient light is broadband (e.g., daylight or one of common indoor illuminants) because most scenes photographed by consumer cameras have these properties. We call scenes that can be represented by the patches of a standard calibration target ordinary. Non-ordinary scenes, on the other hand, have features whose reflectances are not spanned by calibration target patches (e.g., in a forest there may be many shades of greens and browns that common calibration targets do not represent), or are viewed under unusual lighting (e.g., under monochromatic light). In the context of scientific imaging, non-ordinary scenes may be encountered often; we give examples in Section 4.
For accurate capture of colors in a non-ordinary scene, a color-calibration target specific to that scene is built. This is not a physical target that is placed in the scene as described in Section 2.D; instead, it is a matrix containing tri-stimulus values of features from that scene. Tri-stimulus values are obtained from the radiance spectra measured from features in the scene. In Fig. 10, we show features from three different underwater habitats from which spectra, and in turn tri-stimulus values, can be obtained.
Fig. 10.

Features from three different dive sites that could be used for SSCC. This image first appeared in the December 2012 issue of Sea Technology magazine.
Spectra are converted into tri-stimulus values as follows [12]:
| (10) |
where X1 = X, X2 = Y, X3 = Z, and . Here, i is the index of the wavelength steps at which data were recorded, Ri is the reflectance spectrum, and Ei the spectrum of irradiance; x̄j,i are the values of the CIE 1931 color-matching functions x, y, z at the ith wavelength step, respectively.
Following the calculation of the XYZ tri-stimulus values, Eqs. (6) to (8) can be used as described in Section 2.D to perform color transformation. However, for every feature in a scene whose XYZ values are calculated, a corresponding RGB triplet that represents the camera color space is needed. This can be obtained in two ways: by photographing the features at the time of spectral data collection or by simulating the RGB values using the spectral sensitivity curves of the camera (if they are known) and ambient light profile. Equation (10) can be used to obtain the camera RGB values by substituting the camera spectral sensitivity curves instead of the color-matching functions. In some cases, this approach is more practical than taking photographs of the scene features (e.g., under field conditions when light may be varying rapidly); however, spectral sensitivity of camera sensors is proprietary and not made available by most manufacturers. Manual measurements can be done through the use of a monochromator [19], a set of narrowband interference filters [20], or empirically [21–25].
A. SSCC for Non-Ordinary Scenes
To create a non-ordinary scene, we used 292 natural reflectance spectra randomly selected from a floral reflectance database [26] and simulated their radiance with the underwater light profile at noon shown in Fig. 11(a) (Scene 1). While this seems like an unlikely combination, it allows for the simulation of chromaticity coordinates [Fig. 11(a), black dots] that are vastly different than those corresponding to an MCC under noon daylight [Fig. 11(a), black squares], using naturally occurring light and reflectances. We randomly chose 50% of the floral samples to be in the training set for SSCC and used the other 50% as a novel scene for testing. When this novel scene is transformed using an MCC, the mean error according to Eq. (9) was 23.8, and with SSCC, it was 1.56 (just noticeable difference threshold is 1). We repeated this transformation 100 times to ensure test and training sets were balanced and found that the mean-error values remained similar. Note that the resulting low error with SSCC is not due to the high number of training samples (146) used compared to 24 in an MCC. Repeating this analysis with a training set of only 24 randomly selected floral samples did not change the results significantly.
Fig. 11.
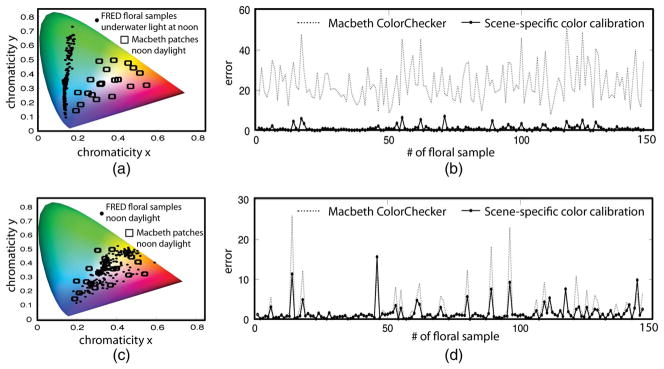
Scene-specific color transformation improves accuracy. (a) A “non-ordinary” scene that has no chromaticity overlap with the patches in the calibration target. (b) Mean error after SSCC is significantly less than after using a calibration chart. (c) An “ordinary” scene in which MCC patches span the chromaticities in the scene. (d) Resulting error between the MCC and scene-specific color transformation is comparable, but on average, still less for SSCC.
B. SSCC for Ordinary Scenes
We used the same spectra from scene 1 to build an ordinary scene (Scene 2), i.e., a scene in which the radiance of the floral samples [Fig. 11(c), black dots] are spanned by the radiance of the patches of an MCC [Fig. 11(c), black squares]. In this case, the average color transformation error using an MCC was reduced to 2.3, but it was higher than the error obtained using SSCC [Fig. 11(d)], which was 1.73 when 24 patches were used for training, and 1.5 with 146 patches.
4. EXAMPLES OF COTS CAMERAS USED FOR SCIENTIFIC IMAGING
Imaging and workflow details for the examples in this section are given in Table 2.
Table 2.
Summary of Post-Processing Steps for Raw Images in Examples Given in Section 4
| No. | Camera, Light | Demosaic | White Balance | Color Transformation |
|---|---|---|---|---|
| I | Sony A700, incandescent indoor light | 4th gray and black in MCC, Eq. (5) | None: analysis in the camera color space | |
| II | Canon EOS 1Ds Mark II, daylight | 4th gray and black in MCC, Eq. (5) | MCC and SSCC | |
| III | Canon Rebel T2, low-pressure sodium light | Adobe DNG converter Version 6.3.0.79 (for list of other raw image decoders, see http://www.cybercom.net/~dcoffin/dcraw/) | White point of ambient light spectrum, Eqs. (5) and (10) | None: analysis in the camera color space |
| IV | Canon EOS 1Ds Mark II, daylight | 4th gray and black in MCC, Eq. (5) | SSCC | |
| V | Canon EOS 5D Mark II, daylight+2 DS160 Ikelite strobes | 4th gray and black in MCC, Eq. (5) | MCC |
Example I
Using colors from a photograph to quantify temperature distribution on a surface [Fig. 3 Steps: (1) to (3)]
With careful calibration, it is possible to use inexpensive cameras to extract reliable temperature readings from surfaces painted with temperature-sensitive dyes, whose emission spectrum (color) changes when heated or cooled. Gurkan et al. [27] stained the channels in a microchip with thermo-sensitive dye (Edmund Scientific, Tonawanda, New York; range 32°C–41°C) and locally heated it one degree at a time using thermo-electric modules. At each temperature step, a set of baseline raw (linear RGB) photographs was taken. Then novel photographs of the chip (also in raw format) were taken for various heating and cooling scenarios. Each novel photograph was white balanced using the calibration target in the scene (Fig. 12). Since all images being compared were acquired with the same camera, colors were kept in the camera color space, and no color transformation was applied. To get the temperature readings, colors along the microchip channel were compared to the baseline RGB values using the ΔE2000 metric [28] and were assigned the temperature of the nearest baseline color.
Fig. 12.
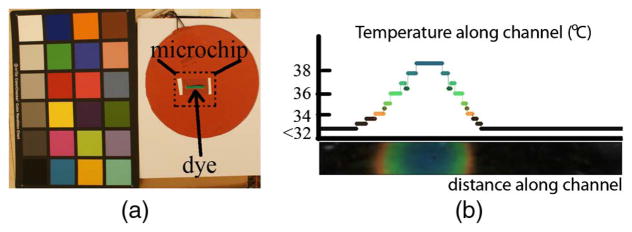
Temperature distribution along the microchip channel, which is locally heated to 39°C (colored region) while the rest was kept below 32°C (black region).
Example II
Use of inexpensive COTS cameras for accurate artwork photography [Fig. 3 Steps (1) to (4)]
Here we quantify the error associated with using a standard calibration target (versus SSCC) for imaging an oil painting (Fig. 13). Low-cost, easy-to-use consumer cameras and standard color-calibration targets are often used in artwork archival; a complex and specialized application to which many fine art and cultural heritage institutions allocate considerable resources. Though many museums in the Unites States have been using digital photography for direct capture of their artwork since the late 1990s [29], Frey and Farnand [30] found that some institutions did not include color-calibration targets in their imaging workflows at all. For this example, radiance from 36 points across the painting were measured, and it was found that their corresponding tri-stimulus values were within the span of the subspace of the MCC patches under identical light conditions, i.e., an ordinary scene. The MCC-based color transformation yielded an average ΔE2000 value of 0.21 and 0.22 for SSCC, both below the just noticeable difference threshold of 1. However, the average error was 31.77 for the jpg output produced by the camera used in auto setting. For this ordinary scene, there was no advantage to be gained from SSCC, and the use of a standard calibration target with the workflow in Fig. 3 significantly improved color accuracy over the in-camera processed image.
Fig. 13.
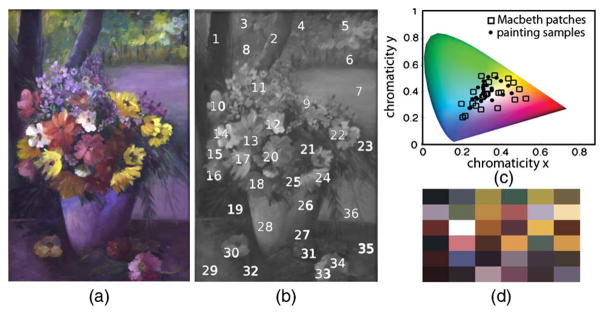
Example II: Use of inexpensive COTS cameras for accurate artwork photography. (a) Oil painting under daylight illumination. (b) Thirty-six points from which ground-truth spectra were measured. (b) Chromatic loci of the ground truth samples compared to MCC patches under identical illumination. (d) sRGB representation of the colors used for scene-specific calibration. Artwork: Fulya Akkaynak.
Example III
Capturing photographs under monochromatic low-pressure sodium light [Fig. 3 Steps (1) to (3)]
A monochromatic light spectrum E can be approximated by an impulse centered at the peak wavelength λp as E = C · δ(λ − λp), where C is the magnitude of intensity, and d is the Dirac delta function whose value is zero everywhere except when λ = λp. When λ = λp, δ = 1. It is not trivial to capture monochromatic scenes using COTS cameras accurately because they are optimized for use with indoor and outdoor broadband light sources. We used low-pressure sodium light (λp = 589 nm) to investigate the effect of color (or lack of) on visual perception of the material properties of objects. Any surface viewed under this light source appears as a shade of orange because x3 = z = 0 at λ = 589 nm for the CIE XYZ human color-matching functions (also for most consumer cameras), and in turn, X3 = Z = 0 at λ = 589 nm [Eq. (10)]. Subjects were asked to view real textiles once under sodium light and once under broadband light and answer questions about their material properties. The experiment was then repeated using photographs of the same textiles. To capture the appearance of colors under sodium light accurately, its irradiance was recorded using a spectrometer fitted with an irradiance probe. Then the tri-stimulus values corresponding to its white point were calculated and used for RGB equalization of linear novel images. Due to the monochromatic nature of the light source, there was no need to also apply a color transformation; adjusting the white point of the illuminant in the images ensured that the single hue in the scene was mapped correctly. The white point of the illuminant was indeed captured incorrectly when the camera was operated in auto mode, and the appearance of the textiles was noticeably different (Fig. 14).
Fig. 14.

Example III Capturing photographs under monochromatic low-pressure sodium light. (a) A pair of fabrics under broadband light. (b) A jpg image taken with the auto settings of a camera, under monochromatic sodium light. (c) Image processed using SSCC according to the flow in Fig. 3.
Example IV
In situ capture of a camouflaged animal and its habitat underwater [Fig. 3 Steps (1) to (4)]
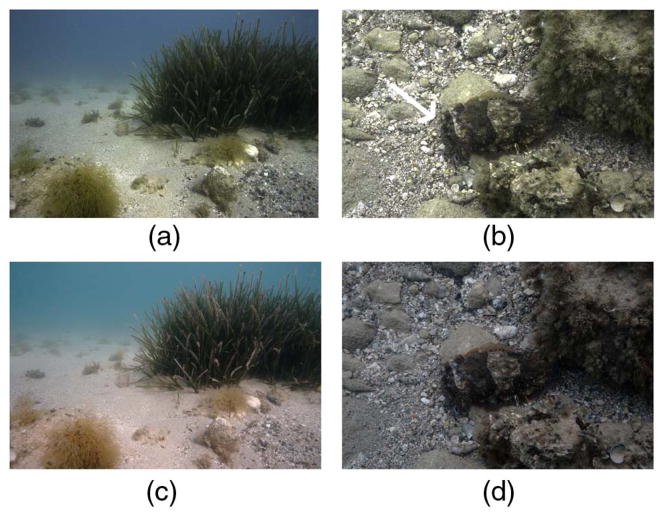
Imaging underwater is challenging because light is fundamentally different from what we encounter on land [Fig. 5(a)], and each underwater habitat is different from another in terms of the colorfulness of substrates (Fig. 10). Thus there is no global color chart that can be used across underwater environments, making underwater scenes (except for those very close to the surface) non-ordinary scenes. The majority of underwater imaging falls into three categories motivated by different requirements: (1) using natural light to capture a scene exactly the way it appears at a given depth; (2) using natural light to capture an underwater scene but postprocessing to obtain its appearance on land; and (3) introducing artificial broadband light in situ to capture the scene as it would have appeared on land (Example V). Here we give an example for case (1): capture of the colors of the skin of a camouflaged animal exactly the way an observer in situ would see them. For this application, we surveyed a dive site and built a database of substrate reflectance and light spectra [31]. Novel (raw) images taken at the same site were white balanced to match the white point of the ambient light. We then used the spectral database built for this dive site for SSCC (Fig. 15). The green hue in the resulting images may appear unusual for two reasons. First, a light-adapted human diver may not have perceived that green color in situ due to color constancy and therefore may not remember the scene to appear that way. Second, most professional underwater photographs we are familiar with are either post-processed to appear less green (Case 2), or they are taken with strobes that introduce broadband light to the scene to cancel the green appearance before image capture (Case 3). This kind of processing is indeed similar to the processing that may be performed by a COTS camera; the camera will assume a common land light profile (unless it is being operated in a pre-programmed underwater mode), ignorant of the long-wavelength attenuated ambient light, and this will result in boosting of the red channel pixel values.
Fig. 15.
Example IV: In situ capture of (a) an underwater habitat and (b) a camouflaged cuttlefish (marked with white arrow) using SSCC with features similar to those shown in Fig. 10 for Urla, Turkey. (c) and (d) are jpg outputs directly from the camera operated in auto mode and have a visible red tint as a consequence of in-camera processing.
Example V
Consistent underwater color-correction across multiple images [Fig. 3 Steps (1)–(4)]
Repeated consistent measurements are the foundation of ecological monitoring projects. In the case of corals, color information can help distinguish between different algal functional groups or even establish coral health change [32]. Until now, several color-correction targets were used for coral monitoring [33] but not tested for consistency. To test our method’s performance for consistent color capture, we attached one color chart to the camera using a monopod and placed another one manually in different locations in the field of view (Fig. 16). We tested several correction algorithms: automatic adjustment, white balancing, and the algorithm presented in this paper (Fig. 3) and defined the error as consistency of the corrected color. For each of the M = 35 patches in the N = 68 corrected images, we calculated mean chromaticity as
Fig. 16.
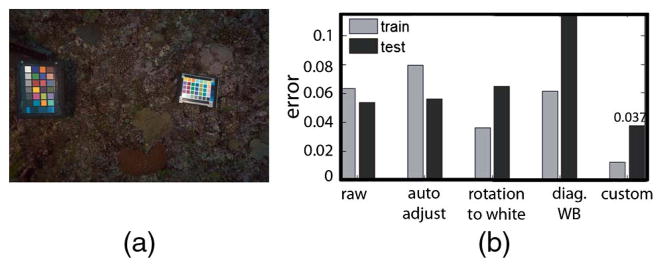
Example V: Consistent underwater color correction. (a) In each frame, the color chart on the left was used for calibration, and the one on the right was for testing. Images were taken in Toyota Reef, Fiji. (b) Average error for several color-corrected methods for training and testing. Our method achieves the lowest error and is the only method to improve over the raw images of the test chart.
where r = R/(R + G + B), g = G/(R + G + B) and defined the patch error to be with total error as the average across all M patches. Our algorithm yielded the most consistent colors, opening the possibility for the use of color targets designed for land photography in marine ecology images.
5. DISCUSSION
We established a framework for the manual processing of raw photographs taken by COTS cameras for their use as scientific data, demonstrating that the use of linear RGB images and calibration targets provide consistent quantitative data. We also introduced a method to perform scene-specific color calibration (SSCC) that improves color-capture accuracy for scenes that are not chromatically well represented by standard color targets.
We recognize that the methodology described here adds some complication to the very feature that makes cameras popular: ease of use. For some steps in our workflow, knowing the spectral sensitivities of a specific camera is advantageous. Camera manufacturers do not provide these curves, and the burden falls on the users to derive them. Surveying a site to collect spectra for SSCC requires the use of a spectroscopic imaging device, which adds to the overall cost of the study and may extend its duration. Yet, despite the extra effort required for calibration, COTS cameras can be more useful than hyper-spectral imagers whose robust use in science is hindered because they are physically bulky, expensive, have low resolution, and are impractical to use with moving objects or changing light due to long exposure scanning. Spectrometers are much more affordable and portable, but they collect point-by-point data and thus lack the spatial dimension. This translates into a slow data-acquisition process and makes spectrometers unsuitable for recording color information from objects that may have texture or mottled colors [7,34]. To allow for easier adoption of the extra steps required and their seamless integration into research projects, we provide a toolbox of functions written in MATLAB programming language (Mathworks, Inc. Natick, Massachusetts), which is available for download at http://www.mathworks.com/matlabcentral/fileexchange/42548.
Although we based our work on the CIE 1931 XYZ color space, it is possible to use non-human device-independent color spaces such as those modeled by [35]. This should be done with caution because the domain of COTS cameras is intentionally designed to be limited to the part of the electromagnetic spectrum visible to humans, making them poor sensors for most other visual systems. For example, COTS cameras do not capture information in the ultraviolet region of the electromagnetic spectrum wavelengths to which many animals are sensitive; however, they can be modified or used in conjunction with ultraviolet-sensitive instruments to collect data in that region [7].
Applications of a standardized and reproducible workflow with scene-informed color calibration range well beyond the examples presented in this paper. For example, consumer cameras can be used for consistent imaging of diabetic wounds, pressure sores and foot ulcers; for the monitoring of food freshness to prevent illnesses; and for the validation of hyperspectral satellite imagery.
Acknowledgments
We thank Eric Chan for stimulating discussions and insights regarding scene-specific color calibration and Dr. Ruth Rosenholtz, Dr. Krista Ehinger, Phillip Isola, and Matt Hirsch for reviewing various drafts of this work. T. Treibitz is an Awardee of the Weizmann Institute of Science—National Postdoctoral Award Program for Advancing Women in Science and was supported by NSF grant ATM-0941760. D. Akkaynak, J. Allen, and R. Hanlon were supported by NSF grant 1129897 and ONR grants N0001406-1-0202 and N00014-10-1-0989 and U. Demirci by grants R01AI093282, R01AI081534, and NIH U54EB15408. J. Allen is grateful for support from a National Defense Science and Engineering Graduate Fellowship.
Footnotes
OCIS codes: (110.0110) Imaging systems; (010.1690) Color; (040.1490) Cameras; (100.0100) Image processing.
References
- 1.Chakrabarti A, Scharstein D, Zickler T. An empirical camera model for internet color vision. Proceedings of British Machine Vision Conference; 2009. p. 51.1. [Google Scholar]
- 2.Seon Joo K, Hai Ting L, Zheng L, Süsstrunk S, Lin S, Brown MS. A new in-camera imaging model for color computer vision and its application. IEEE Trans Pattern Anal Mach Intell. 2012;34:2289–2302. doi: 10.1109/TPAMI.2012.58. [DOI] [PubMed] [Google Scholar]
- 3.Farid H. That looks fake! 2011 retrieved http://www.fourandsix.com/blog/2011/6/29/that/looks/fake.html.
- 4.Levin N, Ben-Dor E, Singer A. A digital camera as a tool to measure colour indices and related properties of sandy soils in semi-arid environments. Int J Remote Sens. 2005;26:5475–5492. [Google Scholar]
- 5.De La Barrera E, Smith WK. Perspectives in Biophysical Plant Ecophysiology: A Tribute to Park S. Nobel. Unam; 2009. [Google Scholar]
- 6.McKay BD. The use of digital photography in systematics. Biol J Linn Soc. 2013;110:1–13. [Google Scholar]
- 7.Stevens M, Parraga CA, Cuthill IC, Partridge JC, Troscianko TS. Using digital photography to study animal coloration. Biol J Linn Soc. 2007;90:211–237. [Google Scholar]
- 8.Wee AG, Lindsey DT, Kuo S, Johnston WM. Color accuracy of commercial digital cameras for use in dentistry. Dent Mater. 2006;22:553–559. doi: 10.1016/j.dental.2005.05.011. [DOI] [PMC free article] [PubMed] [Google Scholar]
- 9.Åhlén J. Colour Correction of Underwater Images Using Spectral Data. Uppsala University; 2005. [Google Scholar]
- 10.Akkaynak D, Chan E, Allen JJ, Hanlon RT. OCEANS. IEEE; 2011. Using spectrometry and photography to study color underwater; pp. 1–8. [Google Scholar]
- 11.Wyszecki G, Stiles WS. Color Science: Concepts and Methods, Quantitative Data, and Formulae. Wiley; 2000. 2nd illustrated ed. [Google Scholar]
- 12.Reinhard E, Khan E, Akyüz A, Johnson G. Color Imaging: Fundamentals and Applications. A K Peters; 2008. [Google Scholar]
- 13.Szeliski R. Computer Vision: Algorithms and Applications. Springer; 2010. [Google Scholar]
- 14.Ramanath R, Snyder WE, Bilbro GL, Sander WA. Demosaicking methods for Bayer color arrays. J Electron Imaging. 2002;11:306–315. [Google Scholar]
- 15.Finlayson GD, Drew MS. Color and Imaging Conference. Society for Imaging Science and Technology; 1997. White-point preserving color correction; pp. 258–261. [Google Scholar]
- 16.Süsstrunk SE, Holm JM, Finlayson GD. Photonics West 2001-Electronic Imaging. International Society for Optics and Photonics; 2000. Chromatic adaptation performance of different RGB sensors; pp. 172–183. [Google Scholar]
- 17.Westland S, Ripamonti C. Computational Colour Science Using MATLAB. Wiley; 2004. [Google Scholar]
- 18.Alsam A, Finlayson G. Integer programming for optimal reduction of calibration targets. Color Res Appl. 2008;33:212–220. [Google Scholar]
- 19.Nakamura J. Image Sensors and Signal Processing for Digital Still Cameras. Taylor & Francis; 2005. [Google Scholar]
- 20.Mauer C, Wueller D. IS&T/SPIE Electronic Imaging. International Society for Optics and Photonics; 2009. Measuring the spectral response with a set of interference filters. paper 72500S. [Google Scholar]
- 21.Finlayson G, Hordley S, Hubel PM. Recovering device sensitivities with quadratic programming. IS&T/SID Sixth Color Imaging Conference: Color Science, Systems and Applications; 1998. [Google Scholar]
- 22.Hong G, Luo MR, Rhodes PA. A study of digital camera colorimetric characterisation based on polynomial modelling. Color Res Appl. 2001;26:76–84. [Google Scholar]
- 23.Barnard K, Funt B. Camera characterization for color research. Color Res Appl. 2002;27:152–163. [Google Scholar]
- 24.Cheung V, Westland S, Li C, Hardeberg J, Connah D. Characterization of trichromatic color cameras by using a new multispectral imaging technique. J Opt Soc Am A. 2005;22:1231–1240. doi: 10.1364/josaa.22.001231. [DOI] [PubMed] [Google Scholar]
- 25.Jiang J, Liu D, Gu J, Süsstrunk S. What is the space of spectral sensitivity functions for digital color cameras?. IEEE Workshop on the Applications of Computer Vision; IEEE; 2013. pp. 168–179. [Google Scholar]
- 26.Arnold SE, Faruq S, Savolainen V, McOwan PW, Chittka L. FReD: the floral reflectance database, A web portal for analyses of flower colour. PloS one. 2010;5:e14287. doi: 10.1371/journal.pone.0014287. [DOI] [PMC free article] [PubMed] [Google Scholar]
- 27.Gurkan UA, Tasoglu S, Akkaynak D, Avci O, Unluisler S, Canikyan S, MacCallum N, Demirci U. Smart interface materials integrated with microfluidics for on-demand local capture and release of cells. Adv Healthcare Mat. 2012;1:661–668. doi: 10.1002/adhm.201200009. [DOI] [PMC free article] [PubMed] [Google Scholar]
- 28.Luo MR, Cui G, Rigg B. The development of the CIE 2000 colour-difference formula: CIEDE2000. Color Res Appl. 2001;26:340–350. [Google Scholar]
- 29.Rosen MR, Frey FS. RIT American museums survey on digital imaging for direct capture of artwork. Society for Imaging Science and Technology Archiving Conference; 2005. [Google Scholar]
- 30.Frey FS, Farnand SP. Tech Rep. Rochester Institute of Technology; 2011. Benchmarking art image interchange cycles. [Google Scholar]
- 31.Akkaynak D, Allen J, Mäthger L, Chiao CC, Hanlon R. Quantification of cuttlefish (Sepia officinalis) camouflage: a study of color and luminance using in situ spectrometry. J Comp Physiol A. 2013;199:211–225. doi: 10.1007/s00359-012-0785-3. [DOI] [PubMed] [Google Scholar]
- 32.Siebeck U, Marshall N, Klüter A, Hoegh-Guldberg O. Monitoring coral bleaching using a colour reference card. Coral Reefs. 2006;25:453–460. [Google Scholar]
- 33.Winters G, Holzman R, Blekhman A, Beer S, Loya Y. Photographic assessment of coral chlorophyll contents: implications for ecophysiological studies and coral monitoring. J Exp Mar Biol Ecol. 2009;380:25–35. [Google Scholar]
- 34.Pike TW. Using digital cameras to investigate animal colouration: estimating sensor sensitivity functions. Behav Ecol Sociobiol. 2011;65:849–858. [Google Scholar]
- 35.Stavenga D, Smits R, Hoenders B. Simple exponential functions describing the absorbance bands of visual pigment spectra. Vis Res. 1993;33:1011–1017. doi: 10.1016/0042-6989(93)90237-q. [DOI] [PubMed] [Google Scholar]


