

Abstract
Practical HIV diagnostics are urgently needed in resource-limited settings. While HIV infection can be diagnosed using simple, rapid, lateral flow immunoassays, HIV disease staging and treatment monitoring require accurate counting of a particular white blood cell subset, the CD4+ T lymphocyte. To address the limitations of current expensive, technically demanding and/or time-consuming approaches, we have developed a simple CD4 counting microfluidic device. This device uses cell affinity chromatography operated under differential shear flow to specifically isolate CD4+ T lymphocytes with high efficiency directly from 10 microlitres of unprocessed, unlabeled whole blood. CD4 counts are obtained under an optical microscope in a rapid, simple and label-free fashion. CD4 counts determined in our device matched measurements by conventional flow cytometry among HIV-positive subjects over a wide range of absolute CD4 counts (R2 = 0.93). This CD4 counting microdevice can be used for simple, rapid and affordable CD4 counting in point-of-care and resource-limited settings.
Introduction
Of the 40.4 million people infected with HIV globally, more than 35 million live in developing countries with significant resource limitations, many of whom are in urgent need of diagnosis, monitoring and antiretroviral therapy.1 In the process of managing HIV-infected subjects, counts of a specific white blood cell population, CD4+ T lymphocytes, have proven to be essential biological indicators.2 In adults, the absolute number of CD4+ T cells per microlitre of blood has critical prognostic and therapeutic implications, and is used for both HIV staging and treatment decisions.3–5 Regular monitoring of CD4 counts—two to four times per year—is recommended for all stages of infection, prior to the need for antiretroviral drugs and during lifelong treatment.6 Clinically, a CD4 count below 200 cells μL−1 establishes the diagnosis of AIDS,7 and in most settings is used to initiate antiretroviral treatment (ART) and prophylaxis against opportunistic infections.8 Higher CD4 count thresholds of 350 and 500 cells μL−1 are widely used to increase the intensity of monitoring, and in some settings, to initiate ART. However, affordable and appropriate laboratory monitoring tools to determine CD4 counts have little penetration in resource-limited settings, despite ongoing international efforts to extend the availability of ART to these areas.9
Currently, the gold standard for CD4+ T cell enumeration is flow cytometric counting of lymphocyte subpopulations using monoclonal antibodies and commercial multi-purpose flow cytometers, such as the FACSCalibur (Becton Dickinson) or EPICS XL (Beckman Coulter), or single-purpose CD4-counting flow cytometers, such as the FACSCount (Becton Dickinson).10–13 Although high throughput and accurate, the cost and technical requirements for operation and maintenance of these instruments have limited their reach and significantly delayed the implementation of HIV treatment programs in resource-limited areas worldwide.14 Smaller instruments like the Guava EasyCD4 offer limited improvements and have not been widely adopted. Non-cytofluoro-graphic methods, including ELISA format15 and bead format assays16,17 have been suggested as useful alternatives for CD4+ T lymphocyte quantification, since these methods require less equipment and have lower reagent costs than flow cytometry. However, they have much lower throughput, are more labour-intensive and less accurate, and are not widely used or recommended by World Health Organization guidelines.
In addition, improvements on the back-end aspects of CD4 counting—such as miniaturization of equipment—do not address the most problematic issue for resource-limited settings, which is sample preparation. The requirements to collect blood by venipuncture, to lyse erythrocytes, to centrifuge samples, or to use pipettes for any step in the diagnostic assay are extremely problematic in these settings.18 Recently, Rodriguez et al. tested a prototype CD4 counting device designed for resource-limited settings, in which capture of leukocytes and imaging of the CD4+ subset were carried out on a membrane within a miniaturized flow cell.19 This device still required sample preparation, including labelling of the blood samples, and fluorescence-based detection for imaging and counting.
Amongst the new technologies with growing impact in medical diagnostics and global health, microfluidics and miniaturized lab-on-a-chip-type devices are extremely attractive for blood analysis.20 Beyond biochemical assays on the protein level,21,22 new capabilities for analysing blood cells in microfluidic devices are emerging.23,24 Although promising, most of these microfluidic devices are only compatible with model cell systems or require extensive sample preparation outside the device.25,26 In this paper, we present the development of a functional microfluidic device (Fig. 1) for whole blood CD4 counting that requires no sample handling or specific labelling. Operation of the device is based on a new cell isolation strategy discovered in our lab, in which effects of differential flow select the binding of cells on an antibody surface from whole blood. It is operated by directly injecting 10 μL of whole blood at a controlled flow rate, followed with rinsing non-specific cells from the microfluidic chamber and counting all the captured cells within the chip. Close agreement in CD4 counts was observed between the microchip measurements and conventional flow cytometry results for CD4 counts up to 800 cells μL−1. This micro-device can be used with a simple light microscope, such as those widely used for malaria smears, to form a low-cost, rapid, CD4 cell counting system appropriate for resource-limited settings. Demonstration in our study of cell analysis from unprocessed whole blood of HIV+ subjects represents, to our knowledge, the first practical applications of microfluidics in blood diagnostics based on cell surface markers, and opens new potential for microfluidic technology.
Fig. 1.

Microfluidic devices used in the study and operating procedure of the counting device. (a) Schematic depiction showing the operating procedure of the CD4 counting device. The microchip is operated by injecting 10 μL whole blood at controlled flow rate. This is followed with rinsing unbound cells from the chamber and counting all the captured cells within the chip using an optical microscope to obtain CD4 counts. (b) Photograph of a linear cell count device. Microfabricated PDMS devices with one inlet and one outlet were bound to glass slides to form closed chambers. The chamber was functionalized with specific antibody to capture target cells from whole blood. The shaded area indicates the chamber location within PDMS. (c) Geometry of the Hele–Shaw device. The Hele–Shaw device offers a linear variation of shear along its central line. It was used in this study to screen the optimal shear stress for cell capture. (d) Geometry of the linear cell count device. The linear device has a volume of 10 μL for sample volume metering. It was operated under the optimized shear stress to capture and numerate the target cells.
Materials and methods
Materials
3-Mercaptopropyl trimethoxysilane was purchased from Gelest (Morrisville, PA). Ethanol (200 proof), glass coverslips (35 × 60 mm, no. 1), hemacytometer and microslide field-finder were obtained from Fisher Scientific (Fair Lawn, NJ). For chamber fabrication, SU-8 photoresist and developer were obtained from MicroChem (Newton, MA); silicone elastomer and curing agent were obtained from Dow Corning (Midland, MI). Phosphate buffered saline (PBS) was obtained from Mediatech (Herndon, VA). Lyophilized bovine serum albumin (BSA) was obtained from Aldrich Chemical Co. (Milwaukee, WI). The coupling agent GMBS (N-y-maleimidobutyryloxy succinimide ester) and NeutrAvidin were obtained from Pierce Biotechnology (Rockford, IL). Biotinylated mouse anti-human anti-CD4 (clone 13b8.2) was purchased from Beckman Coulter (Somerset, NJ). Biotinylated mouse anti-human anti-CD36 (clone SMO) was obtained from Ancell (Bayport, MN). Alexa Fluor®488-conjugated mouse antibody to human CD4 (AF488-anti-CD4, clone 289-14120), Alexa Fluor® 647-conjugated mouse antibody to human CD3 (AF647-anti-CD3, clone 289-13801) and 4′-6-diamidino-2-phenylindole (DAPI) were obtained from Molecular Probes (Eugene, OR). Phycoerythrin (PE)-conjugated mouse anti-human CD14 monoclonal antibody (PE-anti-CD14, clone M5E2) was purchased from BD Bioscience (San Diego, CA). Paraformaldehyde was obtained from Electron Microscopy Sciences (Hatfield, PA).
Chamber design and fabrication
Two types of microfluidic devices were used in this work. The first one was the Hele–Shaw chamber (Fig. 1c) designed based on the equations derived by Usami et al.23,27 The shape of the chambers is such that the shear stress along the axis of the chamber decreases linearly along the chamber length. The fabricated flow chambers were 43 ± 1 μm in height with inlet width and total length of 5 mm and 50 mm, respectively. The Hele–Shaw devices were used to study the dynamics of lymphocyte attachment to microdevices using healthy donor blood, since multiple shear rates can be obtained in each flow chamber without changing the inlet flow rates. The second type of device was a straight flow channel (Fig. 1d), which provides a constant shear stress along the channel length and has a footprint of 2 cm2. The width, length and height of the channel were 4 mm, 51 mm and 50 ± 1 μm respectively. The straight channel device was used for actual cell capture and counting experiments, using the operating shear stress determined from the Hele–Shaw experimental data. The devices were fabricated in PDMS and bonded permanently to clean glass cover slips using standard clean room techniques.23,27
Surface modification
Freshly fabricated devices were modified using the method described previously.23,27 Briefly, the chambers were pretreated with 4% (v/v) solution of 3-mercaptopropyl trimethoxysilane in ethanol for 30 min at room temperature, followed with incubating the chambers with 0.01 μmol mL−1 GMBS in ethanol for 15 min at room temperature. Afterwards, NeutrAvidin was immobilized to GMBS by incubating the chamber surfaces with 10 μg ml−1 NeutrAvidin solution in PBS for at least 1 h at 4 °C. Finally, 10 μg mL−1 biotinylated anti-CD4 solution in PBS containing 1% (w/v) BSA and 0.09% (w/v) sodium azide was injected to react at room temperature for 15 min. After each step, the surfaces were rinsed with either ethanol or PBS, depending on the solvent used in the previous step, to flush away unreacted molecules.
Study subjects and blood preparation
Healthy HIV-negative and HIV-infected subjects were recruited from the Massachusetts General Hospital (MGH) in Boston. All subjects provided written informed consent. Samples of 5 mL of peripheral blood were collected by venipuncture in either heparin or EDTA Vacutainer collection tubes (Becton Dickinson). All samples were run on the microfluidic devices on the day of blood collection. Parallel measurement of CD4 counts of the HIV infected subjects were taken through standard clinical laboratory operating procedures, as described previously.19 Briefly, patient samples were processed in the hospital clinical laboratory using standard 4-color flow cytometry on a Becton Dickinson FACSCalibur, using the MultiTEST reagents and TruCOUNT beads and analysed using MultiSET software to obtain CD4 counts.
Microfluidic flow experiments
In experiments performed to develop the prototype micro-device, 300 μl of unprocessed whole blood from healthy donors was introduced into the Hele–Shaw chambers at the desired shear rates (5–40 μl min−1) using a syringe pump (Harvard Apparatus PHD 2000, Holliston, MA). The volume of whole blood was chosen such that cell adhesion on the surfaces reaches a pseudo-steady state, where no significant increase of captured cells was observed as determined by both examining the number of cells adhered on the surfaces and the blood samples collected from the device outlet. Immediately after sample delivery, PBS containing 1% BSA (w/v) and 1 mM EDTA was flowed through the chamber at 40 μL min−1 for 5 min to rinse off the unbound cells. The cells were then fixed on the surfaces by incubating with 1% paraformaldehyde, followed with incubating with an antibody mixture containing AF647-anti-CD3/AF488-anti-CD4/PE-anti-CD14 for 15 min. After rinsing off the unbound antibody with PBS containing 1% BSA (w/v) and 1 mM EDTA, the number of adhered cells were counted by placing a field finder under the chambers and counting cells at select points along the device axis using an inverted microscope (Nikon Eclipse TE2000, Nikon, Japan). Monocytes were identified by staining with antibody to CD14, CD4+ T cells were recognized by CD3+/CD4+/CD14− staining, and the total number of adherent nucleated cells were determined by staining with DAPI or direct observation under the phase contrast microscope. For each point, three measurements were made, corresponding to three 1 mm2 squares in that vicinity, and averaged. Images were obtained at 10× magnification using fluorescein, rhodamine and Cy5 excitation/emission filters. DAPI staining was performed afterwards by incubating the surface-attached cells with 300 nM DAPI in PBS at room temperature for 5 min and rinsing with PBS. The cells were counted either manually or using Image J software (http://rsb.info.nih.gov/ij/). To avoid competitive binding between the capture antibody and the labelling antibody, CD4 antibodies were selected to bind to different epitopes.
In experiments performed to test the CD4 cell counting device, 10 μl of whole blood from healthy donors or HIV-infected subjects was flowed into linear chambers at the desired flow rates (1–20 μl min−1). After rinsing at a flow rate of 20 μl min−1 for at least 3 min using PBS containing 1% BSA and 1mM EDTA, cells adherent to the surface were stained using the same antibody mixture and DAPI solution as described above for Hele–Shaw devices. Three minutes of rinsing was noted as the minimal amount of time to wash away all unbound cells, and longer rinsing has not been found to affect captured cells. To determine CD4 counts from the microchips using HIV+ blood samples, the total number of adherent nucleated cells was counted throughout the device by enumeration of DAPI stained cells or direct observation under a phase contrast microscope. CD4 counts (cells l−1) were calculated by dividing the total cell number by 10, the volume of blood samples processed through the device in microlitres. Sample flow-through and rinse buffer were collected from the outlet of the device into Eppendorf tubes and centrifuged to concentrate the cells for flow cytometry.
Flow cytometry analysis
In order to confirm the efficiency of the devices in depleting target cells from whole blood, aliquots of samples before and after passage through the linear chamber devices were collected and analysed using standard flow cytometry to quantify the percentage of CD4+ T cells. The flow cytometric measurements were performed on a FACSCalibur (Beckton Dickinson Immunocytometry System (BDIS, San Jose, CA) instrument using BD CellQuest Pro Software. The capture efficiency, or yield of the device was estimated from the ratio of the percentage of CD3+ CD4+ T cells in samples collected before and after passing the microfluidic device.
Statistics and data analysis
The experiments performed with blood from healthy HIV-negative subjects were repeated in at least 3 different devices at each condition. Data shown in Figs. 2, 3 and 4 represent cell counts or flow cytometric measurements averaged over these devices, and each error bar represents the standard error of the mean.
Fig. 2.
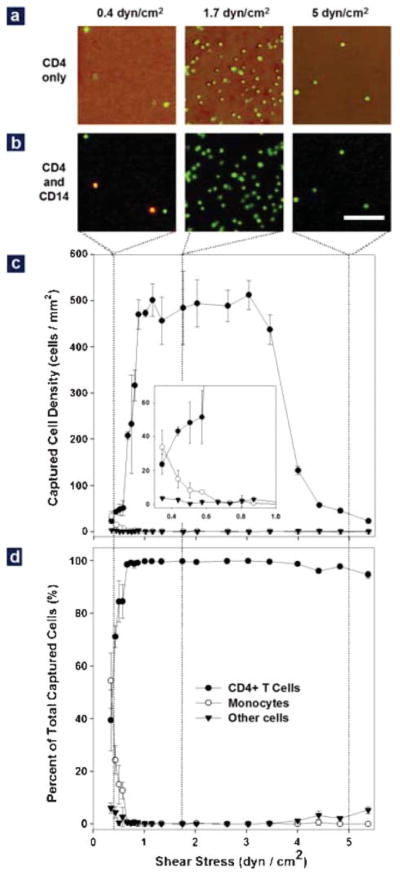
Effect of shear stress on cell adhesion in the Hele–Shaw devices using whole blood from healthy subjects. (a) Representative images of cells captured in the Hele–Shaw chamber at locations corresponding to shear stresses of 0.4 (left), 1.7 (middle) and 5 dyn cm−2 (right). The image was created by overlapping a phase contrast photograph and the corresponding fluorescence photograph. All the cells in the phase contrast image are stained positively (green) for the CD4 surface marker, but captured cell density is greatly dependent on the shear stress. (b) Representative images of captured cells after CD4 (green) and CD14 (red) staining at the shear stresses conditions as described in (a). Both lymphocytes (CD4+CD14−, green) and monocytes (CD4+CD14+, yellow) were captured at the shear stress of 0.5 dyn cm−2, but pure lymphocytes were captured at two higher shear stresses. (Bar: 100 μm) (c) Adhesion of CD4+ T cells (solid circles), monocytes (empty circles) and other cells (solid triangles) in response to shear stress. Differentiated capture of monocytes and lymphocytes in response to shear was observed: a shear stress window between 1 and 3 dyn cm−2 was optimal for CD4+ T cell adhesion, while monocyte adhesion drops significantly above 0.7 dyn cm−2 (inset). The adhesion of other cells is minimal in the whole range of tested shear stress. (d) Composition of the surface captured cells as a function of shear stress. When shear stress is above 0.7 dyn cm−2, >95% of the surface captured cells are CD4+ T cells (solid circles). The purity of these cells drops quickly to less than 50% when shear stress drops below 0.7 dyn cm−2. In (c) and (d), each data point was repeated in 3 devices spanning different shear stress ranges; error bars represent standard deviations in measurements within each experiment.
Fig. 3.
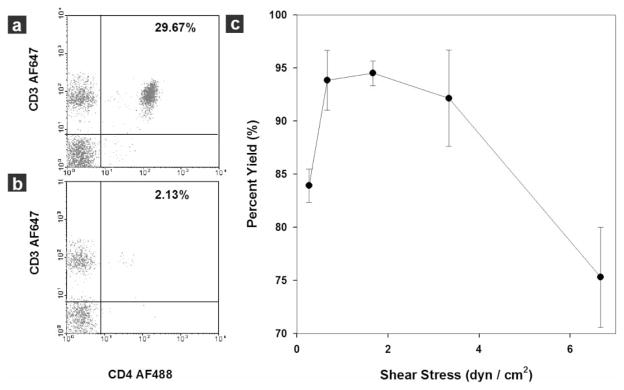
Dependence of capture yield on shear stress in a linear device evaluated by flow cytometry using 10 μL blood samples from healthy subjects. (a) Flow cytometric analysis of a blood sample before CD4+ T cell isolation. The CD4+ T cells (CD3+CD4+) compose 29.67% of all lymphocytes. (b) Flow cytometric analysis of the same blood sample after CD4+ T cell capture in the device. The composition of the target cells in the sample flow through dropped to 2.13% of all lymphocyte population after device capture. Ten microlitres of whole blood were injected into the linear device at a shear stress of 1.7 dyn cm−2. Cells were acquired in the gated lymphocyte population, and the quadrants were set up with an isotype-matched control. (c) Capture yield at different shear stress calculated from flow cytometric analysis. Nearly 95% of the target cells can be isolated from whole blood using shear stress in the range of 1 to 3 dyn cm−2. The yield quickly drops to less than 85% out of this range. Each data point was repeated in at least 3 devices. The error bars represent standard deviations in measurements within each experiment.
Fig. 4.
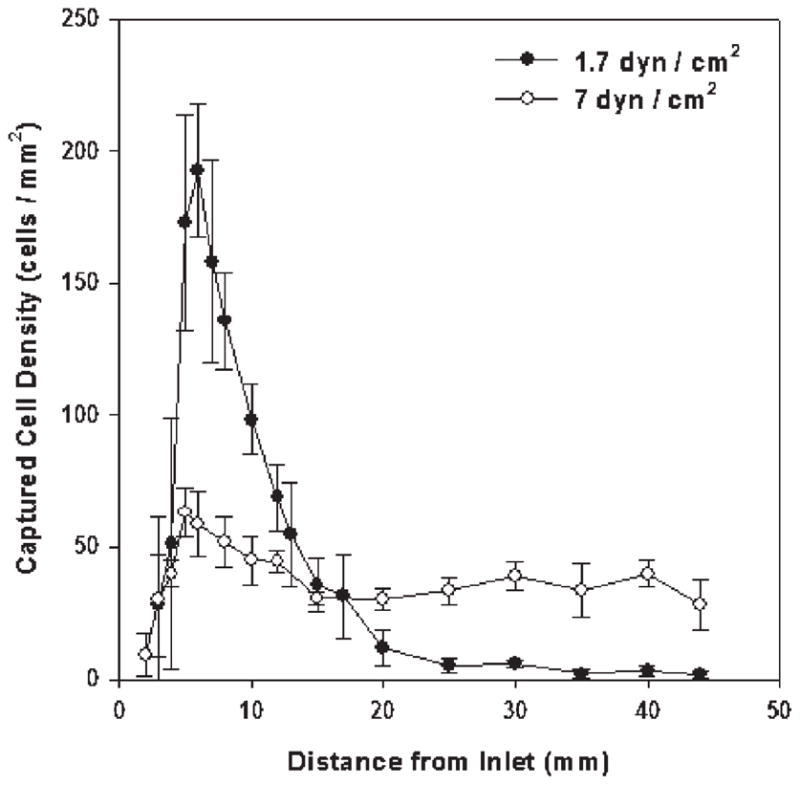
Distribution of CD4+ T cells along the linear cell capture chamber at two shear stresses. At 1.7 dyn cm−2 (solid circle, yield nearly 95%), captured cell density reaches maximum near the sample inlet. By contrast, at 7 dyn cm−2 (empty circle, yield ~ 75%), the distribution of cells is fairly uniform along the device. The experiments were performed using 10 μL of whole blood from healthy subjects. Each data point was repeated in at least 3 devices. The error bars represent standard deviations in measurements within each experiment.
Results
Development of a simple device for CD4+ cell separation from whole blood using affinity isolation chemistry
Using device simplicity and accuracy as our key objectives, we identified two key factors in our design criteria: the specificity (purity) and efficiency (yield) of CD4+ T cell capture in a label-free microfluidic device. We first tested how specific an anti-CD4-immobilized, BSA-blocked surface is in capturing CD4-presenting cells. Fig. 2a shows representative overlapped phase contrast images and anti-CD4 stained fluorescent images (green) of cells from whole blood obtained from a healthy, HIV-negative subject and adherent to anti-CD4 functionalized surfaces. As shown, almost all captured cells (density ~50–500 cells mm−2) stained positively for surface CD4 antigen. A control device lacking a specific cell capture antibody demonstrated 1–2 orders of magnitude lower cell attachment from whole blood (density < 5 cells mm−2). Thus, a surface functionalization scheme appeared successful in exclusively capturing CD4-presenting cells from unlabeled whole blood samples.
Monocyte versus CD4+ T lymphocyte adhesion from whole blood
In circulating cells, CD4 molecules are present on both lymphocytes and monocytes, which cannot be differentiated by immobilized anti-CD4 alone. This can be observed in Fig. 2b, where some of the CD4-presenting cells (stained green) also stain with the monocyte marker CD14 (stained red). Thus, for the purpose of enumerating CD4+ T cells alone, a secondary selection mechanism has to be used to exclude monocyte binding. We used shear stress for this purpose, considering the lower CD4 expression level on monocytes relative to CD4+ T cells, as well as their size differences. To study the effect of shear stress on monocyte and lymphocyte adhesion, we used antibody-functionalized Hele–Shaw devices (Fig. 1c), which allows for an analysis of cell adhesion over a range of shear stresses in a single experiment.23,27
Fig. 2c compares the adhesion profiles of monocytes (empty circles) and CD4+ lymphocytes (solid circles) within a shear stress range of 0.15 to 5 dyn cm−2. Maximum adhesion of CD4+ lymphocytes occurs in a shear stress window between 1 and 3 dyn cm−2. Within this region, roughly 500 cells adhered per square millimeter of area. The adhesion of CD4+ T cells decreases rapidly outside of this shear stress window. In contrast to lymphocyte adhesion on the anti-CD4 surface, monocytes have a different dependence on shear stress (inset in Fig. 2c). Monocyte adhesion drops from about 40 cells mm−2 to around 5 cells mm−2 when the shear stress increases from 0.3 to 0.7 dyn cm−2, and remains below 5 cells mm−2 when the shear stress is above 0.7 dyn cm−2. We also plotted the number of other cells (the total number of adherent cells minus monocytes and CD4+ T cells) adherent to the anti-CD4 surface (solid triangles in Fig. 2c). The non-specific cell number remained at a constant low level (<5 cells mm−2) throughout the tested shear stress range.
When the cell composition on the device surface is plotted (Fig. 2d), we observe that purity of surface captured CD4+ T lymphocytes is more than 95% when the shear stress is above 0.7 dyn cm−2. Purity drops at shear stress below 0.7 dyn cm−2, due mainly to the adhesion of monocytes under the low shear condition; purity also drops slightly above 4 dyn cm−2. Thus, shear stress is a powerful tool to differentiate specific adhesion of CD4+ T lymphocytes and monocytes.
Development of a cell counting device and determination of capture efficiency
In the initial experiments, we demonstrated highly selective capture of CD4+ T cells using a monoclonal antibody-functionalized surface operated under differential shear stress. Next, we designed a straight channel device for efficient isolation of CD4+ T lymphocytes under fixed shear stress within the shear stress range optimised for pure CD4+ T cell capture without contaminating monocytes (Fig. 1d). This simple device had an internal volume of 10 μL, which serves as a sample volume metering mechanism. The 10 μL volume allows for convenient delivery of a small-volume sample obtained from a study subject, and sufficient sample size for statistically valid cell counts. The elongated chamber design increases the interaction time of blood with the functional surface.
We injected 10 μL of whole blood at shear stresses ranging from 0.2–7 dyn cm−2 into the linear device, collected samples before and after flow through the chamber, and analysed them by flow cytometry to study the capture efficiency within this device. Representative quadrant analysis data from the lymphocyte window of blood samples before and after passage through the device at a shear stress of 1.7 dyn cm−2 are shown in Figs. 3a and b. In this representative experiment, CD4+ T lymphocytes (CD3+ CD4+) comprised 29.7% of all lymphocytes entering the microfluidic channel (Fig. 3a); after selective capture, this fraction dropped to 2.1% of lymphocytes exiting the device (Fig. 3b), indicating retention of more than 90% of the target CD4+ T cells within the device at this shear stress. Similar experiments were performed at various shear stresses to study the effect of shear stress on capture efficiency (or yield) of CD4+ T cells in the linear device (Fig. 3c). We observed that a shear stress window of 1–3 dyn cm−2 was optimal for efficient CD4+ T cell capture in the linear chamber, matching the results obtained using the Hele–Shaw chamber (Fig. 2c). Within this shear stress window, nearly 95% of the CD4+ T lymphocytes were isolated with purity greater than 95%. Outside of this window, capture efficiency quickly dropped to 70–80%, along with a decrease in purity (Fig. 3c).
When we evaluated cell distribution in devices operated at two shear stresses in and out of the optimal window, we observed differences that help to explain the mechanism for their distinctive capture efficiency (Fig. 4). At a shear of 1.7 dyn cm−2, which yielded 95% target cells, a narrow cell density peak of around 200 adherent cells mm−2 was seen within 10 mm from the device inlet; this density quickly dropped below 20 cells mm−2 at greater distances from the inlet. In contrast, at a less efficient shear of 7 dyn cm−2, surface-captured cells remain at a relatively constant, low density throughout the length of the chamber. Thus, controlled shear flow in a simple, anti-CD4 functionalized device promotes efficient and specific CD4+ T cell capture.
CD4 counts from HIV-infected subjects using optimised, simple microfluidic devices
After determining the optimal conditions for the device using blood from healthy donors, we next tested the devices using samples obtained from HIV+ adult subjects. A ten-microliter sample of blood was introduced for 2 min at 5 μL min−1, which corresponds to a shear stress of 1.7 dyn cm−2. Next, buffer was introduced at 20 μL min−1, which corresponds to a shear stress of ~7 dyn cm−2, to remove monocytes and non-specific cells. CD4 counts were then determined from the total number of adherent cells, counted manually under a phase contrast microscope; total assay time was under 10 min. We compared these CD4 counts from our microdevice with results obtained from samples processed in parallel by flow cytometry (Fig. 5). For 13 adult study subjects with CD4 counts ranging from 26 to 1428 cells μL−1 by flow cytometry, our results show a close correlation between the two methods at CD4 counts up to 800 cells μL−1 (n = 11, R2 = 0.93) respectively. At CD4 counts above 800 cells μL−1, the microdevice cell counts are significantly lower than those obtained by flow cytometry, which likely reflects saturation of cell binding within the chamber.
Fig. 5.
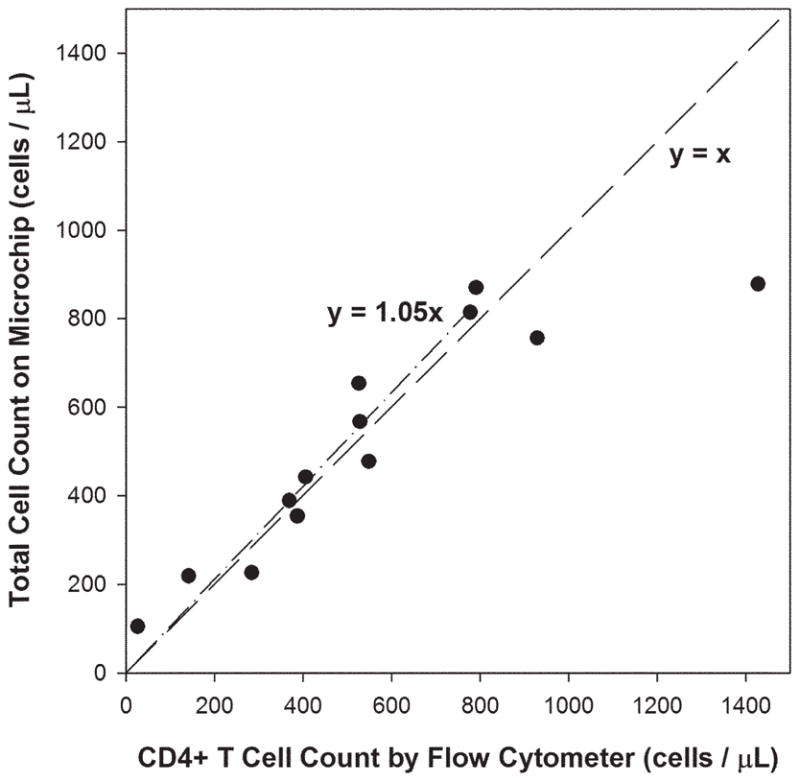
Correlation of total cell counts in the linear microchip versus absolute CD4 counts by flow cytometers, using whole blood from 13 HIV+ adult subjects. A linear regression of the experimental data for absolute CD4 counts under 800 cells μL−1 (n = 11) indicates good correlation between the two measurements (dash–dot line). The dash line represents an ideal 1 : 1 correlation between the two.
To confirm these findings, we assessed the purity and yield of CD4+ T cells in the linear device using whole blood from HIV-infected subjects (Fig. 6a and b). Purity (or capture specificity) was calculated by taking the ratio of CD4+ T cells (CD3+CD4+) to the total number of captured cells (DAPI+); yield (or capture efficiency) was defined as the ratio of captured CD4+ T cells to the sum of captured CD4+ T cells plus those lost in the flow through. For the 13 study subjects, a consistent yield (>75%) was observed for CD4 counts up to 800 cells μL−1; the yield started to drop for subjects with higher absolute CD4 counts. Purity ranged from 60–90% for CD4 counts above 200 cells μL−1. When the absolute CD4 count is below 200 cells μL−1, poorer capture specificity was observed (20–50%). Nevertheless, a clear cutoff was observed for CD4 counts around 200 cells μL−1, which is used clinically to discriminate relevant CD4 count thresholds. We also observed that >90% of the non-target cells are monocytes (data not shown), which in the context of HIV infection may be more adherent to an anti-CD4 functionalized surface than monocytes from uninfected blood.
Fig. 6.

Purity and yield of captured CD4+ T lymphocytes in the linear cell count device using whole blood from 13 HIV-positive adult subjects. (a) Purity of the surface captured CD4+ T cells as a function of the absolute CD4 counts. Purity was above 60% and fairly consistent for absolute CD4 counts greater than 200 cells μL−1. (b) Yield of CD4+ T cells within the linear device as a function of the absolute CD4 counts. Fairly consistent yield was observed for absolute CD4 counts up to 800 cells μL−1. The dashed lines are drawn as a visual guide.
Discussion
We describe here a whole blood CD4+ T lymphocyte count assay using cell affinity chromatography in a microfluidic format. The device was functionalized with a specific antibody for affinity selection of target cells. Controlled shear stress applied in the microfluidic channel enabled specific and efficient selection of CD4+ T cells versus monocyte and other white blood cells from a small volume sample compatible with fingerprick collection. To perform CD4 counts, 10 μL of unprocessed whole blood is injected into the microfluidic channel at a controlled flow rate and CD4+ T cell counts are determined as the number of all captured cells using a light microscope. The total assay time is less than 10 minutes.
One critical factor for accurate CD4 counting using this approach is the specificity of cell capture. To achieve this, we used cell affinity chromatography with immobilized antibodies, which are further blocked with BSA to reduce non-specific binding.28 Since CD4 is also expressed on monocytes, we used shear stress as a secondary selection step to exclude monocytes. We found that CD4+ T lymphocytes and monocytes respond differently to shear stress on the functionalized device surface, as preferential binding of lymphocytes occurs in a window of 1–3 dyn cm−2; by contrast, monocytes bind optimally at lower shear stresses. Selective binding within this window (1–3 dyn cm−2) may be accounted for by two reasons. First, compared to lymphocytes, monocytes express about an order of magnitude less surface CD4, which reduces the chance of antibody–antigen interaction, especially under dynamic flow conditions.29 Second, the larger size of monocytes increases the shear force exerted on individual cells (which is roughly proportional to the square of cell diameter), resulting in decreased binding efficacy. These two factors allow for differential binding of lymphocytes relative to monocytes. Controlled shear stress is also shown to be critical for efficient cell capture. The capture efficiency is further promoted by the elongated channel geometry, which increases the interaction time between target cells and the active surface area.
Within the optimal lymphocyte-binding window (1–3 dyn cm−2), the shear force exerted on a cell 10 μm in diameter is ~8–25 pN. This is of the same order as the binding force of a single antibody–antigen pair.30,31 When the shear force is above this level, up to two orders of magnitude drop in cell adhesion is observed. This observation implies that when target cells come into contact with the surface, cell–substrate attachment is initiated by the formation of a single antibody–antigen interaction32 and high membrane antigen density will favor the opportunity of such interaction. A somewhat surprising result was that the number of adherent cells also decreases when the shear is dropped below 1 dyn cm−2. This decrease occurred when experiments were performed with whole blood, but not with lysed blood (data not shown). We speculate that erythrocytes play an important role in the reduction of target cell binding at the low shear stress range. Erythrocytes have been known to induce margination of leukocyte flow in capillaries above certain flow rates.33,34 In our devices, margination is analogous to pushing the leukocytes to the floor and roof of the chamber. At low flow rates, the margination effect is not favored and the erythrocytes in whole blood could occupy most of the functional surface and prevent antibody–antigen interactions. In lysed blood, cell–cell interaction is greatly reduced and leukocyte settling is driven mainly by sedimentation, which does not decrease with reduced flow.
After the single channel device was optimized with blood from healthy donors (95%+ purity and 90%+ yield), its performance was tested with whole blood from HIV-infected subjects. We found a slight decrease in the device performance with samples from these subjects, which may be accounted for by several reasons. Interfering soluble factors in the serum of HIV-infected patients, such as soluble CD4,35 may compromise the yield of captured cells. Other soluble factors including cytokines, chemokines and immune complexes36 may influence behavior of blood cells.37–39 Leukocyte surface adhesion molecules may be altered during HIV disease progression,36,40 which may lead to elevated non-specific binding in our device. Changes on CD4+ T cell surfaces in HIV-infected subjects, such as down-regulation of CD4 receptors41 and binding of gp120,42 might also reduce the receptor–antibody interaction and decrease yield. Thus, it was not surprising to see both purity and yield drop when samples from HIV-infected subjects were tested in the linear chamber device. Nonetheless, a linear relationship was observed for CD4 counts obtained by microchip and by flow cytometer in the clinically relevant range between 200 and 800 cells μL−1. Thus, the microfluidic device appears to be extremely useful for clinical decision-making and disease monitoring in resource-limited settings. Further optimization of purity and yield should lead to even higher levels of accuracy.
The application of a microfluidic device for CD4 counting offers the advantages of reduced sample volume, decreased reagent consumption, low fabrication cost and portability over conventional flow cytometric equipment. It uses a direct volumetric method and functions as a single platform. Moreover, no reagents need to be added to the assay, as required in single-platform flow cytometry and other proposed methods. Compared to the labor-intensive bead format assay and previously described miniaturized flow cell design,19 this microfluidic CD4 counting device directly addresses the sample preparation challenge faced in most resource-poor settings. No sample preparation, such as lysing erythrocytes, pipetting, or mixing with antibody reagents is required, so the device serves as a self-contained system. No differentiation of monocytes from CD4+ T lymphocytes needs to be made during microscope-based counting. All these advantages directly address the need of CD4 counting in a resource-limited setting.
Conclusions
We demonstrate a simple, quick and inexpensive CD4+ T cell counting device based on microfluidic cell affinity chromatography operated under controlled shear stress. To our knowledge, this is the first design with which CD4 counts can be performed from a fingerprick sample of whole blood, without either sample processing or the addition of reagents. Minimum handling procedures, rapid operation, simple device design and potential high-throughput detection makes this strategy a promising candidate for managing HIV patients in resource-limited settings. We also note that CD4 counting is just one application for devices of this type. The demonstration of specific cell isolation with high efficiency using shear stress combined with cell affinity chromatography could be applied to a number of applications where specific and efficient cell isolation is required.
Acknowledgments
We thank Dr Shashi Murthy for help with the surface modification protocol, Mr Octavio Hurtado for technical support with the microfabrication procedures and Mr Donald Poulsen for the schematic illustration. This work was partially supported by the National Institute of Biomedical Imaging and Bioengineering under Grant No. P41 EB002503 (BioMEMS Resource Center). Dr William Rodriguez was supported by grants from the National Institutes of Health, the Bill and Melinda Gates Foundation, and the Doris Duke Charitable Foundation.
Contributor Information
William Rodriguez, Email: wrodriguez@partners.org.
Mehmet Toner, Email: mtoner@sbi.org.
References
- 1.Joint United Nations Programme on HIV/AIDS. World Health Organization; Dec, 2005. [accessed 20th March 2006]. AIDS Epidemic Update: December 2005. available at http://libdoc.who.int/unaids/2005/929173439X_eng.pdf. [Google Scholar]
- 2.Guidelines for the Use of Antiretroviral Agents in HIV-1-Infected Adults and Adolescents. Department of Health and Human Services; Oct 6, 2005. [accessed 20th March 2006]. available at http://aidsinfo.nih.gov/ContentFiles/AdultandAdolescentGL.pdf. [Google Scholar]
- 3.Obrien WA, Hartigan PM, Daar ES, Simberkoff MS, Hamilton JD. Ann Intern Med. 1997;126:939–945. doi: 10.7326/0003-4819-126-12-199706150-00002. [DOI] [PubMed] [Google Scholar]
- 4.Mellors JW, Munoz A, Giorgi JV, Margolick JB, Tassoni CJ, Gupta P, Kingsley LA, Todd JA, Saah AJ, Detels R, Phair JP, Rinaldo CR. Ann Intern Med. 1997;126:946–954. doi: 10.7326/0003-4819-126-12-199706150-00003. [DOI] [PubMed] [Google Scholar]
- 5.Obrien WA, Hartigan PM, Martin D, Esinhart J, Hill A, Benoit S, Rubin M, Lahart C, Wray N, Finegold SM, George WL, Dickinson GM, Klimas N, Diamond G, ZollaPazner SB, Jensen PC, Hawkes C, Oster C, Gordin F, Labriola AM, Spivey P, Matthews T, Weinhold K, Drusano G, Egorin MJ. N Engl J Med. 1996;334:426–431. doi: 10.1056/NEJM199602153340703. [DOI] [PubMed] [Google Scholar]
- 6.Selection and Procurement of HIV/AIDS Diagnostics; PAHO Technical Advisory Committee; January 2005; [accessed 20th March 2006]. available at http://www.paho.org/english/ad/fch/ai/Clinton%20HIV%20Initiative-Selection%20&%20Procurement.pdf. [Google Scholar]
- 7.Centers for Disease Control and Prevention Revised classification for HIV infection and expanded surveillance case definition for AIDS among adolescents and adults. MMWR Morbidity and Mortality Weekly Report. 1992:1–19. [PubMed] [Google Scholar]
- 8.Patient Monitoring Guidelines for HIV Care and ART. World Health Organization; Nov 4, 2005. [accessed 20th March 2006]. available at http://www.who.int/hiv/pub/guidelines/patientmonitoring.pdf. [Google Scholar]
- 9.Progress on Global Access to HIV Antiretroviral Therapy: An update on “3 by 5”. World Health Organization; Jun, 2005. [accessed 20th March 2006]. available at http://www.who.int/3by5/fullreportJune2005.pdf. [Google Scholar]
- 10.Balakrishnan P, Dunne M, Kumarasamy N, Crowe S, Subbulakshmi G, Ganesh AK, Cecelia AJ, Roth P, Mayer KH, Thyagarajan SP, Solomon S. J Aquir Immune Defic Syndr. 2004;36:1006–1010. doi: 10.1097/00126334-200408150-00002. [DOI] [PubMed] [Google Scholar]
- 11.Strauss K, Hannet I, Engels S, Shiba A, Ward DM, Ullery S, Jinguji MG, Valinsky J, Barnett D, Orfao A, Kestens L. Cytometry. 1996;26:52–59. doi: 10.1002/(SICI)1097-0320(19960315)26:1<52::AID-CYTO8>3.0.CO;2-I. [DOI] [PubMed] [Google Scholar]
- 12.Dieye TN, Vereecken C, Diallo AA, Ondoa P, Diaw PA, Camara M, Karam F, Mboup S, Kestens L. J Aquir Immune Defic Syndr. 2005;39:32–37. doi: 10.1097/01.qai.0000160515.20581.ad. [DOI] [PubMed] [Google Scholar]
- 13.Josefowicz SZ, Buchner L, Epling CL, Sinclair E, Bredt B. Cytometry, Part A. 2004;59A:124–124. [Google Scholar]
- 14.Crowe S, Turnbull S, Oelrichs R, Dunne A. Clin Infect Dis. 2003;37:S25–S35. doi: 10.1086/375369. [DOI] [PubMed] [Google Scholar]
- 15.Carriere D, Vendrell JP, Fontaine C, Jansen A, Reynes J, Pages I, Holzmann C, Laprade M, Pau B. Clin Chem. 1999;45:92–97. [PubMed] [Google Scholar]
- 16.Diagbouga S, Durand G, Sanou PT, Dahourou H, Ledru E. Trop Med Int Health. 1999;4:79–84. doi: 10.1046/j.1365-3156.1999.00362.x. [DOI] [PubMed] [Google Scholar]
- 17.Lyamuya EF, Kagoma C, Mbena EC, Urassa WK, Pallangyo K, Mhalu FS, Biberfeld G. J Immunol Methods. 1996;195:103–112. doi: 10.1016/0022-1759(96)00094-4. [DOI] [PubMed] [Google Scholar]
- 18.Pacifici R, Zuccaro P, Cozzi-Lepre A, Di Carlo S, Bacosi A, Fattorossi A. Clin Biochem. 1998;31:165–172. doi: 10.1016/s0009-9120(98)00011-3. [DOI] [PubMed] [Google Scholar]
- 19.Rodriguez WR, Christodoulides N, Floriano PN, Graham S, Mohanty S, Dixon M, Hsiang M, Peter T, Zavahir S, Thior I, Romanovicz D, Bernard B, Goodey AP, Walker BD, McDevitt JT. PLoS Med. 2005;2:663–672. doi: 10.1371/journal.pmed.0020182. [DOI] [PMC free article] [PubMed] [Google Scholar]
- 20.Toner M, Irimia D. Annu Rev Biomed Eng. 2005;7:77–103. doi: 10.1146/annurev.bioeng.7.011205.135108. [DOI] [PMC free article] [PubMed] [Google Scholar]
- 21.Sato K, Hibara A, Tokeshi M, Hisamoto H, Kitamori T. Adv Drug Delivery Rev. 2003;55:379–391. doi: 10.1016/s0169-409x(02)00225-9. [DOI] [PubMed] [Google Scholar]
- 22.Chovan T, Guttman A. Trends Biotechnol. 2002;20:116–122. doi: 10.1016/s0167-7799(02)01905-4. [DOI] [PubMed] [Google Scholar]
- 23.Murthy SK, Sin A, Tompkins RG, Toner M. Langmuir. 2004;20:11649–11655. doi: 10.1021/la048047b. [DOI] [PubMed] [Google Scholar]
- 24.Sin A, Murthy SK, Revzin A, Tompkins RG, Toner M. Biotechnol Bioeng. 2005;91:816–826. doi: 10.1002/bit.20556. [DOI] [PubMed] [Google Scholar]
- 25.Yi CQ, Li CW, Ji SL, Yang MS. Anal Chim Acta. 2006;560:1–23. [Google Scholar]
- 26.Andersson H, van den Berg A. Sens Actuators, B. 2003;92:315–325. [Google Scholar]
- 27.Usami S, Chen HH, Zhao YH, Chien S, Skalak R. Ann Biomed Eng. 1993;21:77–83. doi: 10.1007/BF02368167. [DOI] [PubMed] [Google Scholar]
- 28.Amiji M, Park K. J Biomater Sci, Polym Ed. 1993;4:217–234. doi: 10.1163/156856293x00537. [DOI] [PubMed] [Google Scholar]
- 29.Lee B, Sharron M, Montaner LJ, Weissman D, Doms RW. Proc Natl Acad Sci U S A. 1999;96:5215–5220. doi: 10.1073/pnas.96.9.5215. [DOI] [PMC free article] [PubMed] [Google Scholar]
- 30.Harada Y, Kuroda M, Ishida A. Langmuir. 2000;16:708–715. [Google Scholar]
- 31.Hinterdorfer P, Baumgartner W, Gruber HJ, Schilcher K, Schindler H. Proc Natl Acad Sci U S A. 1996;93:3477–3481. doi: 10.1073/pnas.93.8.3477. [DOI] [PMC free article] [PubMed] [Google Scholar]
- 32.Tissot O, Pierres A, Foa C, Delaage M, Bongrand P. Biophys J. 1992;61:204–215. doi: 10.1016/S0006-3495(92)81827-1. [DOI] [PMC free article] [PubMed] [Google Scholar]
- 33.Goldsmith HL, Spain S. Microvasc Res. 1984;27:204–222. doi: 10.1016/0026-2862(84)90054-2. [DOI] [PubMed] [Google Scholar]
- 34.Shevkoplyas SS, Yoshida T, Munn LL, Bitensky MW. Anal Chem. 2005;77:933–937. doi: 10.1021/ac049037i. [DOI] [PMC free article] [PubMed] [Google Scholar]
- 35.Peakman M, Senaldi G, Foote N, McManus TJ, Vergani D. J Infect Dis. 1992;165:799–804. doi: 10.1093/infdis/165.5.799. [DOI] [PubMed] [Google Scholar]
- 36.Trial JA, Birdsall HH, Hallum JA, Crane ML, Rodriguezbarradas MC, Dejong AL, Krishnan B, Lacke CE, Figdor CG, Rossen RD. J Clin Invest. 1995;95:1690–1701. doi: 10.1172/JCI117845. [DOI] [PMC free article] [PubMed] [Google Scholar]
- 37.Polo S, Veglia F, Malnati MS, Gobbi C, Farci P, Raiteri R, Sinicco A, Lusso P. AIDS. 1999;13:447–454. doi: 10.1097/00002030-199903110-00002. [DOI] [PubMed] [Google Scholar]
- 38.Vonsydow M, Sonnerborg A, Gaines H, Strannegard O. Aids Res Hum Retrov. 1991;7:375–380. doi: 10.1089/aid.1991.7.375. [DOI] [PubMed] [Google Scholar]
- 39.Clerici M, Hakim FT, Venzon DJ, Blatt S, Hendrix CW, Wynn TA, Shearer GM. J Clin Invest. 1993;91:759–765. doi: 10.1172/JCI116294. [DOI] [PMC free article] [PubMed] [Google Scholar]
- 40.Trial J, Rubio JA, Birdsall HH, Rodriguez-Barradas M, Rossen RD. J Immunol. 2004;173:2190–2198. doi: 10.4049/jimmunol.173.3.2190. [DOI] [PubMed] [Google Scholar]
- 41.Anderson S, Shugars DC, Swanstrom R, Garcia JV. J Virol. 1993;67:4923–4931. doi: 10.1128/jvi.67.8.4923-4931.1993. [DOI] [PMC free article] [PubMed] [Google Scholar]
- 42.Thali M, Furman C, Helseth E, Repke H, Sodroski J. J Virol. 1992;66:5516–5524. doi: 10.1128/jvi.66.9.5516-5524.1992. [DOI] [PMC free article] [PubMed] [Google Scholar]