

Abstract
Increased neuronal synthesis of transthyretin (TTR) may favorably impact on Alzheimer's disease (AD) because TTR has been shown to inhibit Aβ aggregation and detoxify cell-damaging conformers. The mechanism whereby hippocampal and cortical neurons from AD patients and APP23 AD model mice produce more TTR is unknown. We now show that TTR expression in SH-SY5Y human neuroblastoma cells, primary hippocampal neurons and the hippocampus of APP23 mice, is significantly enhanced by heat shock factor 1 (HSF1). Chromatin immunoprecipitation (ChIP) assays demonstrated occupation of TTR promoter heat shock elements by HSF1 in APP23 hippocampi, primary murine hippocampal neurons, and SH-SY5Y cells, but not in mouse liver, cultured human hepatoma (HepG2) cells, or AC16 cultured human cardiomyocytes. Treating SH-SY5Y human neuroblastoma cells with heat shock or the HSF1 stimulator celastrol increased TTR transcription in parallel with that of HSP40, HSP70, and HSP90. With both treatments, ChIP showed increased occupancy of heat shock elements in the TTR promoter by HSF1. In vivo celastrol increased the HSF1 ChIP signal in hippocampus but not in liver. Transfection of a human HSF1 construct into SH-SY5Y cells increased TTR transcription and protein production, which could be blocked by shHSF1 antisense. The effect is neuron specific. In cultured HepG2 cells, HSF1 was either suppressive or had no effect on TTR expression confirming the differential effects of HSF1 on TTR transcription in different cell types.
Keywords: Alzheimer's disease, celastrol, heat shock, HSF1, transgenics, transthyretin
Introduction
The majority of cortical and hippocampal neurons in human Alzheimer's disease (AD) and APP23 transgenic mouse model brains stain with antibodies to transthyretin (TTR) (Schwarzman and Goldgaber, 1996; Stein and Johnson, 2002; Li et al., 2011). Studies in transgenic models of human Aβ deposition have indicated that TTR suppresses the AD-like neuropathologic changes characteristic of the disease (Stein et al., 2004; Choi et al., 2007; Buxbaum et al., 2008b). In vitro experiments have documented interactions between TTR and Aβ1–40/1–42, which result in inhibition of Aβ aggregation and cytotoxicity (Giunta et al., 2005; Liu and Murphy, 2006; Costa et al., 2008; Du and Murphy, 2010; Du et al., 2012; Cascella et al., 2013). Hence, neuronal TTR expression could represent a cellular defense to aggregated Aβ or reactive oxygen species that are part of the neurodegenerative process.
Heat shock factor 1 (HSF1), the major regulator of cellular stress responses, is a post-translationally regulated stimulator of transcription of chaperones, chaperone-like proteins, and a variety of molecules responsible for rapid cellular responses to multiple environmental stresses including heat (Calabrese et al., 2010). Cytoplasmic HSF1 is a monomer, in complex with an inhibitor, perhaps Hsp70 and/or Hsp90 (Raychaudhuri et al., 2014). It is released on exposure to stress and trimerizes and translocates to the nucleus where it binds to heat shock elements (HSEs) in the promoters of its target genes (Morimoto et al., 1997; Morimoto, 1998; Neef et al., 2011). Activation does not require synthesis of new HSF protein. Post-translational modifications may vary in different cells. Silencing the Hsf1 gene in mice has pleiotropic effects, including failure to induce heat shock protein (Hsp40, Hsp70, Hsp90) expression in response to stress (McMillan et al., 1998; Zhang et al., 2002; Homma et al., 2007). Studies in yeast, Drosophila melanogaster, HeLa, HT1080, HEK293, mouse embryo fibroblasts, and a variety of tumor cells have revealed that HSF1 has multiple targets in addition to the classical heat shock proteins (Hahn et al., 2004; Trinklein et al., 2004; Page et al., 2006; Mendillo et al., 2012; Ryno et al., 2014). None of the studies suggested that TTR was subject to regulation by HSF1. The promoter regions of genes regulated by HSF1 contain one or more HSEs with at least three nGAAn repeats (Perisic et al., 1989; Anckar and Sistonen, 2011). The presence of such sequences in both the human and murine TTR promoter regions suggested that HSF1-driven increased TTR expression could play a role in its apparent neuroprotective activity (Stein and Johnson, 2002; Buxbaum et al., 2008b; Li et al., 2011).
The experiments reported here examine the effect of HSF1 on TTR gene expression and protein production in cultured human cells of hepatic, neuronal, and cardiac origin and in murine liver and hippocampus in vivo. The cell lines were chosen to represent liver, the major site of systemic TTR synthesis in vivo (HepG2, HuH-7), heart, a tissue that is a target of TTR deposition in the systemic TTR amyloidoses, and is not known to synthesize TTR (AC16) and the tissue of primary interest (SH-SY5Y neuroblastoma cells) representing a cell lineage that is the target of neurodegenerative disease.
Materials and Methods
Genomic sequence analysis.
Searches for potential transcription factor binding sites in both the human and murine Ttr promoter sequences were performed using Jaspar, Transcription Element Search System, and Transcription Factor Finder online databases (Schug, 2008; Cui et al., 2010; Portales-Casamar et al., 2010).
Animals and drug treatment.
C57BL/6J, APP23, APP23/Ttr−/− (APP23 mice on Ttr knock-out background) mouse strains were established and maintained as described previously according to a protocol approved by the institutional animal care and use committee at The Scripps Research Institute (Buxbaum et al., 2008b). Ttr−/− mice were obtained from M. Gottesman (Columbia University College of Physicians and Surgeons, New York) (Episkopou et al., 1993). Male mice were used in all the in vivo experiments.
The in vivo effects of celastrol were assessed in 13-week-old C57BL/6J mice injected intraperitoneally (1 mg/kg body weight) with celastrol (n = 5) or with 100 μl of vehicle (35% DMSO in PBS, n = 5) daily for 4 d (Paris et al., 2010). One hour after the last injection, hippocampus and livers of the animals were collected, snap frozen in liquid nitrogen, and stored at −80°C.
Cell culture.
SH-SY5Y human neuroblastoma cells (Biedler et al., 1973; Montgomery et al., 1983), obtained from the ATCC, were cultured in DMEM/F12 (1:1) medium (Invitrogen), supplemented with 10% (v/v) FBS, 50 U/ml penicillin, and 100 μg/ml streptomycin, as were the AC16 human cardiomyocyte-derived cells obtained from Dr. M. Davidson, Columbia University College of Physicians and Surgeons (Davidson et al., 2005). HepG2 (Knowles et al., 1980) cells and HuH-7 (Nakabayashi et al., 1982) cells, from human hepatocarcinomas, were grown in DMEM with the same supplements as the SH-SY5Y cells.
Heat shock treatment.
Cells were subjected to heat shock by incubation at 42°C in a water bath from 30 min to 2 h before RNA extraction.
Celastrol treatment.
Cells were treated with different concentrations (range, 1–6 μm) of the HSF1 activator celastrol or with the same volume of vehicle for 24 h. After treatment, the cells were collected and RNA extracted using the RNeasy Plus Mini Kit (QIAGEN).
Primary neuron cultures.
Primary hippocampal neuron cultures were established from C57BL/6J and APP23 mice, following previously established protocols (Kaech and Banker, 2006; Li et al., 2011). For transfection experiments, 7 d in vitro (DIV7) neurons were used.
Plasmid preparation and transfection.
A novel, Gaussia luciferase-based transcriptional reporter construct was generated by replacing the firefly luciferase gene in the promoterless pGL4.17 vector (Promega) with an enhanced Gaussia luciferase (GLuc) (eGLuc2) gene (mutated at two oxidation-prone methionines, M43I and M110I), creating pGL4.17-eGLuc2 (Hulleman et al., 2011). A 2 kb fragment of the human TTR promoter region immediately upstream of the initiation codon was inserted into the pGL4.17 vector and used to drive eGLuc2 transcription (pGL4.17-TTR-eGLuc2) (Hulleman et al., 2011). Single clone colonies of SH-SY5Y or HuH-7 cells harboring the pGL4.17-TTR-eGLuc2 plasmid were generated by transfection according to the manufacturer's protocol (X-tremeGENE 9, Roche), followed by selection in G418. The stable SH-SY5Y or HuH-7 cell lines were propagated in media supplemented with G418 (400 μg/ml). All cell lines were maintained in a humidified atmosphere of 95% air and 5% CO2 at 37°C.
Plasmids containing constitutively active HSF1 and short hairpin antisense HSF constructs were obtained from Professor Richard Morimoto, Northwestern University (Zuo et al., 1995).
GLuc luminescence assay of TTR promoter activity.
The luminescence assay was performed as previously described (Hulleman et al., 2012). The secretion of eGLuc2 was monitored by adding 50 nl of substrate diluted in 10 μl of neat GLuc buffer (BioLux Gaussia Luciferase Assay Kit; New England Biolabs) to 45 μl aliquots of conditioned media (typically ∼1/10 of the total volume). Immediately after mixing, luminescence was measured in a 96-well Costar flat-bottomed black assay plate (Corning) in a Safire II microplate reader (Tecan). For celastrol treatment, we normalized the luminescence results using total cell protein as determined by a Bradford assay (Bio-Rad) according to the manufacturer's instructions.
Chromatin immunoprecipitation (ChIP) analysis.
ChIP was performed on the HepG2, AC16, or SH-SY5Y cell lines and on extracts of hippocampus dissected free of choroid plexus and livers of the same mice. For analysis of transcription factor binding site occupancy on the TTR promoter, nuclear proteins were cross-linked to the DNA with 1% formaldehyde. Antibodies for HNF1 (sc-8986, Santa Cruz Biotechnology) and HSF1 (sc-17757, Santa Cruz Biotechnology) were used with magnetic protein A/G beads to immunoprecipitate the protein-DNA complexes. As a control, samples were immunoprecipitated with 5 μg nonimmune mouse IgG or anti-RNA polymerase II (Millipore Biotechnology). A protocol suggested by the manufacturer (Millipore Biotechnology) for ChIP was used, with some modifications. The beads were washed and eluted, and the cross-linked protein/DNA complexes were dissociated by heating at 62°C for 2 h with shaking. The chromatin DNA was purified using a spin column. The DNA fragments were analyzed by qPCR, using primer pairs designed to amplify the region on the TTR promoter surrounding the specific transcription factor (TF) binding site identified in the analysis. The amount of input DNA used in each reaction was normalized using a primer set designed to recognize the exon 1 of the GAPDH gene before immunoprecipitation. All reactions were performed in triplicate with samples derived from three experiments.
Positive primers provided controls for successful ChIP and gene transcription. In the HSF1 ChIP experiments, we used the human or murine Hsp70.1 promoter as a positive control. Negative primers provided a reference for the amount of nonspecific genomic DNA that coimmunoprecipitates during the procedure. In this protocol, we used ChIP-qPCR Human 1GX1A Negative Control primer (GPH 00001C (−) 01A, SA Biosciences; all primer sequences are available upon request).
Real-time qPCR.
qPCRs were performed in a total volume of 10 μl containing 1 μg of reverse-transcribed RNA, 5 μl of FastStart Univ Syber Green Master (Rox) (Roche), 300 nm forward and reverse primers. The primers to amplify the human genes were as follows: β-Actin, forward 5′-CCATCATGAAGTGTGACGTGG-3′ and reverse 5′-GTCCGCCTAGAAGCATTTGCG-3′; TTR, forward 5′-ATGGCTTCTCATCGTCTGCT-3′ and reverse 5′-TGTCATCAGCAGCCTTTCTG-3′; HSP90, forward 5′-ACCGATTGGTGACATCTCCATGCT-3′ and reverse 5′-CCAGGTGTTTCTTTGCTGCCATGT-3′; HSP40, forward 5′-CCCTCATGCCATGTTTGCTGAGTT-3′ and reverse 5′-CCAAAGTTCACGTTGGTGAAGCCA-3′; HSP70, forward 5′-AGAGCCGAGCCGACAGAG-3′ and reverse 5′-CACCTTGCCGTGTTGGAA-3′; HSF1, forward 5′-CCGGCGGGAGCATAGACGAGAGG-3′ and reverse 5′-GACGGAGGCGGGGGCAGGTTCACT-3′. The primers used to amplify the mouse genes were as follows: β-Actin, forward 5′-CAACGAGCGGTTCCGATG-3′ and reverse 5′-GCCACAGGATTCCATACCCA-3′; TTR, forward 5′- AAAAGACCTCTGAGGGATCCT-3′ and reverse 5′-GGTACAAATGGGATGCTACTGC-3′; HSF1, forward 5′-AGTGGGAACAGCTTCCACG-3′ and reverse 5′-CCACGCAAGAAACAAGGATGC-3′. qPCR amplifications were performed using the Opticon Monitor 3 Detection System (Bio-Rad), and the data were analyzed with iCycler iQ software (Bio-Rad).
Measurement of TTR production in cultured cells by ELISA.
Cells were grown to a density of ∼8 × 10⁶ cells/15 cm plate. Medium and detached cells were removed, and the cell layer washed twice with PBS. Reduced-serum OPTI-MEM was added, and the cells were incubated at 37°C for 24–48 h. The medium from SH-SY5Y cells was collected, centrifuged (1000 × g, 10 s, 4°C) to pellet-detached cells and large debris, then concentrated by Millipore Ultra-4 centrifugal filter units (4000 × g, 30 s, 4°C). No media concentration step was necessary for HepG2 or HuH-7 cells. ELISA plates (Immulon 4 HBX 96-well plates) were coated with rabbit antihuman TTR antibody (Dako A0002, 1:1000) in 50 mm carbonate buffer, pH 9.6, overnight at 4°C (Buxbaum et al., 2008a). The plates were then washed with 25 mm Tris, 75 mm NaCl, 0.05% Tween 20, pH 7.5 (TBST) 5 times with 200 μl and blocked with 200 μl/well of 5% nonfat dry milk in TBST. Standards were prepared with recombinant wild-type (WT) human TTR diluted in blocking buffer. Samples were diluted in blocking buffer if necessary. The standards and samples were added to each well in triplicate (100 μl), covered, and incubated for 1.5 h at 37°C. Plates were then washed with TBST buffer using a SkanWasher 300. Conjugated antibody (goat antihuman prealbumin alkaline phosphatase, EY Laboratories, AA-2112-1) was diluted 1:1000, and 100 μl was added to each well and incubated at 37°C for 1.5 h. The plate was washed with TBST and 100 μl of NPP substrate (2 mg/ml in 10 mm diethanolamine, 0.5 mm MgCl2, pH 9.8) was added and the plate placed in the dark for 15–30 min and then read at 405 nm, using a Spectramax 384 Plus (Molecular Devices) and SoftmaxPro software (Buxbaum et al., 2008a). The TTR concentration was normalized for the number of cultured cells, using the amount of DNA extracted from the attached cells to provide an estimate of the amount of TTR secreted per cell per time of incubation.
Electrophoretic mobility shift assay (EMSA).
EMSAs were performed to measure the DNA-binding ability of heat induced purified HSF1 (Abcam) using in vitro reactions containing purified recombinant HSF1 and double-stranded PCR-based oligonucleotide probes specific for HSEs in the promoter of the hTTR target gene (for sequence location information, see Fig. 2A). A total of 2–5 μl of the in vitro heat shock reaction (250 ng purified HSF1 protein at 35°C for 30 min) was incubated in a total volume of 10 μl at room temperature for 30 min in a buffer containing 10 mm Tris, pH 7.4, 150 mm KCl, 0.1 mm DTT, 0.1 mm EDTA, and a 40 ng double-stranded oligonucleotide. A total of 10 μl of the EMSA reaction was loaded onto a native 6% polyacrylamide gel, and electrophoresis was performed in 0.5× TBE buffer at room temperature. The gel was stained with SYBR Green dye by using a fluorescence-based EMSA kit (Invitrogen). To detect total protein, the same gel was stained with SYPRO Ruby dye (Invitrogen) according to the manufacturer's protocol. Gels stained with fluorescent dyes were visualized using a Typhoon laser scanner. The proximal HSE from the human hsp70.1 gene promoter served as a positive binding DNA probe for HSF1 protein.
Figure 2.

ChIP analysis of HSF1 binding sites in human TTR and HSP70.1 promoters. A, Schematic representation of predicted HSEs in the human TTR promoter. ChIP-qPCR primers flank the predicted HSF1 binding sites. B, Extracts of SH-SY5Y (black), HepG2 (gray), and AC16 (white) cells (1 × 10⁶ cell equivalents per IP) were subjected to ChIP assay with antibodies specific for HSF1 and nonimmune IgG. Precipitated DNA was amplified by real-time qPCR with primers flanking the predicted HSF1 binding sites (shown) of the TTR promoter. There were significant differences between nonimmune IgG and HSF1 antibody binding to the HSE1 and HSE4 sites of the TTR promoter in SH-SY5Y but not in HepG2 or AC16 cell DNA. C, Binding of HSF1 to the positive control Hsp70.1 promoter in SH-SY5Y and HepG2 cells. Fold enrichment (as percentage of input DNA) is relative to binding by nonimmune IgG. Multivariate analysis reveals statistically significant HSF1 binding (IgG vs HSF1 antibody) to the promoter both in the SH-SY5Y and the HepG2 cells. Error bars indicate mean ± SD. Statistical significance is indicated (from ≥3 independent experiments, Student's t test): *p < 0.05, **p < 0.01.
Western blotting of cell extracts and secreted media.
Cell lysates or eluates of immunoprecipitates were boiled in SDS sample buffer for 10 min. The samples were separated on 12% SDS-PAGE and then transferred to PVDF membranes. The membranes were blocked with 5% nonfat dry milk in TBS with 0.1% Tween 20 (TBST) for 1 h, washed with TBST, and incubated with anti-Hsp70 (Cell Signaling Technology, 1:1000), anti-Hsp90 (Cell Signaling Technology, 1:1000), anti-β-actin (Cell Signaling Technology, 1:1000), anti-HSF1 (Cell Signaling Technology, 1:1000), or anti-TTR (Dako 1:1000) primary antibodies overnight at 4°C. After washing in TBST, the membranes were incubated with antibody (IRDye secondary antibody), imaged and quantified using an Odyssey system (LI-COR Biosciences). To reprobe the membrane with different antibodies, they were stripped using stripping buffer (Thermo Scientific) for 20 min with rocking.
Immunoprecipitation (IP) of SH-SY5Y secreted protein.
SH-SY5Y cells were grown to a density of ∼2 × 10⁶ cells/10 cm plate. Medium and detached cells were removed and the cell layer washed twice with PBS. Reduced-serum OPTI-MEM was added and cells incubated with celastrol or vehicle (DMSO) at 37°C for 24 h. The medium was collected, precleared by shaking with 20 μl Protein A/G plus agarose beads (Santa Cruz Biotechnology) for 4 h at 4°C. The beads were removed and the cleared supernatants were incubated with anti-TTR (Dako) and Protein A/G plus agarose beads as per the manufacturer's protocol. The complexes were eluted and analyzed by Western blotting as above with the blots developed with the anti-TTR antibody.
Results
Computational analysis reveals HSF1 and HNF1 response elements within the TTR promoter
The regulatory elements for hepatic TTR expression have previously been established as being located within 2 kb of the transcriptional start site (TSS) of the human and murine TTR genes (Costa et al., 1990). Using Transcription Element Search System, Jaspar, and the Transcription Factor Search Database, we searched for TF binding sites conserved between the two genomes and sites that were either mouse or human genome-specific. We identified and scored binding sites for general TFs commonly present in the promoter regions of different genes: sites in the TTR gene that had been described and characterized by Costa et al. (1990) as liver-specific regulators and sites for new potential TTR-specific candidates based on the highest binding scores using the various search engines (Table 1).
Table 1.
Potential transcription factor binding sites in human and murine Ttr promoter regiona
| Name | Effective threshold | p |
|---|---|---|
| HNF1 | 14.14 | 5.92E-02 |
| HSF1 | 6.00 | 1.34E-06 |
aSites were identified using Jaspar, Transcription Element Search System-Tess, and Transcription Factor Finder. HSF1 binding sites are present in both the human and murine sequences, suggesting that they are evolutionally conserved.
In human and mouse genomes, there were binding sites for hepatocyte nuclear factor 1 (HNF1), a transcription factor known to be a major element in the regulation of hepatic TTR transcription (Fig. 1A) (Costa et al., 1990). In addition, we found four potential sequences consistent with HSEs within the 2 kb upstream of the 5′ end of human TTR gene and a single site in the homologous region in the murine gene (Figs. 2A and 3A). All were located 5′ to the promoter proximal binding sites for the transcription factors known to regulate hepatic TTR transcription and 3′ to the upstream hepatic TTR enhancer (Yan et al., 1990).
Figure 1.

ChIP analysis of HNF1 binding sites in the human TTR promoter. A, Schematic representation of known HNF1 sequences in the human TTR promoter. ChIP-qPCR primers flank the predicted HNF1 binding sites. B, Extracts of SH-SY5Y (black), HepG2 (gray), and AC16 (white) cells (1 × 10⁶ cell equivalents per IP) were subjected to a ChIP assay with antibodies specific for HNF1 and nonimmune IgG. Precipitated DNA was amplified by real-time qPCR with primers flanking the predicted HNF1 binding sites (shown) of the TTR promoter. ChIP assays were performed in triplicate. Data are presented as percentage of input DNA. Error bars indicate mean ± SD. **Statistical significance of differences in binding between anti-HNF1 antibody and nonspecific IgG is indicated (from ≥3 independent experiments, Student's t test): p < 0.01.
Figure 3.

ChIP analysis of HSF1 binding sites in the murine Ttr and Hsp70.1 promoters. A, A schematic depiction of the single HSE in the murine Ttr promoter. B, The histogram shows the results of ChIP by HSF1 Ab or normal mouse IgG in the hippocampus and liver of WT C57BL/6 mice (n = 4) using the Ttr HSE-specific primers. C, A similar analysis using murine Hsp70 specific primers. Percentage of input DNA is relative to nonimmune IgG. Multivariate analysis reveals statistically significant HSF1 binding (IgG vs HSF1 antibody) to both promoters in the hippocampus but not the liver of C57BL/6 mice (n = 4). Error bars indicate mean ± SD. *p < 0.05 (Student's t test). **p < 0.01 (Student's t test).
ChIP analysis of HSF1 and HNF1 binding activity within the TTR promoter
To test the occupancy of the computationally suggested sites in living cells, in the absence of a stress challenge, ChIP analysis of the TTR promoter in human cells of neuronal (SH-SY5Y) hepatic (HepG2) and cardiac (AC16) origin was performed. The two potential HNF1 binding sites identified were designated E1 and E2 (for elements 1 and 2) (Fig. 1A). HNF1 binding to the E1 site in the TTR promoter was readily demonstrated in the HepG2 and the SH-SY5Y cells (Fig. 1B). No binding was seen using the AC16 cardiac cell line DNA, a finding consistent with the absence of TTR gene transcription in cardiac tissue (Yan et al., 1990; Buxbaum et al., 2012). Hence, in these experiments, the AC16 cells served as a negative control.
The four potential HSF1 binding sites within the human TTR promoter were designated HSE1-HSE4 (Fig. 2A). In the SH-SY5Y cells, binding was detected at the −219 bp binding site (relative to the initiator ATG) (HSE1), with a significant signal also detected at the −1540 bp (HSE4) site. Little or no HSF1 binding was observed at the potential HSEs at −741 bp (HSE2) and −1148 bp (HSE3) upstream of the TSS, respectively. ChIP did not show binding for HSF1 at the HSEs in either the hepatic or cardiac cells (Fig. 2B). The HNF1 and HSF1 binding sites did not overlap. The endogenous Hsp70.1 promoter, a known downstream target of HSF1, served as a positive control and showed appropriate binding in both cell lines (Fig. 2C). There was little nonspecific HSF1 binding to the human 1GX1A-negative control DNA (data not shown). There was demonstrable binding using a specific anti-RNA polymerase II antibody to DNA of all human promoters tested, including that of TTR (data not shown).
We also analyzed the sequence of the mouse Ttr promoter for conserved potential transcription factor binding sites that might be involved in neuronal TTR regulation. We found consensus sequence binding sites for the same two transcription factors in the murine Ttr promoter region (within 2 kb upstream of the TSS). The HNF1 binding site was at the previously identified −155 bp GTTACTTATTCTC site (Costa et al., 1986). In contrast to the human cells, only a single potential HSF1 binding site was identified between −572 bp to −378 bp upstream of the initiator ATG (Fig. 3A). In normal murine tissues, ChIP analysis revealed significant HSF1 binding activity to the putative binding site in DNA isolated from the hippocampus (n = 5) but not in that from the livers of C57BL/6J mice (Fig. 3B), indicating that HSF1 binding was a function of the tissue lineage of the cultured cells, not their derivation from human tumors (Mendillo et al., 2012). In the same extracts, HSF1 bound to the HSE in the endogenous Hsp70.1 promoter (Fig. 3C).
Using a fluorescence-based EMSA with purified recombinant HSF1 protein, we identified the different HSE-containing oligonucleotide-protein complexes in vitro, further validating our in vivo results. Thus HSE1 and HSE4 (Fig. 4A), but not HSE2 and HSE3 (Fig. 4B), oligonucleotides of the human TTR promoter have HSF1 binding activity, as do the HSE oligonucleotides of the human Hsp70 promoter, confirming our ChIP studies with cell and tissue extracts.
Figure 4.
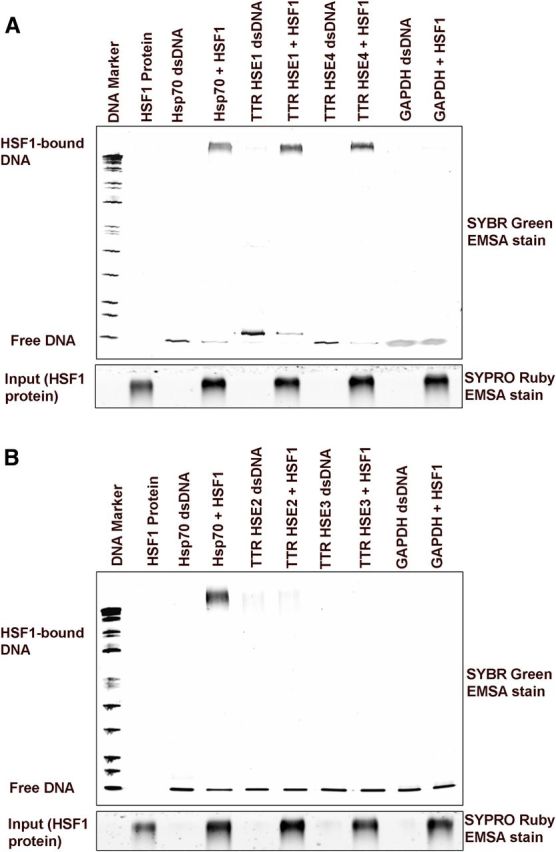
EMSA results obtained with 250 ng HSF1 protein and double-stranded oligonucleotides (40 ng) representing various segments of the human TTR promoter (shown in Fig. 2A). Image of the EMSA gel stained with SYBR Green EMSA DNA stain. The same gel was stained with SYPRO Ruby EMSA protein stain and destained before taking an image. HSE1 and HSE4 oligonucleotides have HSF1 DNA binding activity, as does the HSE oligonucleotide of the human Hsp70 promoter (positive control) (A). B, HSE2 and HSE3 show no binding.
Heat shock effects on endogenous TTR gene expression
The functionality of the HNF1 site in the TTR promoter region in the hepatic regulation of the gene was established 20 years ago, but there were no data suggesting that TTR was an HSF1 target gene in any tissue (Costa et al., 1990). To determine whether the HSF1 binding sites identified by ChIP were functional and involved in the regulation of TTR expression, we exposed the neuronal and hepatic cell lines to a standard heat shock protocol. TTR transcription was increased in the SH-SY5Y cells after 1 h of heat shock (Fig. 5A). As a positive comparison, we measured the mRNA abundance of genes known to be HSF1 responsive (Hsp40, Hsp70, and Hsp90).
Figure 5.

Effect of heat shock on Hsp and TTR expression in SH-SY5Y and HepG2 cells. SH-SY5Y (A) and HepG2 cells (B) were incubated at 42°C for the indicated periods. Samples were harvested for RNA isolation and analyzed by qRT-PCR analysis. A, Heat shock increases Hsp40 (black), Hsp70 (gray), Hsp90 (dark gray), and TTR (white) mRNA levels in SH-SY5Y cells compared with untreated (NT) cells. B, Heat shock increases Hsp mRNA expression, but TTR mRNA levels do not change in HepG2 cells compared with the NT cells. Error bars indicate mean ± SD. Statistical significance of differences between mRNA levels of treated and untreated cells (NT) is indicated (from ≥3 independent experiments, Student's t test): *p < 0.05; **p < 0.01. Protein extracts from heat shock-treated SH-SY5Y (C) or HepG2 (D) cells probed with antibodies to heat shock proteins.
We performed the same experiment in the HepG2 hepatoma cells (Fig. 5B). As in the SH-SY5Y cells, there were comparable increases in the Hsp mRNAs over the course of the experiment. However, the TTR mRNA responses to increased temperature differed markedly in the two cell types, increasing in parallel with the Hsps in the neuronally derived SH-SY5Y cells and showing no change while the Hsp mRNAs increased in the HepG2 cells. Western blots of the heat shocked cells using antibodies to Hsp70 and Hsp90 showed increases in both proteins in a time-dependent manner (Fig. 5C,D). There were no changes in TTR levels in the HepG2 cells (data not shown), whereas the concentrations of TTR in the SH-SY5Y cells were below the limits of detection of the Western blots.
ChIP analysis showed increased occupation of HSE1 by HSF1 in response to heat treatment of the SH-SY5Y cells (Fig. 6A). The binding to HSE4 was only marginally enhanced. ChIP showed no enhanced binding to the HSEs in the HepG2 cells (Fig. 6B). Thus, in a neuronal but not in a hepatic context, TTR behaves as a responder to heat shock stress. HSF1 binding to the endogenous Hsp70.1 promoter was increased in response to heat shock in both cell lines (Fig. 6C).
Figure 6.

ChIP analysis of HSF1 binding sites in human TTR promoters after 1 h 42°C heat shock treatment. ChIP-qPCR results with no treatment (white) or heat shock induction (gray) are shown as percentage of input DNA in SH-SY5Y (A) or HepG2 (B) cells (1 × 10⁶ cell equivalents per IP). C, ChIP-qPCR results with Hsp70 promoter from same cells as target. Multivariate analysis reveals a significant effect of heat shock on HSF1-binding activity to the TTR promoter in the SH-SY5Y cells relative to that produced by no treatment (from ≥3 independent experiments, Student's t test): *p < 0.05; **p < 0.01. There was no significant binding to the TTR promoter in the HepG2 cells. Heat shock increased binding to the HSP70 promoter in both cell lines.
Celastrol induces TTR gene expression in neuronal cells
To determine whether a known small-molecule stimulator of the heat shock response also increased neuronal TTR transcription, we treated the SH-SY5Y and HepG2 cells with the plant-derived compound celastrol (Allison et al., 2001; Trott et al., 2008; Kannaiyan et al., 2011). The results (shown in Fig. 7A,B) were comparable with those obtained in the heat shock experiments. Celastrol induces a “classical” transcriptional heat shock response, as indicated by increases in HSP mRNA levels in both SH-SY5Y and HepG2 cells. But, as in the heat shock experiments, there were different effects on TTR mRNA expression in the two cell types. TTR mRNA was induced after celastrol treatment in SH-SY5Y cells but did not change in HepG2 cells. The effect of celastrol on TTR mRNA expression was dose-dependent in SH-SY5Y cells.
Figure 7.

Dose-dependent effects of celastrol on Hsp (Hsp70 and Hsp90) and TTR gene expression in SH-SY5Y and HepG2 cells. Cells were treated with celastrol at indicated concentrations for 24 h. Total RNA and protein were isolated, and the expression of Hsp70 and Hsp90, TTR, and β-actin was determined by qRT-PCR. Hsp70 and Hsp90 protein levels were monitored by Western blot. A, Celastrol increases Hsp70 (gray), Hsp90 (black), and TTR (white) mRNA levels in SH-SY5Y cells. B, In HepG2 cells, celastrol increases Hsp mRNA, but TTR mRNA levels are unchanged. Protein extracts from celastrol-treated SH-SY5Y (C) or HepG2 (D) cells probed with antibodies specific for Hsp70 and Hsp90 proteins. E, Western blot of TTR immunoprecipitated from the medium of the SH-SY5Y cultures after treatment with DMSO or 1 μm celastrol for 24 h. The relative amounts of TTR released by the SH-SY5Y cells after the two treatments were quantified using ImageJ software. F, ELISA analysis of TTR protein levels in concentrated media from SH-SY5Y cells or unconcentrated media from HepG2 cells after celastrol treatment (1 μm, 24 h). The data were normalized with respect to total DNA in the cell cultures after removal of the TTR-containing medium. As shown on the ordinate baseline, TTR secretion is much higher in HepG2 than in SH-SY5Y cells. However, with the same treatment, secreted TTR is increased in the SH-SY5Y cells but reduced (relative to DMSO treatment in the HepG2 cultures). Error bars indicate mean ± SD. Statistical significance of differences in mRNAs and secreted TTR between celastrol and DMSO-treated cells is indicated (from ≥3 independent experiments, Student's t test): *p < 0.05; **p < 0.01.
The changes in TTR mRNA abundance after celastrol treatment were associated with changes in protein production. Because the absolute amount of TTR in the SH-SY5Y cells was too low to be detected by Western blot, we collected culture medium over the 24 h period, immunoprecipitated the TTR, and analyzed the precipitate by Western blotting; 1 μm celastrol resulted in a 1.4-fold increase in amount of secreted TTR (Fig. 7E,F). In the hepatoma cell line (HepG2), the amount of secreted TTR protein was significantly reduced compared with that seen with vehicle only treatment (Fig. 7F). These results indicated that, with respect to TTR expression and synthesis, responses to both heat shock and celastrol depend on the cell type.
Celastrol induces HSF1 binding to the TTR promoter in cultured cells and in vivo
To confirm that the effect of celastrol treatment on TTR expression was mediated by HSF1 binding to the TTR promoter, we performed ChIP. The chromatins from SH-SY5Y or HepG2 cells treated with either DMSO or celastrol for 24 h were immunoprecipitated using a polyclonal antibody against human HSF1. qPCR analysis showed that celastrol-induced HSF1 binding to the TTR promoter at HSE4 and HSE1 in the cultured SH-SY5Y cells (Fig. 8A) but not in the HepG2 cells (Fig. 8B). DMSO treatment had little effect on the association with any region of the TTR promoter (Fig. 8A,B). HSF1 binding to the endogenous Hsp70.1 promoter was increased in both cell lines in response to celastrol (Fig. 8C).
Figure 8.

ChIP analysis of HSF1 binding sites in the human TTR promoter after celastrol treatment (1 μm, 24 h). Celastrol increases HSF1-binding to the TTR promoter in human neuroblastoma but not in the hepatoma cells. ChIP-qPCR results with vehicle control (white) or celastrol induction (gray) are shown as percentage of input DNA in SH-SY5Y (A) or HepG2 (B) cells (1 × 10⁶ cell equivalents per IP). C, ChIP-qPCR results from same cells with the Hsp70 promoter as target. Multivariate analysis reveals a significant effect of celastrol on HSF1-binding activity to the TTR promoter relative to that produced by DMSO treatment (from ≥3 independent experiments, Student's t test): *p < 0.05; **p < 0.01.
To test the effect of celastrol on HSF1 binding activity to the Ttr promoter in vivo, C57BL/6J mice were injected intraperitoneally, daily for 4 d, with 1 mg/kg of body weight of celastrol or 100 μl of vehicle (Paris et al., 2010). One hour after the last injection, mice were euthanized and their hippocampi and livers collected. We assessed binding by measuring specific Ttr enrichment in ChIP. We observed an ∼2.5-fold increase in HSF1 binding to the Ttr promoter in the hippocampus and no change in hepatic Ttr enrichment relative to vehicle-treated animals (Fig. 9A). HSF1 binding to the endogenous Hsp70.1 promoter was increased in both tissues, again confirming the specificity of HSF1 for the neuronal Ttr promoter, whereas binding to the Hsp70 promoter was not tissue specific (Fig. 9B).
Figure 9.

ChIP analysis of HSF1 binding sites in murine Ttr (A) and Hsp70 (B) promoters in hippocampus and liver after in vivo celastrol treatment. ChIP-qPCR results from treatment of murine hippocampal or hepatic cells with vehicle control (white) (n = 4) or celastrol (gray bar) (n = 4) are shown as percentage of input. ChIP assays were performed at least in triplicate. Multivariate analysis reveals a significant effect of celastrol on HSF1-binding activity to the Ttr promoter in the hippocampus relative to that produced by DMSO treatment. There was also an increase in binding to the Hsp70 promoter in both hippocampus and liver (Student's t test): **p < 0.01.
TTR expression is increased by HSF1 activation in neuronal cells
To directly test whether the increase in TTR expression in the SH-SY5Y cells and primary hippocampal neurons was related to an increase in HSF1, we transfected the cells with a construct designed to constitutively express HSF1 (Zuo et al., 1995) or a short hairpin HSF1 silencing construct (shHSF1) (both generously provided by Prof. R. Morimoto Northwestern University). In the SH-SY5Y cells, HSF1 increased TTR mRNA abundance at least threefold over the control transfections, whereas in the in non-neuronal HepG2 cells only the antisense construct specific for HSF1 was associated with increased TTR mRNA (Fig. 10A,B). The increased expression of TTR mRNA in mouse primary neurons in response to HSF1 was confirmed independently by qPCR analysis of WT (C57BL/6J) hippocampal cells transfected with a human HSF1-encoding construct (hHSF1) (Fig. 10C). qPCR showed that, as expected, HSF1 transcripts were significantly increased and Ttr and Hsp transcripts were more abundant in primary cultured hippocampal neurons after transfection with hHSF1 than in those from parallel cultures transfected with a GFP-containing vector (Fig. 10C,D). Western blots of SH-SY5Y and HepG2 cells transfected with HSF1 and control constructs showed increased HSF1, Hsp90, and Hsp70 protein production in both cell lines relative to the controls (Fig. 11C,D). The amount of secreted TTR measured by ELISA was increased when HSF1 was overexpressed in the SH-SY5Y cells (Fig. 11A). In the HepG2 cells, TTR transcription and protein levels were only increased in the cells transfected with the antisense construct (Figs. 10B and 11B), suggesting that, even under “nonstress” conditions, HSF1 may have a suppressive effect on hepatic TTR expression.
Figure 10.

Analysis of TTR expression in SH-SY5Y, HepG2 cells, and WT C57BL/6 embryonic hippocampal neurons transiently expressing human HSF1 or shHSF1 plasmids. qRT-PCR of TTR mRNA (relative to endogenous actin mRNA) extracted from SH-SY5Y (A) and HepG2 (B) cells transfected with pcDNA empty vector, scrambled shRNA, a GFP construct serving as a marker of transfection efficiency (∼20%, i.e., GFP positive cells vs total cells) and an HSF1 construct, SH-SY5Y (A) and HepG2 (B). The HSF1 construct significantly induces TTR mRNA in neuronal cells over that seen with any of the controls in the SH-SY5Y cells. Only the antisense HSF1 construct has any effect in the HepG2 cells (B). Quantitation of hHSF1 (C) or mTtr, hsp70, hsp90 mRNAs (D) in cultured primary neurons transfected with either pcDNA empty vector, GFP, or HSF1 (n = 20 embryos from 4 dams). Error bars indicate mean ± SD. Statistical significance is indicated (from ≥3 independent experiments, Student's t test): **p < 0.01.
Figure 11.

Analysis of TTR production in SH-SY5Y or HepG2 cells transiently expressing HSF1 or shHSF1 plasmids. A, ELISA analysis of TTR protein levels in concentrated media from SH-SY5Y cells shows that HSF1 transfection increases TTR protein levels in neuronal cells compared with control transfections. B, ELISA analysis of TTR protein levels in unconcentrated media from HepG2 cells shows that transfection of shHSF1, but not HSF1, increases TTR protein secretion. The results reflect the mRNA changes seen in Figure 10A, B. The data are normalized to total DNA in cell extracts. Error bars indicate mean ± SD. Statistical significance is indicated (from ≥3 independent experiments, Student's t test): *p < 0.05; **p < 0.01. Western blots of HSF1 and heat shock proteins in SH-SY5Y (C) or HepG2 (D) cells transiently expressing HSF1 or shHSF1 plasmids.
The results were reinforced by experiments in which SH-SY5Y or HuH-7 human hepatoma cells that were stably transfected with a construct in which 2 kb of the human TTR promoter was used to drive a modified Gaussia luciferase (GLuc) gene. In SH-SY5Y cells, HSF1 activates the TTR promoter-GLuc reporter construct (Fig. 12A). In similarly stably transfected HuH-7 cells, shHSF1 (antisense) increased the signal of the TTR-GLuc reporter (Fig. 12B). These experiments were consistent with the prior observations showing that HSF1 affected TTR expression differently in the two cultured cell types and the liver and hippocampus in vivo and further documented that the TTR promoter region contained the sequences responsible for the tissue specificity of the response.
Figure 12.

Effects of HSF1 on TTR promoter activity in SH-SY5Y and HuH-7 cells. Stable SH-SY5Y (A) or HuH-7 (B) cell line harboring the pGL4.17-TTR 2 kb promoter-eGLuc2 plasmid were transiently transfected with pcDNA empty vector control, HSF1, or shHSF1 plasmids. Luciferase activity was determined after 48 h. Error bars indicate mean ± SD. Statistical significance is indicated (from ≥3 independent experiments, Student's t test): *p < 0.05; **p < 0.01.
We performed additional independent experiments in which SH-SY5Y cells stably expressing the TTR-GLuc reporter were transiently transfected with a constitutively expressed mutant FK506 binding protein (FKBP) fused to a constitutively active HSF1. In the absence of the FKBP stabilizing compound Shield 1, the fusion protein is degraded (Iwamoto et al., 2010; Shoulders et al., 2013). When Shield 1, the FKBP stabilizer, was added to the SH-SY5Y cells, the active HSF1 gene was expressed and TTR-regulated luciferase transcription was induced. Vehicle only control experiments showed no increase in the luciferase signal (Fig. 13).
Figure 13.

Constitutively active cHSF1 increases TTR promoter activity. SH-SY5Y cells stably transfected with Gaussia luciferase regulated by the 2 kb TTR promoter were transiently transfected with FKBP.cHSF1 or FKBP.YFP and were treated for 36 h with or without the stabilizing compound Shield-1, which activates FKBP-mediated expression (4). A luminescence assay detecting luciferase in the conditioned media was performed. An increase in TTR promoter activity was observed when cHSF1 was activated. Error bars indicate mean ± SD; n = 3. **p < 0.01.
Ttr mRNA is upregulated in the hippocampus but not the liver of APP23 and APP23/Ttr−/− mice
Increased expression of Ttr mRNA in AβPP transgenic mice was independently confirmed by comparing qPCR analysis of Ttr mRNA abundance in hippocampal cells from WT (B6), APP23 (AβPP overexpressing), and APP23/Ttr−/− (APP23 mice on Ttr knock-out background). As expected, no Ttr signal was found in the APP23/Ttr−/− control cells (Fig. 14A). qPCR showed that Ttr transcripts were twice as abundant in hippocampal cells obtained from the APP23 mice than in those from WT animals. These results were consistent with previous findings from our laboratory that Ttr transcripts were more abundant in primary cultured hippocampal and cortical neurons obtained from the APP23 mice than in similar preparations from WT mice (Li et al., 2011). Hepatic Ttr mRNA abundance was decreased in the APP23 mice (Fig. 14B).
Figure 14.

Ttr expression and HSF1 binding to the Ttr promoter in APP23 transgenic mice. A, Ttr mRNA was analyzed in hippocampal cells from WT (n = 4), APP23 (n = 6), and APP23/mttr−/− (n = 3) mice. B, Quantitation of Ttr mRNA in hepatic cells from WT (B6), APP23, and APP23/mttr−/−. C, HSF1 binding to the Ttr promoter in the hippocampus of APP23 mice (n = 6) compared with WT mice (n = 4) by ChIP assay. D, ChIP assays of HSF1 binding to Ttr promoter in hepatic cells of APP23 (n = 6) and WT mice (n = 4). The controls include input DNA before immunoprecipitation and a normal mouse IgG precipitation. Error bars indicate mean ± SD. Statistical significance is indicated compared with WT mice: *p < 0.05; **p < 0.01.
Consistent with the increased Ttr transcription in the presence of a human Aβ precursor gene, documented by measurement of APP mRNA in hippocampal neurons and hepatic cells of APP23 mice, we found that HSF1 binding to the hippocampal Ttr promoter in APP23 transgenic mice in vivo was increased twofold relative to WT mice of the same age and gender (Fig. 14C). Parallel studies in the livers of the same animals showed no significant HSF1 binding to the Ttr promoter (Fig. 14D). hAPP transcripts were significantly increased in hippocampal neurons and hepatic cells of APP23 transgenic mice (Fig. 15A,C). HSF1 and HSP transcripts were also increased in APP23 hippocampi, but not in hepatic cells of the same animals relative to those of WT mice, independent of the presence of a functioning Ttr gene (Fig. 15B,D).
Figure 15.

HSF1 and heat shock transcripts were expressed differently in hippocampal and hepatic cells of APP23 mice. A, hAPP mRNA was analyzed in WT (n = 7), APP23 (n = 6), and APP23/mttr−/− (n = 5) hippocampal cells. B, HSF1 and heat shock gene mRNAs were analyzed in WT (n = 7), APP23 (n = 6), and APP23/mttr−/− (n = 5) hippocampal cells. C, hAPP mRNA was analyzed in WT (n = 7), APP23 (n = 6), and APP23/mttr−/− (n = 5) hepatic cells. D, Quantitation of HSF1 and heat shock gene mRNAs in WT (B6), APP23, and APP23/mttr−/− hepatic cells. Error bars indicate mean ± SD. Statistical significance of the differences between APP23 and WT mice is indicated in each panel: *p < 0.05; **p < 0.01.
Discussion
Our interest in the regulation of TTR was stimulated by the observation that in vitro TTR inhibits Aβ aggregation and cytotoxicity for a variety of cell targets (Li et al., 2011) and the finding of increased TTR expression in human AD and transgenic mouse models of human Aβ deposition (Link, 1995; Schwarzman and Goldgaber, 1996; Stein and Johnson, 2002; Stein and Johnson, 2003; Buxbaum et al., 2008b; Li et al., 2011). Despite earlier reports indicating that the choroid plexus was the only source of TTR in the CNS (Dickson et al., 1986; Sousa et al., 2007), we thought the observations in AD were more likely to be related to neuronal synthesis of TTR (Stein and Johnson, 2002; Hovatta et al., 2007).
The human (and mouse) serum proteins TTR and albumin behave as “negative acute phase reactants” with the serum concentrations of both being reduced in the course of acute infectious or noninfectious inflammatory events (Schreiber et al., 1989; Kushner and Rzewnicki, 1994). The reductions are mediated by the inflammatory cytokines IL1, IL6, and TNFα (Wang and Burke, 2010). Costa et al. (1990) described the positive regulation of TTR transcription in hepatocytes by HNF1. They subsequently identified HNF3, HNF4, and HNF6 as participants in the downregulation of TTR expression in inflammation (Qian et al., 1995). They also noted the upstream enhancer activity of AP1 and C/EBP (Costa and Grayson, 1991; Herbst et al., 1991) but did not identify HSF1 as a regulator of TTR expression. Some of their experiments suggested neuronal expression of Ttr; however, no further characterization was reported (Yan et al., 1990).
The present data from experiments, stimulated by computational analysis of the TTR promoter, using ChIP, qPCR, and measurements of TTR secretion in several biologic models, show that the human and murine TTR promoter regions contain the previously identified potential binding site for HNF's and several potential consensus HSEs. The ChIP results showed occupancy of the HNF1 site in HepG2 and to a lesser extent in the SH-SY5Y cells, confirming the earlier observations and providing a positive control for the current experiments. However, the findings in SH-SY5Y human neuroblastoma cells and hippocampal neurons differ from those in human hepatoma cell lines and murine hepatocytes. HSF1 binds to two of the potential HSEs in the TTR promoter in neuron-derived cells. TTR expression is increased in SH-SY5Y cells transfected with HSF1 constructs as is expression of the genes encoding HSP40, HSP70, and HSP90. HepG2 cells, transfected with the same construct, also show increases in HSP gene expression, but that of TTR is unaffected or reduced. A similar positive effect of HSF1 on TTR transcription was seen when neuronal cells transfected with a vector containing the Gaussia luciferase gene driven by 2 kb of the normal human TTR promoter in the presence of an HSF1 coding sequence in the context of an FKBP-destabilized domain construct that could be activated by the pharmacologic chaperone Shield 1 (Shoulders et al., 2013). Consistent with these observations are the experiments in which the SH-SY5Y cells were subjected to heat shock or exposed to the HSF1 stimulator celastrol. With both treatments, TTR mRNA abundance increased, as did that of the HSF1-targeted HSPs. ChIP showed enhanced binding of HSF1 to HSE1 and HSE4 in both experiments.
Many publications have pointed out that neurons have a low heat shock or HSF1 response relative to other cell types, including glia (Blake et al., 1990; Marcuccilli et al., 1996; Batulan et al., 2003). It has also been observed that the response, whether stimulated by a standard heat shock protocol or celastrol, is more robust in cultured neuroblastoma cells (both murine and human) than when those cells have been differentiated (Hatayama et al., 1997) (Kaarniranta et al., 2002; Chow and Brown, 2007; Yang et al., 2008). However, even in the differentiated cells, the response, measured primarily in terms of Hsp70 expression, was never absent. Despite the discordance between differentiated and undifferentiated cultured neuroblastoma cells, the HSF1 response has been found to be salutary in tissue culture and mouse models of polyQ disorders and α-synuclein aggregation (Fujimoto et al., 2005; Fujikake et al., 2008; Liangliang et al., 2010; Malik et al., 2013). In addition, celastrol has been reported to reduce β-amyloid pathology in a PS1/Appsw transgenic model of AD and the G93A SOD1 model of ALS, although in the latter the effect was attributed to the anti-inflammatory activities of the compound rather than its HSF1 stimulatory properties (Kiaei et al., 2005; Trott et al., 2008; Paris et al., 2010). TTR expression was not measured.
Although HSF1 targets have been examined in flies, yeast, worms, and human cell lines, none of the studies in human or mouse cells has identified TTR as subject to regulation by HSF1 (Hahn et al., 2004; Trinklein et al., 2004; Page et al., 2006). The clear identification of functional binding sites in the TTR gene recognized by HSF1 in neuron-derived cells explains the effects in the SH-SY5Y cells. The lack of an increase or a quantifiable decrease in the expression of TTR mRNA in the presence of HSF1 and our failure to detect binding of HSF1 to the TTR promoter in the HepG2 cells would suggest that the possible suppressive effect of HSF1 on TTR promoter activity in the liver is indirect, mediated through interaction with other molecules, a notion consistent with the increase in TTR expression and protein production observed when the hepatoma cells are transfected with an HSF1 suppressor hairpin construct. It is not likely that differential post-translational modifications in the different cell types are responsible for our observations because we performed the transfections with a constitutively activated HSF1 construct (Perisic et al., 1989; Zuo et al., 1995; Fujimoto et al., 2005; Anckar and Sistonen, 2011).
Studies in mice heterozygous for an Hsf1 gene that has been silenced by targeted disruption and carries a mutant human TTR gene associated with the human disorder familial amyloidotic polyneuropathy show an increased frequency of human TTR deposits relative to mice with two intact Hsf1 alleles (Santos et al., 2010). It has been suggested that the increase in deposition is related to a diminished peripheral tissue response of genes regulated by HSF1. In the context of our observations, it is also possible that increased hepatic production of the mutant human TTR adds to the tissue load.
HSF1 has many gene targets. It increases expression of some and decreases the expression of others. The current example seemed to be unique in that HSF1 can have different effects on the same gene (TTR) under the same conditions in different cell types (neurons compared with hepatocytes).
We initiated these studies prompted by our observations and those of others suggesting increased production of TTR in neurodegenerative diseases, particularly AD (Link, 1995; Schwarzman and Goldgaber, 1996; Stein and Johnson, 2002; Stein et al., 2004; Li et al., 2011). It is quite clear from the data depicted in Figures 14 and 15 and other experiments (Li et al., 2011) that hippocampal transcription of the murine Ttr gene is increased relative to its expression in WT hippocampal cells when mutant human AβPP is overexpressed. The additional observation that HSF1 mRNA is elevated in the hippocampal cells of APP23 mice with and without a functional Ttr gene is somewhat unexpected because HSF1 activation usually involves trimerization of HSF1 monomers rather than increased transcription, although the latter has been reported in some circumstances (Anckar and Sistonen, 2011; Xue et al., 2012). We do not believe that HSF1 is the only TF involved in the regulation of neuronal TTR expression. Earlier experiments suggested that secreted fragments of AβPP (sAPPα or sAPPβ), the AD precursor protein, could be positive regulators of Ttr expression, although the mechanism was not established (Stein and Johnson, 2003; Li et al., 2010). Similarly, a recent study suggested that the AICD fragment of APP could drive TTR expression on an epigenetic basis (Kerridge et al., 2014). These possibilities and the results of our computational analyses indicating the presence of other TF binding sites of somewhat lower probabilities are a subject of continuing interest in our laboratory. Nonetheless, the current results were unexpected and provide a point of departure for studies attempting to gain further understanding of neuronal gene expression in response to potential neurodegenerative insults.
The stimulus to HSF1 activation in AD and transgenic models of human AD is unknown. In the context of the Aβ hypothesis of AD pathogenesis, the assembly of oligomers intracellularly or extracellularly with subsequent formation of reactive oxygen species could generate sufficient cytoplasmic “stress” to allow trimerization and nuclear localization of HSF1. Even if the initiation of AD does not involve increased Aβ formation and aggregation, any etiologic event that incites cytoplamic stress could trigger both HSF1 activation and increased levels of Aβ1–40/42. The current data suggest one possible mechanism that can account for the increased production of TTR as a potential protective molecule during the course of AD, giving further credence to the idea that the many studies indicating that TTR can inhibit both the aggregation and toxicity of Aβ and its oligomers may be relevant in vivo.
Footnotes
This work was supported by National Institutes of Health Grant AG R01 030027 to J.N.B. We thank Ms. Eley Wong for excellent technical assistance and Dr. Lei Zhao for assistance with the figures.
The authors declare no competing financial interests.
References
- Allison AC, Cacabelos R, Lombardi VR, Alvarez XA, Vigo C. Celastrol, a potent antioxidant and anti-inflammatory drug, as a possible treatment for Alzheimer's disease. Prog Neuropsychopharmacol Biol Psychiatry. 2001;25:1341–1357. doi: 10.1016/S0278-5846(01)00192-0. [DOI] [PubMed] [Google Scholar]
- Anckar J, Sistonen L. Regulation of HSF1 function in the heat stress response: implications in aging and disease. Annu Rev Biochem. 2011;80:1089–1115. doi: 10.1146/annurev-biochem-060809-095203. [DOI] [PubMed] [Google Scholar]
- Batulan Z, Shinder GA, Minotti S, He BP, Doroudchi MM, Nalbantoglu J, Strong MJ, Durham HD. High threshold for induction of the stress response in motor neurons is associated with failure to activate HSF1. J Neurosci. 2003;23:5789–5798. doi: 10.1523/JNEUROSCI.23-13-05789.2003. [DOI] [PMC free article] [PubMed] [Google Scholar]
- Biedler JL, Helson L, Spengler BA. Morphology and growth, tumorigenicity, and cytogenetics of human neuroblastoma cells in continuous culture. Cancer Res. 1973;33:2643–2652. [PubMed] [Google Scholar]
- Blake MJ, Gershon D, Fargnoli J, Holbrook NJ. Discordant expression of heat shock protein mRNAs in tissues of heat-stressed rats. J Biol Chem. 1990;265:15275–15279. [PubMed] [Google Scholar]
- Buxbaum JN, Ye Z, Reixach N, Friske L, Levy C, Das P, Golde T, Masliah E, Roberts AR, Bartfai T. Transthyretin protects Alzheimer's mice from the behavioral and biochemical effects of Abeta toxicity. Proc Natl Acad Sci U S A. 2008b;105:2681–2686. doi: 10.1073/pnas.0712197105. [DOI] [PMC free article] [PubMed] [Google Scholar]
- Buxbaum JN, Tagoe C, Gallo G, Walker JR, Kurian S, Salomon DR. Why are some amyloidoses systemic? Does hepatic “chaperoning at a distance” prevent cardiac deposition in a transgenic model of human senile systemic (transthyretin) amyloidosis? FASEB J. 2012;26:2283–2293. doi: 10.1096/fj.11-189571. [DOI] [PMC free article] [PubMed] [Google Scholar]
- Buxbaum J, Koziol J, Connors LH. Serum transthyretin levels in senile systemic amyloidosis: effects of age, gender and ethnicity. Amyloid. 2008a;15:255–261. doi: 10.1080/13506120802525285. [DOI] [PMC free article] [PubMed] [Google Scholar]
- Calabrese V, Cornelius C, Mancuso C, Lentile R, Stella AM, Butterfield DA. Redox homeostasis and cellular stress response in aging and neurodegeneration. Methods Mol Biol. 2010;610:285–308. doi: 10.1007/978-1-60327-029-8_17. [DOI] [PubMed] [Google Scholar]
- Cascella R, Conti S, Mannini B, Li X, Buxbaum JN, Tiribilli B, Chiti F, Cecchi C. Transthyretin suppresses the toxicity of oligomers formed by misfolded proteins in vitro. Biochim Biophys Acta. 2013;1832:2302–2314. doi: 10.1016/j.bbadis.2013.09.011. [DOI] [PubMed] [Google Scholar]
- Choi SH, Leight SN, Lee VM, Li T, Wong PC, Johnson JA, Saraiva MJ, Sisodia SS. Accelerated Abeta deposition in APPswe/PS1δE9 mice with hemizygous deletions of TTR (transthyretin) J Neurosci. 2007;27:7006–7010. doi: 10.1523/JNEUROSCI.1919-07.2007. [DOI] [PMC free article] [PubMed] [Google Scholar]
- Chow AM, Brown IR. Induction of heat shock proteins in differentiated human and rodent neurons by celastrol. Cell Stress Chaperones. 2007;12:237–244. doi: 10.1379/CSC-269.1. [DOI] [PMC free article] [PubMed] [Google Scholar]
- Costa RH, Grayson DR. Site-directed mutagenesis of hepatocyte nuclear factor (HNF) binding sites in the mouse transthyretin (TTR) promoter reveal synergistic interactions with its enhancer region. Nucleic Acids Res. 1991;19:4139–4145. doi: 10.1093/nar/19.15.4139. [DOI] [PMC free article] [PubMed] [Google Scholar]
- Costa RH, Lai E, Darnell JE., Jr Transcriptional control of the mouse prealbumin (transthyretin) gene: both promoter sequences and a distinct enhancer are cell specific. Mol Cell Biol. 1986;6:4697–4708. doi: 10.1128/MCB.6.12.4697. [DOI] [PMC free article] [PubMed] [Google Scholar]
- Costa RH, Van Dyke TA, Yan C, Kuo F, Darnell JE., Jr Similarities in transthyretin gene expression and differences in transcription factors: liver and yolk sac compared with choroid plexus. Proc Natl Acad Sci U S A. 1990;87:6589–6593. doi: 10.1073/pnas.87.17.6589. [DOI] [PMC free article] [PubMed] [Google Scholar]
- Costa R, Gonçalves A, Saraiva MJ, Cardoso I. Transthyretin binding to A-Beta peptide: impact on A-Beta fibrillogenesis and toxicity. FEBS Lett. 2008;582:936–942. doi: 10.1016/j.febslet.2008.02.034. [DOI] [PubMed] [Google Scholar]
- Cui X, Wang T, Chen HS, Busov V, Wei H. TF-finder: a software package for identifying transcription factors involved in biological processes using microarray data and existing knowledge base. BMC Bioinformatics. 2010;11:425. doi: 10.1186/1471-2105-11-425. [DOI] [PMC free article] [PubMed] [Google Scholar]
- Davidson MM, Nesti C, Palenzuela L, Walker WF, Hernandez E, Protas L, Hirano M, Isaac ND. Novel cell lines derived from adult human ventricular cardiomyocytes. J Mol Cell Cardiol. 2005;39:133–147. doi: 10.1016/j.yjmcc.2005.03.003. [DOI] [PubMed] [Google Scholar]
- Dickson PW, Aldred AR, Marley PD, Bannister D, Schreiber G. Rat choroid plexus specializes in the synthesis and the secretion of transthyretin (prealbumin): regulation of transthyretin synthesis in choroid plexus is independent from that in liver. J Biol Chem. 1986;261:3475–3478. [PubMed] [Google Scholar]
- Du J, Murphy RM. Characterization of the interaction of beta-amyloid with transthyretin monomers and tetramers. Biochemistry. 2010;49:8276–8289. doi: 10.1021/bi101280t. [DOI] [PMC free article] [PubMed] [Google Scholar]
- Du J, Cho PY, Yang DT, Murphy RM. Identification of beta-amyloid-binding sites on transthyretin. Protein Eng Des Sel. 2012;25:337–345. doi: 10.1093/protein/gzs026. [DOI] [PMC free article] [PubMed] [Google Scholar]
- Episkopou V, Maeda S, Nishiguchi S, Shimada K, Gaitanaris GA, Gottesman ME, Robertson EJ. Disruption of the transthyretin gene results in mice with depressed levels of plasma retinol and thyroid hormone. Proc Natl Acad Sci U S A. 1993;90:2375–2379. doi: 10.1073/pnas.90.6.2375. [DOI] [PMC free article] [PubMed] [Google Scholar]
- Fujikake N, Nagai Y, Popiel HA, Okamoto Y, Yamaguchi M, Toda T. Heat shock transcription factor 1-activating compounds suppress polyglutamine-induced neurodegeneration through induction of multiple molecular chaperones. J Biol Chem. 2008;283:26188–26197. doi: 10.1074/jbc.M710521200. [DOI] [PMC free article] [PubMed] [Google Scholar]
- Fujimoto M, Takaki E, Hayashi T, Kitaura Y, Tanaka Y, Inouye S, Nakai A. Active HSF1 significantly suppresses polyglutamine aggregate formation in cellular and mouse models. J Biol Chem. 2005;280:34908–34916. doi: 10.1074/jbc.M506288200. [DOI] [PubMed] [Google Scholar]
- Giunta S, Valli MB, Galeazzi R, Fattoretti P, Corder EH, Galeazzi L. Transthyretin inhibition of amyloid beta aggregation and toxicity. Clin Biochem. 2005;38:1112–1119. doi: 10.1016/j.clinbiochem.2005.08.007. [DOI] [PubMed] [Google Scholar]
- Hahn JS, Hu Z, Thiele DJ, Iyer VR. Genome-wide analysis of the biology of stress responses through heat shock transcription factor. Mol Cell Biol. 2004;24:5249–5256. doi: 10.1128/MCB.24.12.5249-5256.2004. [DOI] [PMC free article] [PubMed] [Google Scholar]
- Hatayama T, Takahashi H, Yamagishi N. Reduced induction of HSP70 in PC12 cells during neuronal differentiation. J Biochem. 1997;122:904–910. doi: 10.1093/oxfordjournals.jbchem.a021851. [DOI] [PubMed] [Google Scholar]
- Herbst RS, Nielsch U, Sladek F, Lai E, Babiss LE, Darnell JE., Jr Differential regulation of hepatocyte-enriched transcription factors explains changes in albumin and transthyretin gene expression among hepatoma cells. New Biol. 1991;3:289–296. [PubMed] [Google Scholar]
- Homma S, Jin X, Wang G, Tu N, Min J, Yanasak N, Mivechi NF. Demyelination, astrogliosis, and accumulation of ubiquitinated proteins, hallmarks of CNS disease in hsf1-deficient mice. J Neurosci. 2007;27:7974–7986. doi: 10.1523/JNEUROSCI.0006-07.2007. [DOI] [PMC free article] [PubMed] [Google Scholar]
- Hovatta I, Zapala MA, Broide RS, Schadt EE, Libiger O, Schork NJ, Lockhart DJ, Barlow C. DNA variation and brain region-specific expression profiles exhibit different relationships between inbred mouse strains: implications for eQTL mapping studies. Genome Biol. 2007;8:R25. doi: 10.1186/gb-2007-8-2-r25. [DOI] [PMC free article] [PubMed] [Google Scholar]
- Hulleman JD, Kaushal S, Balch WE, Kelly JW. Compromised mutant EFEMP1 secretion associated with macular dystrophy remedied by proteostasis network alteration. Mol Biol Cell. 2011;22:4765–4775. doi: 10.1091/mbc.E11-08-0695. [DOI] [PMC free article] [PubMed] [Google Scholar]
- Hulleman JD, Balch WE, Kelly JW. Translational attenuation differentially alters the fate of disease-associated fibulin proteins. FASEB J. 2012;26:4548–4560. doi: 10.1096/fj.11-202861. [DOI] [PMC free article] [PubMed] [Google Scholar]
- Iwamoto M, Björklund T, Lundberg C, Kirik D, Wandless TJ. A general chemical method to regulate protein stability in the mammalian central nervous system. Chem Biol. 2010;17:981–988. doi: 10.1016/j.chembiol.2010.07.009. [DOI] [PMC free article] [PubMed] [Google Scholar]
- Kaarniranta K, Oksala N, Karjalainen HM, Suuronen T, Sistonen L, Helminen HJ, Salminen A, Lammi MJ. Neuronal cells show regulatory differences in the hsp70 gene response. Brain Res Mol Brain Res. 2002;101:136–140. doi: 10.1016/S0169-328X(02)00179-1. [DOI] [PubMed] [Google Scholar]
- Kaech S, Banker G. Culturing hippocampal neurons. Nat Protoc. 2006;1:2406–2415. doi: 10.1038/nprot.2006.356. [DOI] [PubMed] [Google Scholar]
- Kannaiyan R, Shanmugam MK, Sethi G. Molecular targets of celastrol derived from Thunder of God Vine: potential role in the treatment of inflammatory disorders and cancer. Cancer Lett. 2011;303:9–20. doi: 10.1016/j.canlet.2010.10.025. [DOI] [PubMed] [Google Scholar]
- Kerridge C, Belyaev ND, Nalivaeva NN, Turner AJ. The Abeta-clearance protein transthyretin, like neprilysin, is epigenetically regulated by the amyloid precursor protein intracellular domain. J Neurochem. 2014 doi: 10.1111/jnc.12680. doi: 10.1111/jnc.12680. Advance online publication. Retrieved Feb. 14, 2014. [DOI] [PubMed] [Google Scholar]
- Kiaei M, Kipiani K, Petri S, Chen J, Calingasan NY, Beal MF. Celastrol blocks neuronal cell death and extends life in transgenic mouse model of amyotrophic lateral sclerosis. Neurodegener Dis. 2005;2:246–254. doi: 10.1159/000090364. [DOI] [PubMed] [Google Scholar]
- Knowles BB, Howe CC, Aden DP. Human hepatocellular carcinoma cell lines secrete the major plasma proteins and hepatitis B surface antigen. Science. 1980;209:497–499. doi: 10.1126/science.6248960. [DOI] [PubMed] [Google Scholar]
- Kushner I, Rzewnicki DL. The acute phase response: general aspects. Baillieres Clin Rheumatol. 1994;8:513–530. doi: 10.1016/S0950-3579(05)80113-X. [DOI] [PubMed] [Google Scholar]
- Li H, Wang B, Wang Z, Guo Q, Tabuchi K, Hammer RE, Südhof TC, Zheng H. Soluble amyloid precursor protein (APP) regulates transthyretin and Klotho gene expression without rescuing the essential function of APP. Proc Natl Acad Sci U S A. 2010;107:17362–17367. doi: 10.1073/pnas.1012568107. [DOI] [PMC free article] [PubMed] [Google Scholar]
- Liangliang X, Yonghui H, Shunmei E, Shoufang G, Wei Z, Jiangying Z. Dominant-positive HSF1 decreases alpha-synuclein level and alpha-synuclein-induced toxicity. Mol Biol Rep. 2010;37:1875–1881. doi: 10.1007/s11033-009-9623-2. [DOI] [PubMed] [Google Scholar]
- Li X, Masliah E, Reixach N, Buxbaum JN. Neuronal production of transthyretin in human and murine Alzheimer's disease: is it protective? J Neurosci. 2011;31:12483–12490. doi: 10.1523/JNEUROSCI.2417-11.2011. [DOI] [PMC free article] [PubMed] [Google Scholar]
- Link CD. Expression of human beta-amyloid peptide in transgenic Caenorhabditis elegans. Proc Natl Acad Sci U S A. 1995;92:9368–9372. doi: 10.1073/pnas.92.20.9368. [DOI] [PMC free article] [PubMed] [Google Scholar]
- Liu L, Murphy RM. Kinetics of inhibition of beta-amyloid aggregation by transthyretin. Biochemistry. 2006;45:15702–15709. doi: 10.1021/bi0618520. [DOI] [PubMed] [Google Scholar]
- Malik B, Nirmalananthan N, Gray AL, La Spada AR, Hanna MG, Greensmith L. Co-induction of the heat shock response ameliorates disease progression in a mouse model of human spinal and bulbar muscular atrophy: implications for therapy. Brain. 2013;136:926–943. doi: 10.1093/brain/aws343. [DOI] [PMC free article] [PubMed] [Google Scholar]
- Marcuccilli CJ, Mathur SK, Morimoto RI, Miller RJ. Regulatory differences in the stress response of hippocampal neurons and glial cells after heat shock. J Neurosci. 1996;16:478–485. doi: 10.1523/JNEUROSCI.16-02-00478.1996. [DOI] [PMC free article] [PubMed] [Google Scholar]
- McMillan DR, Xiao X, Shao L, Graves K, Benjamin IJ. Targeted disruption of heat shock transcription factor 1 abolishes thermotolerance and protection against heat-inducible apoptosis. J Biol Chem. 1998;273:7523–7528. doi: 10.1074/jbc.273.13.7523. [DOI] [PubMed] [Google Scholar]
- Mendillo ML, Santagata S, Koeva M, Bell GW, Hu R, Tamimi RM, Fraenkel E, Ince TA, Whitesell L, Lindquist S. HSF1 drives a transcriptional program distinct from heat shock to support highly malignant human cancers. Cell. 2012;150:549–562. doi: 10.1016/j.cell.2012.06.031. [DOI] [PMC free article] [PubMed] [Google Scholar]
- Montgomery KT, Biedler JL, Spengler BA, Melera PW. Specific DNA sequence amplification in human neuroblastoma cells. Proc Natl Acad Sci U S A. 1983;80:5724–5728. doi: 10.1073/pnas.80.18.5724. [DOI] [PMC free article] [PubMed] [Google Scholar]
- Morimoto RI. Regulation of the heat shock transcriptional response: cross talk between a family of heat shock factors, molecular chaperones, and negative regulators. Genes Dev. 1998;12:3788–3796. doi: 10.1101/gad.12.24.3788. [DOI] [PubMed] [Google Scholar]
- Morimoto RI, Kline MP, Bimston DN, Cotto JJ. The heat-shock response: regulation and function of heat-shock proteins and molecular chaperones. Essays Biochem. 1997;32:17–29. [PubMed] [Google Scholar]
- Nakabayashi H, Taketa K, Miyano K, Yamane T, Sato J. Growth of human hepatoma cells lines with differentiated functions in chemically defined medium. Cancer Res. 1982;42:3858–3863. [PubMed] [Google Scholar]
- Neef DW, Jaeger AM, Thiele DJ. Heat shock transcription factor 1 as a therapeutic target in neurodegenerative diseases. Nat Rev Drug Discov. 2011;10:930–944. doi: 10.1038/nrd3453. [DOI] [PMC free article] [PubMed] [Google Scholar]
- Page TJ, Sikder D, Yang L, Pluta L, Wolfinger RD, Kodadek T, Thomas RS. Genome-wide analysis of human HSF1 signaling reveals a transcriptional program linked to cellular adaptation and survival. Mol Biosyst. 2006;2:627–639. doi: 10.1039/b606129j. [DOI] [PubMed] [Google Scholar]
- Paris D, Ganey NJ, Laporte V, Patel NS, Beaulieu-Abdelahad D, Bachmeier C, March A, Ait-Ghezala G, Mullan MJ. Reduction of beta-amyloid pathology by celastrol in a transgenic mouse model of Alzheimer's disease. J Neuroinflammation. 2010;7:17. doi: 10.1186/1742-2094-7-17. [DOI] [PMC free article] [PubMed] [Google Scholar]
- Perisic O, Xiao H, Lis JT. Stable binding of Drosophila heat shock factor to head-to-head and tail-to-tail repeats of a conserved 5 bp recognition unit. Cell. 1989;59:797–806. doi: 10.1016/0092-8674(89)90603-X. [DOI] [PubMed] [Google Scholar]
- Portales-Casamar E, Thongjuea S, Kwon AT, Arenillas D, Zhao X, Valen E, Yusuf D, Lenhard B, Wasserman WW, Sandelin A. JASPAR 2010: the greatly expanded open-access database of transcription factor binding profiles. Nucleic Acids Res. 2010;38:D105–D110. doi: 10.1093/nar/gkp950. [DOI] [PMC free article] [PubMed] [Google Scholar]
- Qian X, Samadani U, Porcella A, Costa RH. Decreased expression of hepatocyte nuclear factor 3 alpha during the acute-phase response influences transthyretin gene transcription. Mol Cell Biol. 1995;15:1364–1376. doi: 10.1128/mcb.15.3.1364. [DOI] [PMC free article] [PubMed] [Google Scholar]
- Raychaudhuri S, Loew C, Körner R, Pinkert S, Theis M, Hayer-Hartl M, Buchholz F, Hartl FU. Interplay of acetyltransferase EP300 and the proteasome system in regulating heat shock transcription factor 1. Cell. 2014;156:975–985. doi: 10.1016/j.cell.2014.01.055. [DOI] [PubMed] [Google Scholar]
- Ryno LM, Genereux JC, Naito T, Morimoto RI, Powers ET, Shoulders MD, Wiseman RL. Characterizing the altered proteome induced by the stress-independent activation of Heat Shock Factor 1. ACS Chem Biol. 2014 doi: 10.1021/cb500062n. Advance online publication. Retrieved April 1, 2014. [DOI] [PMC free article] [PubMed] [Google Scholar]
- Santos SD, Fernandes R, Saraiva MJ. The heat shock response modulates transthyretin deposition in the peripheral and autonomic nervous systems. Neurobiol Aging. 2010;31:280–289. doi: 10.1016/j.neurobiolaging.2008.04.001. [DOI] [PubMed] [Google Scholar]
- Schreiber G, Tsykin A, Aldred AR, Thomas T, Fung WP, Dickson PW, Cole T, Birch H, De Jong FA, Milland J. The acute phase response in the rodent. Ann N Y Acad Sci. 1989;557:61–85. doi: 10.1111/j.1749-6632.1989.tb24000.x. [DOI] [PubMed] [Google Scholar]
- Schug J. Using TESS to predict transcription factor binding sites in DNA sequence. Curr Protoc Bioinformatics Chapter. 2008;2 doi: 10.1002/0471250953.bi0206s21. Unit 2.6. [DOI] [PubMed] [Google Scholar]
- Schwarzman AL, Goldgaber D. Interaction of transthyretin with amyloid Beta-protein: binding and inhibition of amyloid formation. In: Bock GR, Goode JA, editors. The nature and origin of amyloid fibrils. New York: Wiley; 1996. pp. 146–164. [DOI] [PubMed] [Google Scholar]
- Shoulders MD, Ryno LM, Cooley CB, Kelly JW, Wiseman RL. Broadly applicable methodology for the rapid and dosable small molecule-mediated regulation of transcription factors in human cells. J Am Chem Soc. 2013;135:8129–8132. doi: 10.1021/ja402756p. [DOI] [PMC free article] [PubMed] [Google Scholar]
- Sousa JC, Cardoso I, Marques F, Saraiva MJ, Palha JA. Transthyretin and Alzheimer's disease: where in the brain? Neurobiol Aging. 2007;28:713–718. doi: 10.1016/j.neurobiolaging.2006.03.015. [DOI] [PubMed] [Google Scholar]
- Stein TD, Johnson JA. Lack of neurodegeneration in transgenic mice overexpressing mutant amyloid precursor protein is associated with increased levels of transthyretin and the activation of cell survival pathways. J Neurosci. 2002;22:7380–7388. doi: 10.1523/JNEUROSCI.22-17-07380.2002. [DOI] [PMC free article] [PubMed] [Google Scholar]
- Stein TD, Johnson JA. Genetic programming by the proteolytic fragments of the amyloid precursor protein: somewhere between confusion and clarity. Rev Neurosci. 2003;14:317–341. doi: 10.1515/revneuro.2003.14.4.317. [DOI] [PubMed] [Google Scholar]
- Stein TD, Anders NJ, DeCarli C, Chan SL, Mattson MP, Johnson JA. Neutralization of transthyretin reverses the neuroprotective effects of secreted amyloid precursor protein (APP) in APPSW mice resulting in tau phosphorylation and loss of hippocampal neurons: support for the amyloid hypothesis. J Neurosci. 2004;24:7707–7717. doi: 10.1523/JNEUROSCI.2211-04.2004. [DOI] [PMC free article] [PubMed] [Google Scholar]
- Trinklein ND, Murray JI, Hartman SJ, Botstein D, Myers RM. The role of heat shock transcription factor 1 in the genome-wide regulation of the mammalian heat shock response. Mol Biol Cell. 2004;15:1254–1261. doi: 10.1091/mbc.E03-10-0738. [DOI] [PMC free article] [PubMed] [Google Scholar]
- Trott A, West JD, Klaiæ L, Westerheide SD, Silverman RB, Morimoto RI, Morano KA. Activation of heat shock and antioxidant responses by the natural product celastrol: transcriptional signatures of a thiol-targeted molecule. Mol Biol Cell. 2008;19:1104–1112. doi: 10.1091/mbc.E07-10-1004. [DOI] [PMC free article] [PubMed] [Google Scholar]
- Wang Z, Burke PA. Hepatocyte nuclear factor-4alpha interacts with other hepatocyte nuclear factors in regulating transthyretin gene expression. FEBS J. 2010;277:4066–4075. doi: 10.1111/j.1742-4658.2010.07802.x. [DOI] [PMC free article] [PubMed] [Google Scholar]
- Xue H, Slavov D, Wischmeyer PE. Glutamine-mediated dual regulation of heat shock transcription factor-1 activation and expression. J Biol Chem. 2012;287:40400–40413. doi: 10.1074/jbc.M112.410712. [DOI] [PMC free article] [PubMed] [Google Scholar]
- Yan C, Costa RH, Darnell JE, Jr, Chen JD, Van Dyke TA. Distinct positive and negative elements control the limited hepatocyte and choroid plexus expression of transthyretin in transgenic mice. EMBO J. 1990;9:869–878. doi: 10.1002/j.1460-2075.1990.tb08184.x. [DOI] [PMC free article] [PubMed] [Google Scholar]
- Yang J, Oza J, Bridges K, Chen KY, Liu AY. Neural differentiation and the attenuated heat shock response. Brain Res. 2008;1203:39–50. doi: 10.1016/j.brainres.2008.01.082. [DOI] [PubMed] [Google Scholar]
- Zhang Y, Huang L, Zhang J, Moskophidis D, Mivechi NF. Targeted disruption of hsf1 leads to lack of thermotolerance and defines tissue-specific regulation for stress-inducible Hsp molecular chaperones. J Cell Biochem. 2002;86:376–393. doi: 10.1002/jcb.10232. [DOI] [PubMed] [Google Scholar]
- Zuo J, Rungger D, Voellmy R. Multiple layers of regulation of human heat shock transcription factor 1. Mol Cell Biol. 1995;15:4319–4330. doi: 10.1128/mcb.15.8.4319. [DOI] [PMC free article] [PubMed] [Google Scholar]