

Abstract
The failure of the CNS neurons to regenerate axons after injury or stroke is a major clinical problem. Transcriptional regulators like Set-β are well positioned to regulate intrinsic axon regeneration capacity, which declines developmentally in maturing CNS neurons. Set-β also functions at cellular membranes and its subcellular localization is disrupted in Alzheimer's disease, but many of its biological mechanisms have not been explored in neurons. We found that Set-β was upregulated postnatally in CNS neurons, and was primarily localized to the nucleus but was also detected in the cytoplasm and adjacent to the plasma membrane. Remarkably, nuclear Set-β suppressed, whereas Set-β localized to cytoplasmic membranes promoted neurite growth in rodent retinal ganglion cells and hippocampal neurons. Mimicking serine 9 phosphorylation, as found in Alzheimer's disease brains, delayed nuclear import and furthermore blocked the ability of nuclear Set-β to suppress neurite growth. We also present data on gene regulation and protein binding partner recruitment by Set-β in primary neurons, raising the hypothesis that nuclear Set-β may preferentially regulate gene expression whereas Set-β at cytoplasmic membranes may regulate unique cofactors, including PP2A, which we show also regulates axon growth in vitro. Finally, increasing recruitment of Set-β to cellular membranes promoted adult rat optic nerve axon regeneration after injury in vivo. Thus, Set-β differentially regulates axon growth and regeneration depending on subcellular localization and phosphorylation.
Introduction
Axons do not regenerate after injury or stroke in the adult mammalian CNS (Goldberg and Trakhtenberg, 2012). In mammals, CNS axon regeneration capacity declines after birth (Goldberg et al., 2002; Blackmore and Letourneau, 2006) and is partially controlled by transcriptional regulators (Trakhtenberg and Goldberg, 2012), including Krüppel-like factors (KLFs; Moore et al., 2009, 2011; Blackmore et al., 2012) and P300 (Gaub et al., 2011), oncogenes such as PTEN and SOCS3 (Park et al., 2008; Sun et al., 2011), growth factors such as BDNF and CNTF (Harvey et al., 2012), and the development of an inhibitory extracellular environment (Yiu and He, 2006). The Set-β oncogene, also known as TAF-Iβ, PHAPII, and I2PP2A (von Lindern et al., 1992; Vaesen et al., 1994; Li et al., 1996; Nagata et al., 1998; Saito et al., 1999; Neviani et al., 2005) is predominantly a nuclear protein and regulates transcription (Seo et al., 2001; Gamble and Fisher, 2007), but also functions at the cellular membrane in Xenopus (Piper et al., 2008) and mammalian cells (Christensen et al., 2011; Vasudevan et al., 2011; Le Guelte et al., 2012). Set-β's subcellular localization is regulated by its nuclear localization signal (NLS) and phosphorylation (Adachi et al., 1994; Qu et al., 2007; ten Klooster et al., 2007; Lam et al., 2013), and is altered in Alzheimer's disease (Tanimukai et al., 2005; Yu et al., 2013). Because Set-β's developmental upregulation in retinal ganglion cells' (RGCs) nuclei (see Results) coincides with the onset of decline in their axon regeneration capacity (Goldberg et al., 2002), we hypothesized that nuclear Set-β would suppress axon growth. Remarkably, we found that Set-β's differential localization toggles its function between inhibiting and promoting CNS axon growth: nuclear Set-β suppressed neurite growth, whereas localization to cellular membranes promoted neurite growth in vitro and axon regeneration in vivo.
Materials and Methods
Animals.
All animal procedures were approved by the University of Miami Institutional Animal Care and Use Committee and by the Institutional Biosafety Committee at the University of Miami, and performed in accordance with the ARVO Statement for the Use of Animals in Ophthalmic and Visual Research. Sprague-Dawley rats were obtained from Harlan Laboratories, and C57BL/6J mice were obtained from Charles River Laboratories Animals of both sexes were used through the study in similar numbers.
Cell culture and reagents.
RGCs were purified from early postnatal (P3–P4) Sprague-Dawley rats or P5 C57BL/6J mice by immunopanning using antibodies against Thy1 (T11D7 from ATCC for rat, and CD90, MCA02R, Serotec, for mouse), as described previously (Meyer-Franke et al., 1995; Hu et al., 2010). RGCs were electroporated immediately after purification, as described previously (Corredor et al., 2012), plated at low density in 48-well tissue culture plates (Falcon) for quantification or on glass Lab-Tek II chamber slides (Thermo Fisher) for representative and Z-stack 3D images, on poly-d-lysine (10 mg/ml) and laminin (1 mg/ml; Life Technologies). RGCs were cultured for 1–4 d in defined growth medium consisting of Neurobasal media (Life Technologies) supplemented with sodium pyruvate, N-acetyl cysteine, l-glutamine, Sato supplement, insulin, BDNF, CNTF, and forskolin, as described previously (Meyer-Franke et al., 1995), and homemade supplement similar to B27 made as follows: reagents were purchased from Sigma-Aldrich unless specified. To 100 ml of neurobasal media (21103-049, Life Technologies) was added 12.5 g BSA (A4161), followed by addition of the following dissolved in 5 ml of sterile water: l-carnitine (C7518) 2 mg/ml, ethanolamine (E9508) 1 mg/ml, d(+)-galactose (G0625) 15 mg/ml, putrescine (P5780) 16.1 mg/ml, sodium selenite (S9133) 14.35 ng/ml, T3 (T6397) 2 mg/ml in 10% 1 N sodium hydroxide, and insulin (91077C) 4 mg/ml in 0.1% glacial acetic acid. Then the following reagents dissolved in 50 μl of 99% ethanol were added: corticosterone (C2505) 2 mg/ml, linoleic acid (L1012) 100 ng/ml, linolenic acid (L2376) 100 mg/ml, lipoic acid (T1395) 4.7 mg/ml, progesterone (P8783) 0.63 mg/ml, retinyl acetate (R7882) 10 mg/ml, retinol all-trans (95144) 10 mg/ml, α-Tocopherol (T3251) 100 mg/ml, and α-Tocopherol acetate (T3001) 100 mg/1 ml. Last, the following were added: catalase (C40) 80 mg, l-glutathione (G6013) 5 mg, transferrin (T1147) 10 mg, and superoxide-dismutase (S5395) equivalent of 6000 KU. The B27 substitute was filtered (0.22 μm) and stored at −80°C until used at a 1:50 dilution. Embryonic day (E)18 rat hippocampi were dissected and disassociated into single cells, as described previously (Kaech and Banker, 2006), electroporated as described previously (Moore et al., 2009), plated as described in this paragraph, and cultured for 24 h in defined growth medium, as described in this paragraph.
Constructs.
Mammalian pcDNA3.1 expression vectors N-terminally tagged with Xpress for wild-type Set-β, GFP for Set-βΔNLS (NLS sequence KRSSQTQNKASRKR deleted, gifts from Dianbo Qu, University of Ottawa), HA for myr-Set-β (myristoylation substrate sequence: MGCCVSSEPQEEGGRKT), myc for Set-β with Serine 9 (S9) mutated either to glutamic acid (AGT→GAG, gifts from Peter Hordijk, University of Amsterdam) or to alanine (AGT→GCT), as well as N-terminally tagged with DsRed PP2A-A in pDsRed-N1 vector (gift from Michael Kapiloff, University of Miami) and mCherry in pSPORT-6 vector. Expression in all constructs was driven by CMV promoter. Anti-Set-β shRNA (5′-ATTTGGCCAAATCCTTTGC-3′, RSH046403-3-HIVmU6) designed with OmicsLink proprietary algorithm and scramble shRNA control (5′-GCTTCGCGCCGTAGTCTTA-3′, CSHCTR001-HIVmU6) were both in psiHIV-mU6 vector with U6 driving shRNA expression and CMV driving mCherryFP reporter expression (Genecopoeia).
qRT-PCR.
The RNeasy Mini kit (74104, Qiagen) was used for RNA extraction from acutely purified E18, P8, and P21 Sprague-Dawley rats, according to the manufacturer's instructions, and RNA concentration was measured with Nanodrop 2000 Spectrophotometer (Thermo Scientific). Ninety nanograms of total RNA from each sample was reverse transcribed using iScript cDNA synthesis kit (Bio-Rad) according to the manufacturer's instructions, and quantitative-PCR performed using iQ5 SYBR Green (Bio-Rad) on an iCycler iQ5 quantitative RT-PCR (qRT-PCR) detection system (Bio-Rad) with Set-β primers (forward: 5′-CCGACGAGACCTCAGAAAAA-3′; reverse: 5′-AGCAGTGCAGACACTTGTGG-3′); cDNA template was diluted 100× for reactions with 18S primers (forward: 5′-CATTCTTGGCAAATGCTTTC-3′; reverse: 5′-GAACTGAGGCCATGATTAAGA-3′). Three to four replicate wells were used for each condition; standard no-template and no-RT controls were used. Fold-change was calculated using a standard qRT-PCR formula: 2^ − ([Avg(P4 RGC Set-β) − Avg(P4 RGC 18S)] − [Avg(E18 RGC Set-β) − Avg(E18 RGC 18S)]). Statistical analysis was performed with ANOVA and post hoc least significant difference (LSD; SPSS).
Immunocytochemistry, imaging, immunofluorescence, and neurite quantification.
Sprague-Dawley E19, P8, and P21 (for P21 also 5 d after injury; see last paragraph in this section on optic nerve injury) rat eyes were dissected and fixed for 2 h in 4% paraformaldehyde after puncturing the cornea, washed three times in PBS, incubated in 30% sucrose at 4°C, washed three times in PBS, cryopreserved in OCT with liquid nitrogen, and cryosectioned (30 μm). Retinal cryosections were mounted on Superfrost Plus micro slides (VWR), blocked and permeabilized with 20% goat serum and 0.5% Triton X-100 for 1 h, incubated overnight at 4°C with primary antibodies, Set-β (1:200, rabbit polyclonal antibody against N-terminal Set-β epitope, amino acids 3–14, gift from Suzanne Specht, NCI-NIH) and Brn3A (1:100, MAB1585, Millipore), washed three times in PBS, incubated overnight at 4°C with DAPI (1:3000, Life Technologies) and Alexa fluorophore-conjugated secondary antibodies (1:500, Life Technologies), washed three times in PBS, mounted in ProLong Gold (P36934, Life Technologies) with a glass coverslip, and imaged using confocal at 40× (LSM710, Zeiss). Nuclear and cytoplasmic average pixel intensity of Set-β immunofluorescence in RGCs was measured in Brn3A+ cells in the ganglion cell layer with AxioVision 4.8 (Zeiss). Three biological replicates with at least 85 randomly selected RGCs per experiment were subjected to statistical analysis with ANOVA and post hoc LSD, with day of the experiment treated as a random (blocking) factor (SPSS).
Immunostaining of cultured RGCs or hippocampal neurons was performed similarly, with fixation for 30 min in 4% paraformaldehyde, and block and permeabilization with 10% goat serum and 0.2% Triton X-100 for 30 min, except for staining with membrane markers for which permeabilization was minimized. Primary antibodies included rabbit anti-Set-β (as in the previous paragraph), mouse Ox7 (hybridoma supernatant; ATCC) and Vc1.1 (hybridoma supernatant; Kunzevitzky et al., 2010), mouse anti-Xpress (1:300; R91025, Life Technologies), mouse anti-myc (1:300; sc-40, SCBT), mouse anti-HA (1:400; H3663, Sigma-Aldrich), rabbit anti-Tuj1 (1:350; MRB-435P, Covance), mouse anti-Tuj1 (1:350; MMS-435P, Covance), chicken anti-MAP2 (1:10,000; ab5392, Abcam), and mouse anti-PP2A-A (1:200; sc13600, SCBT). Images of transfected cells were acquired at 20× on an AxioObserver.Z1 (Zeiss). Total neurite length, average number of branches per neurite, and the number of neurites per cell were quantified in masked fashion using Skeletonize and AnalyzeSkeleton ImageJ Plugins. mCherry-transfected neurons were quantified for controls and for data normalization, and are represented by the 0 baseline in the graphs. Statistical analysis used ANOVA and post hoc LSD, with day of experiment treated as a random (blocking) factor as described in the previous paragraph. Representative and Z-stack 3D images of cells plated on glass or of retinal cryosections (as described in the previous paragraph) were acquired on a confocal fluorescent LSM710 microscope (Zeiss) and processed using ZEN software (Zeiss). Images spanning more than one field-of-view were stitched using Photoshop CS5 (Adobe).
Survival assay.
Acutely purified P4 RGCs transfected with mCherry and Xpress-tagged wild-type Set-β, were plated at low density in 48-well tissue culture plates in defined growth medium, as described in Cell culture section. Three biological replicates each counted >1300 cells per condition in each experiment. Statistical analysis was performed with ANOVA and post hoc LSD, with day of the experiment treated as a random (blocking) factor, as described in the previous section. In parallel, at 1, 2, and 3 d, the number of RGCs per unit area transfected with mCherry and Xpress-tagged wild-type Set-β (immunostained as described in the Cell culture section), were counted using AxioVision 4.8 (Zeiss) and normalized to 1 d (106 cells per condition). Statistical analysis was performed using ANOVA with repeated measures and post hoc LSD (SPSS).
FACS and microarrays.
Acutely purified P4 RGCs transfected with mCherry, Xpress-tagged wild-type Set-β, and HA-tagged myr-Set-β, and cotransfected with pMAX-GFP (Lonza) constructs, were plated at high density on uncoated glass Lab-Tek II chamber slides (Thermo Fisher Scientific). The following morning, after gentle trituration, GFP-positive cells were fluorescence-activated cell sorting (FACS)-isolated at 37°C in PBS with BD FACSAria I cell sorter at 20 psi using a 130 μm nozzle; GFP-negative threshold was set by first processing untransfected RGCs. Cells were gated on a FSC-A versus SSC-A plot to exclude dead cells and/or debris, and aggregates were removed using single cell gating with FSC-H versus FSC-W and SSC-H versus SSC-W plots. Immediately after isolation, GFP-positive cells were diluted in pre-equilibrated growth medium, centrifuged 15 min at 80 × g, resuspended in growth medium in a 48-well tissue culture plastic plate as described in Materials and Methods, and cultured two more days in growth medium, as described in Materials and Methods. The Quick-RNA MicroPrep kit (R1050, Zymo Research) was used for RNA extraction 3 d after transfection, according to the manufacturer's instructions. Total RNA were used as input for the whole transcriptome amplification Ovation Pico WTA System V2 kit (3302-12, NuGEN), the cDNA product was quantified with Nanodrop 8000 Spectrophotometer (Thermo Scientific) and its quality was examined with a Bioanalyzer 2100 using the Nano 6000 kit (Agilent). Five micrograms of cDNA product from each sample was used as input for fragmentation and labeling using the Encore Biotin Module kit (4200-12, NuGEN); the fragmentation product quality was again tested by Bioanalyzer. The labeled product was hybridized to whole genome GeneChip Rat Gene 2.0 ST Arrays (Affymetrix). The staining, washing and scanning of the arrays was performed using a Fluidics 450 station, GeneChip Operating Software and GeneChip Scanner 3000 7G (Affymetrix). Image intensities were analyzed with Expression Console (Affymetrix) from CEL files for quality control using standard GeneChip Rat Gene 2.0 ST Array control probes (Affymetrix), and to determine the expression values and for annotations. Microarray data were deposited under NCBI GEO (accession GSE56951). Expression values were normalized to the median for each sample.
Cell fractionation and Western blots.
Twelve million E18 rat hippocampal neurons purified as described in the Cell culture section, were separated into cytoplasmic and nuclear fractions, as described previously (Carmona-Mora et al., 2012). Briefly, cells were washed twice in 1 ml of Dulbecco's PBS by centrifuging 5 min at 600 × g at 4°C, resuspended in 40 μl cytoskeleton buffer (10 mm pipes pH 6.8, 100 mm NaCl, 300 mm sucrose, 3 mm MgCl2, 1 mm EGTA, and 0.5% Triton X-100) per million cells. The upper half of the supernatant was isolated as the cytoplasmic fraction, and the pellet was washed again and resuspended in 20 μl Cell Lysis Buffer (9803S, Cell Signaling Technology) per million cells as the nuclear fraction. Fractions were sonicated (Bioruptor UCD-200TN-EX, Diagenode) at 4°C 5 times for 1 min with 20 s intervals and the output selector switched to high, and stored immediately at −80°C; protease (11836153001, Roche) and phosphatase (78428, Pierce) inhibitors were added at 1 tablet per 10 ml or 1×, respectively, recommended dilutions. Fraction lysates were immunoblotted with rabbit anti-GAPDH (1:2000; 14C10, Cell Signaling Technology) and rabbit anti-acetyl-histone H3 (1:3000; 06599, Millipore). For whole-cell protein RGCs Western blotting, 1.5 million P5 rat RGCs acutely purified as above were processed the same way and immunoblotted with rabbit anti-Set-β (1:6000; as described in the Immunocytochemistry section).
For Western blotting, lysates in LDS sample buffer (4×; NP0007, Life Technologies) with 10 mm dithiothreitol (DTT) were incubated at 98°C for 5 min, electrophoresed on 8–16% NuPAGE SDS-PAGE gradient gel (Life Technologies), transferred to post-transferred polyvinylidene fluoride membranes (Millipore), blocked in 3% BSA, 0.1% Tween20 at pH 7.6 for 1 h, incubated at 4°C overnight in block with primary antibodies, washed in PBST 3 times, incubated with horseradish peroxidase-conjugated anti-rabbit IgG (1:2500; SCBT) for 2 h at room temperature, washed in PBST 3 times, and developed with SuperSignal West Pico Chemiluminescent Substrate (34077, Thermo Scientific). The blots were imaged using LAS3000 (Fujifilm) and processed with Multi Gauge (Fujifilm).
IP.
For sample preparation, for E18 rat hippocampal neuron fractions, lysates were extracted as described in previous paragraph. For E18 rat brain or hippocampal homogenates, acutely dissected hippocampi or cortices were frozen in liquid nitrogen and homogenized using a cold mortar and pestle, resuspended in immunoprecipitation (IP) buffer (87787, Pierce) with protease (11836153001, Roche) and phosphatase (78428, Pierce) inhibitors at one tablet per 10 ml or 1×, respectively, recommended dilutions, sonicated as described in previous paragraph, centrifuged at 12,000 × g for 10 min at 4°C, and the supernatant immediately stored at −80°C. For IP, 4 μg of anti-Set-β (as above) or control rabbit IgG (2729, Cell Signaling Technology) antibody were incubated with 20 μl of Protein A/G Plus Agarose beads (sc2003, SCBT) rotating in 500 μl of 0.02% PBST buffer at 4°C for 1 h. The beads were washed in PBST twice, crosslinked to antibodies using BS3 (21585, Thermo Scientific) in conjugation buffer followed by quenching buffer, and washed with IP buffer three times. Four milligrams of protein extracts were first precleared by incubating for 1 h with 20 μl of uncoated beads at 4°C, centrifuged at 2000 rpm for 1 min, and the supernatant then incubated overnight at 4°C with the beads crosslinked to antibodies. The IP beads were then diluted to 350 μl in IP buffer with protease and phosphatase inhibitors, washed with IP buffer three times, resuspended in 40 μl of 2× LDS sample buffer (NP0007, Life Technologies) with 10 mm DTT, incubated at 95°C for 5 min, centrifuged at 2000 rpm for 1 min, and the supernatant immediately stored at −80°C. Immunoprecipitated proteins were either immunoblotted as described in previous paragraph, using rabbit anti-Set-β (1:6000; as above) or mouse anti-PP2A-A (1:6000; sc13600, SCBT) and anti-mouse IgG (1:2500, SCBT), or processed with mass spectrometry, as follows.
Mass spectrometry.
In two parallel preps, 40 million E18 rat hippocampal neurons were purified and separated into cytoplasmic and nuclear fractions, as described in the section Cell fractionation, and the replicate samples were processed in parallel through the rest of the experiment. Proteins were coimmunoprecipitated using anti-Set-β or normal rabbit IgG antibody, as described in the previous paragraph, except after samples were incubated overnight with the beads, they were washed with NP-40 (1% in PBS) three times followed by 50 mm ammonium bicarbonate three times. Protein concentrations were determined by Bradford assay (Bio-Rad), using BSA standards. For the cytoplasmic fractions, 4.8 μg of all four Set-β and rabbit IgG IP samples each were diluted to 30 μl in a solution of 0.1% RapiGest (Waters) 50 mm ammonium bicarbonate; for the nuclear fractions, 4.8 μg of Set-β IP samples 1 and 2.6 μg of Set-β IP sample 2 and rabbit IgG IP samples 1 and 2 each were diluted to 32 μl in a solution of 0.1% RapiGest (Waters) 50 mm ammonium bicarbonate. The samples were incubated at 40°C with shaking for 10 min. Reduction was accomplished using 10 mm dithiothreitol at 80°C for 15 min and alkylation was performed using 20 mm iodoacetamide in the dark at room temperature for 30 min. Trypsin digestion with a 1:50 enzyme/protein ratio was performed overnight at 37°C with shaking. Trifluoroacetic acid and acetonitrile were added to final concentrations of 1% and 2% respectively. The samples were incubated at 60°C for 2 h to cleave the RapiGest, and lyophilized and resuspended in 12 μl of 1% trifluoroacetic acid/2% acetonitrile in water. LC/MS/MS data were obtained using 1 μl of protein digest per sample, using a nanoAcquity UPLC system (Waters) coupled to a Synapt G1 HDMS high-resolution accurate mass tandem mass spectrometer (Waters) via a nanoelectrospray ionization source. Briefly, the sample was first trapped on a Symmetry C18 300 × 180 mm trapping column (5 μl/min at 99.9/0.1 v/v water/acetonitrile), after which the analytical separation was performed using a 1.7 μm Acquity BEH130 C18 75 × 250 mm column (Waters) using a 30 min gradient of 5–40% acetonitrile with 0.1% formic acid at a flow rate of 300 nl/min with a column at 45°C. Data collection on the Synapt G2 mass spectrometer was performed in Data Dependent Acquisition mode (DDA). The DDA was processed using Mascot Daemon 2.2.2, Mascot Distiller 2.4.3.3 and Mascot Server 2.2 (Matrix Science), searching against the NCBInr database, using Rattus Taxonomy. Carbamidomethyl Cys was searched as a fixed modification, and oxidized Met and deamidated Gln and Asn were allowed as variable modifications. For analysis, proteins identified with a threshold false discovery rate (FDR) of 1.3 in both cytoplasmic fractions of Set-β IP samples but in neither of cytoplasmic fractions of rabbit IgG IP samples, and a protein identified with FDR of 2.6 in both nuclear fractions of Set-β IP samples but in neither of nuclear fractions of rabbit IgG IP samples, were considered positive hits.
Optic nerve injury, RGC survival, and axon regeneration measurements.
Sprague-Dawley rats (150–250 g) were anesthetized before all surgical procedures by an intraperitoneal injection of ketamine (60 mg/kg) and xylazine (8 mg/kg). Following surgery, animals recovered on a heating pad and were given subcutaneous injections of buprenorphine HCl (0.05 mg/kg) twice a day for three consecutive days to minimize discomfort. Rats were intravitreally injected in the left eye with 3 μl of AAV2-eGFP or AAV2-myr-Set-β-eGFP (titers ∼2 × 10¹² GC/ml) at P21, P23, and P25, just posterior to the pars plana with a 31 gauge needle (Hamilton) on a 5 μl Hamilton syringe. Care was taken not to damage the lens. Two weeks after injection, transduction efficiency was ∼20% based on eGFP expression, and optic nerve injury was induced at this time point as follows. The left optic nerve was exposed from temporal side and crushed gently with Dumont no. 5 forceps (Fine Science Tools) for 5 s ∼1–2 mm behind the optic disc, to minimize the damage to the tissue through which regenerating axons would regrow (Tan et al., 2012). Care was taken to avoid damaging the central retinal arterial blood supply to the retina. Intravitreal injections of 2 μl cholera toxin subunit B (CTB AlexaFluor 594, 5 μg/μl; C22841, Life Technologies) were performed 2 d before animals were killed at 2 or 3 weeks after optic nerve injury. Care was taken not to damage the lens. Retinas and optic nerves were dissected and fixed in 4% PFA for 2 h followed by 20% sucrose overnight at 4°C. Optic nerves were sectioned with 10 μm thickness, longitudinally, mounted on Superfrost Plus micro slides (VWR), imaged at 20× using Imager.Z1 (Zeiss), and images processed with AxioVision 4.8 (Zeiss). Retinal flatmounts were processed similarly, stained with DAPI, and immunostained with Brn3A; although Brn3A expression decreases after optic nerve injury, it is still detectable and useful to quantify and compare RGC survival across treatment conditions (Nadal-Nicolás et al., 2009). To assess survival, Brn3A+/DAPI+ cells in the RGC layer were manually quantified in 10–12 0.2 mm2 fields of view randomly distributed through the retina and analyzed with t test, two-tailed (SPSS); we report the data as RGC density per mm2. Regenerating RGC axons in injured optic nerves distal to the crush site were quantified with the method described previously (Park et al., 2008; Smith et al., 2009). The researcher who performed quantifications was masked to the samples' identities. For axon regeneration quantification, the number of CTB-labeled fibers extending different distances from the end of the crush site was counted in every fourth section of each optic nerve. The width of the nerve at the point at each distance was measured and used to calculate the number of axons per millimeter of nerve width. The average number of all sections was considered as axons per millimeter width. The total number of axons extending distance, d, in a nerve with a radius, r, was estimated by summing over all sections having a thickness t (10 μm): Σad = πr2 x (average axons/mm)/t. For the representative images, imaged sections of single representative optic nerves were stitched and merged from 22 sections using Photoshop CS5 (Adobe). Statistical analysis was performed using ANOVA with repeated measures and LSD post hoc (SPSS).
Results
The Set locus encodes Set-α and -β isoforms, differing only by the first exon (Nagata et al., 1995), which contains the epitope for the Set-β-specific antibody used through this study. Our RNA-seq analysis showed that Set-β is the predominantly expressed isoform in RGCs (Fig. 1A; Set locus RNA-seq reads raw data are available upon request), and Western blot confirmed the expression of the full-length 39 kDa Set-β protein (Nagata et al., 1995) in RGCs (Fig. 1B). qRT-PCR on purified RGCs showed that Set-β transcript is upregulated twofold (p < 0.01) postnatally but then declined to slightly below embryonic level (not statistically significantly) in adult RGCs (Fig. 1C). This developmental expression profile resembles that of another axon growth-suppressing transcriptional regulator, KLF4 (Moore et al., 2009; Blackmore et al., 2012), although we did not find that KLFs or Set-β regulate each other's expression (see paragraph in this section describing Fig. 5).
Figure 1.
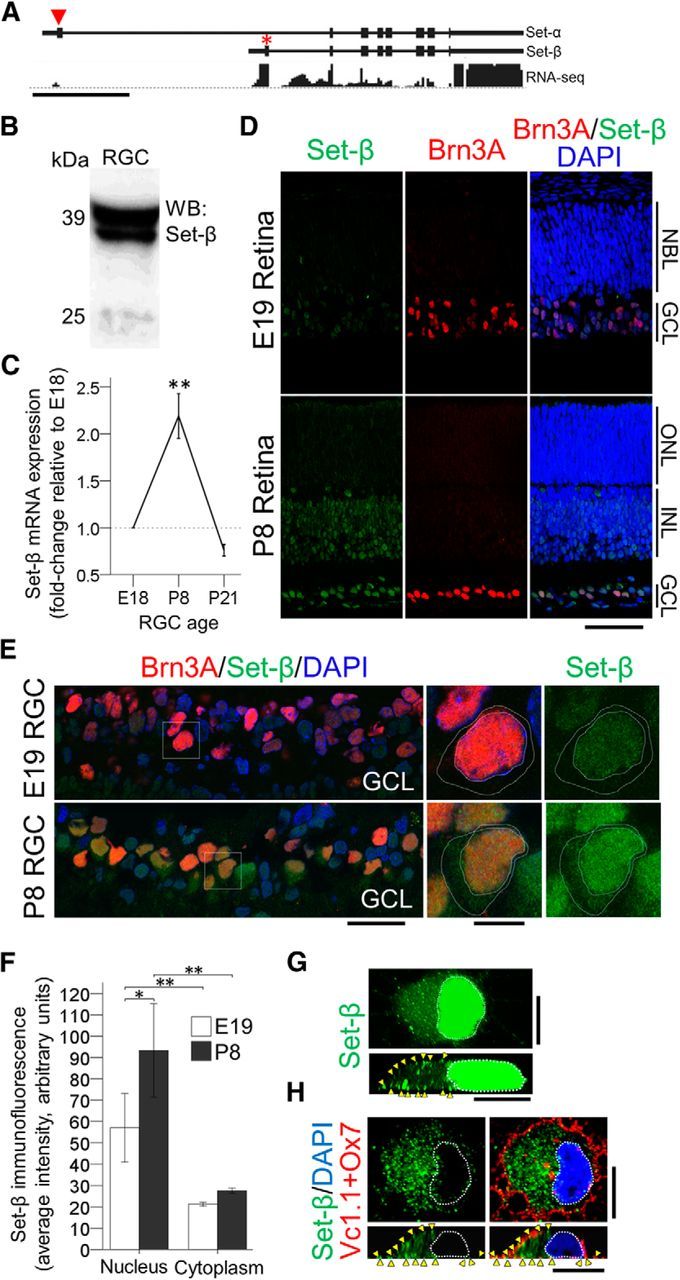
Set-β expression and developmental regulation in RGCs. A, RNA-seq on acutely purified P5 RGCs shows significantly more reads aligning uniquely to Set-β-specific exon as compared with the Set-α-specific exon (red arrowhead Set-α, red asterisk Set-β). Mouse transcripts and alignment to genome visualized using the Genomatix Genome Browser. Scale bar, 2 kb. B, Acutely purified P5 RGCs immunoblotted for Set-β. C, qRT-PCR from acutely purified E18, P8 and P21 rat RGCs with Set-β-specific primers normalized to 18S demonstrated that Set-β mRNA is upregulated at P8 and then declined by P21 (n = 7–8, mean ± SEM shown; **p < 0.01 by ANOVA with post hoc LSD). D, E, E19 and P8 retinal sections were immunostained for Set-β and Brn3A (RGC marker), and counterstained with DAPI (nuclear marker), as marked (D); scale bar, 250 μm. Example RGCs and their nuclei are outlined with dashed white lines (E). Scale bars: 100 μm; insets, 25 μm. GCL, Ganglion cell layer; INL, inner nuclear layer; ONL, outer nuclear layer; NBL, neuroblast layer. F, Analysis of nuclear and cytoplasmic average pixel intensity of Set-β immunofluorescence in E19 and P8 RGCs showed that Set-β immunoreactivity is predominantly nuclear, although also detected in the cytoplasm, and was more intense in postnatal RGCs' nuclei. (N = 3; ≥85 randomly selected RGCs per experiment. Mean ± SEM shown; *p < 0.05, **p < 0.01 by ANOVA with post hoc LSD). G, H, P4 RGC immunostained at 1 d for endogenous Set-β after permeabilization (G), and Vc1.1 and Ox7 (cell surface markers) without permeabilization (see Materials and Methods), to confirm Set-β localization in the cytoplasm and at the membrane (H). Images with confocal microscopy: (top) nucleus outlined with dashed white line in X,Y planes; (bottom) distinct punctae (arrowheads) at the membrane in Z planes. Scale bars, 10 μm.
Figure 5.

Set-β regulates transcription. A, Experimental timeline for microarray analysis of transfected and FACS-sorted RGCs (see Materials and Methods for details). B, The number of gene probes regulated at least 1.75-fold with p < 0.05 (N = 3, t test, two-tailed) is higher after wild-type Set-β than myr-Set-β expression, relative to control mCherry expression. C, A subset of genes regulated by myr-Set-β are also regulated by wild-type Set-β.
We immunostained embryonic and postnatal retinal sections for Set-β and the RGC marker Brn3A, and found that Set-β immunofluorescence intensity was predominantly nuclear, and was stronger in postnatal RGCs' nuclei (Fig. 1D–F), but distinct punctae were detected in RGCs' cytoplasm and at cellular membranes (Fig. 1G,H). In a separate set of experiments we found that Set-β immunofluorescence intensity was also predominantly nuclear in adult RGCs in retinal sections (see Fig. 7A,B, uninjured). Although mean nuclear to cytoplasmic signal ratio trended down from 2.7 (P8) to 2.1 (P21), the difference was not significant (p = 0.23, t test, two-tailed). The N-terminal-directed Set-β antibody we used (Fig. 2A) was previously validated for specificity for Western blot and immunofluorescence (Adachi et al., 1994), and we saw no background staining in no-primary or irrelevant-primary controls. We also performed a bioinformatics analysis to predict whether Set-β could be recruited to the cellular membrane directly, but we did not identify transmembrane domains in Set-β using NCBI Conserved Domains and UniProtKB/Swiss-Protal tools. We also did not find in Set-β motifs predicted for lipid modification, specifically, we analyzed for palmitoylation (http://www.bioinfo.tsinghua.edu.cn/∼tigerchen/NBA-Palm; Xue et al., 2006), myristoylation (http://web.expasy.org/myristoylator; Bologna et al., 2004), glycosylphosphatidylinositol-anchor (http://gpi.unibe.ch, Fankhauser and Mäser, 2005), and farnesylation and geranylgeranylation (http://mendel.imp.ac.at/sat/PrePS; Maurer-Stroh and Eisenhaber, 2005). Thus Set-β's developmental expression profile in RGCs exhibits a postnatal peak, and Set-β protein is predominantly nuclear but is also detected in the cytoplasm and by cytoplasmic membranes through development.
Figure 7.
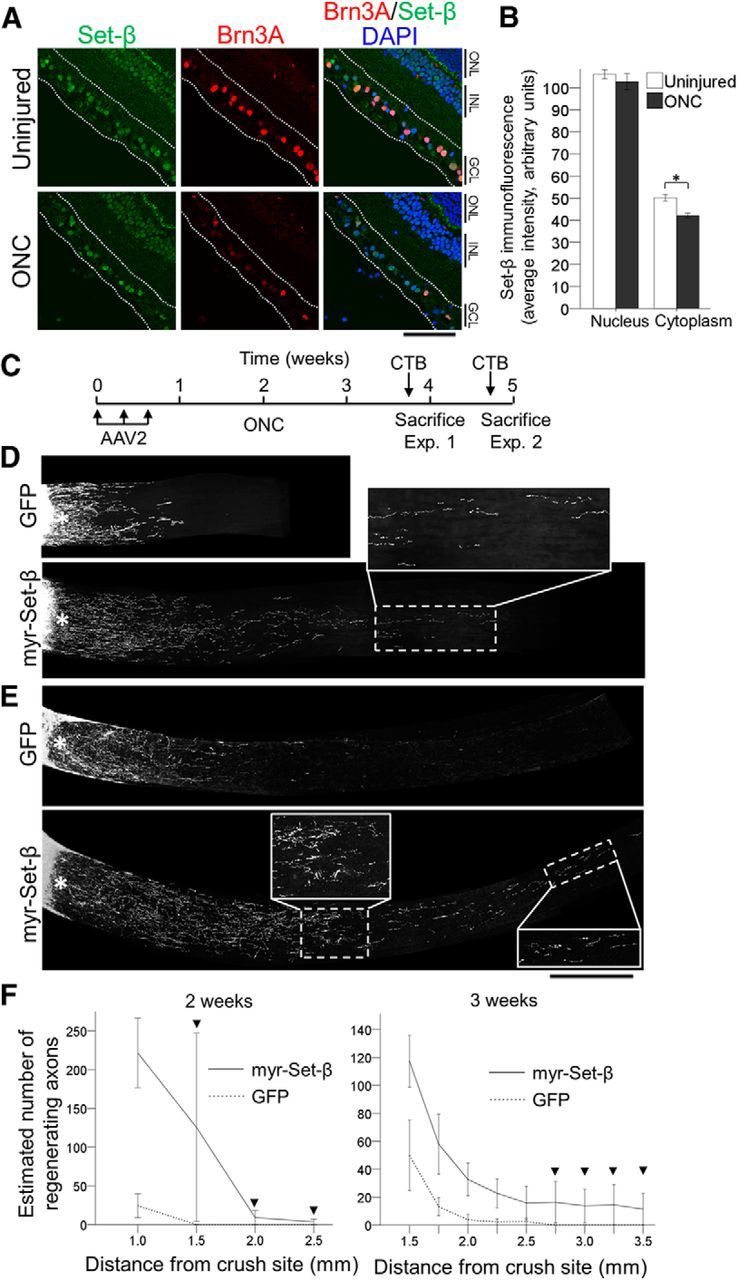
Myr-Set-β promotes axon regeneration after optic nerve injury in vivo. A, Adult retinal sections from uninjured animals and 5 d after optic nerve crush (ONC) injury were immunostained for Set-β and Brn3A, and counterstained with DAPI (nuclear marker), as marked. Scale bar, 500 μm. GCL, Ganglion cell layer; INL, inner nuclear layer; ONL, outer nuclear layer. B, Analysis of nuclear and cytoplasmic average pixel intensity of Set-β immunofluorescence in injured (ONC) and uninjured RGCs showed that Set-β immunoreactivity mildly decreased in the cytoplasm, although signal intensity was similar in the nucleus. (N = 3; ≥85 randomly selected RGCs per experiment; mean ± SEM shown; *p < 0.05, by ANOVA with post hoc LSD). C, Experimental time-line for optic nerve regeneration experiments with myr-Set-β. D–F, Optic nerves, treated with control GFP or myr-Set-β AAV2 vectors as marked, 2 (D) or 3 (E) weeks after injury. Scale bar, 500 μm; insets, 250 μm (images of merged multiple sections shown). F, Axon regeneration at 2 (left) and 3 (right) weeks after injury demonstrates significantly greater regeneration at increasing distances down the optic nerve. At the longer distances, regenerating axons were only detected in the myr-Set-β-treated retinas (arrowheads; ≥4 animals per group; mean ± SEM shown; p < 0.05 at 2 weeks and p < 0.01 at 3 weeks by ANOVA with repeated measures, post hoc LSD).
Figure 2.
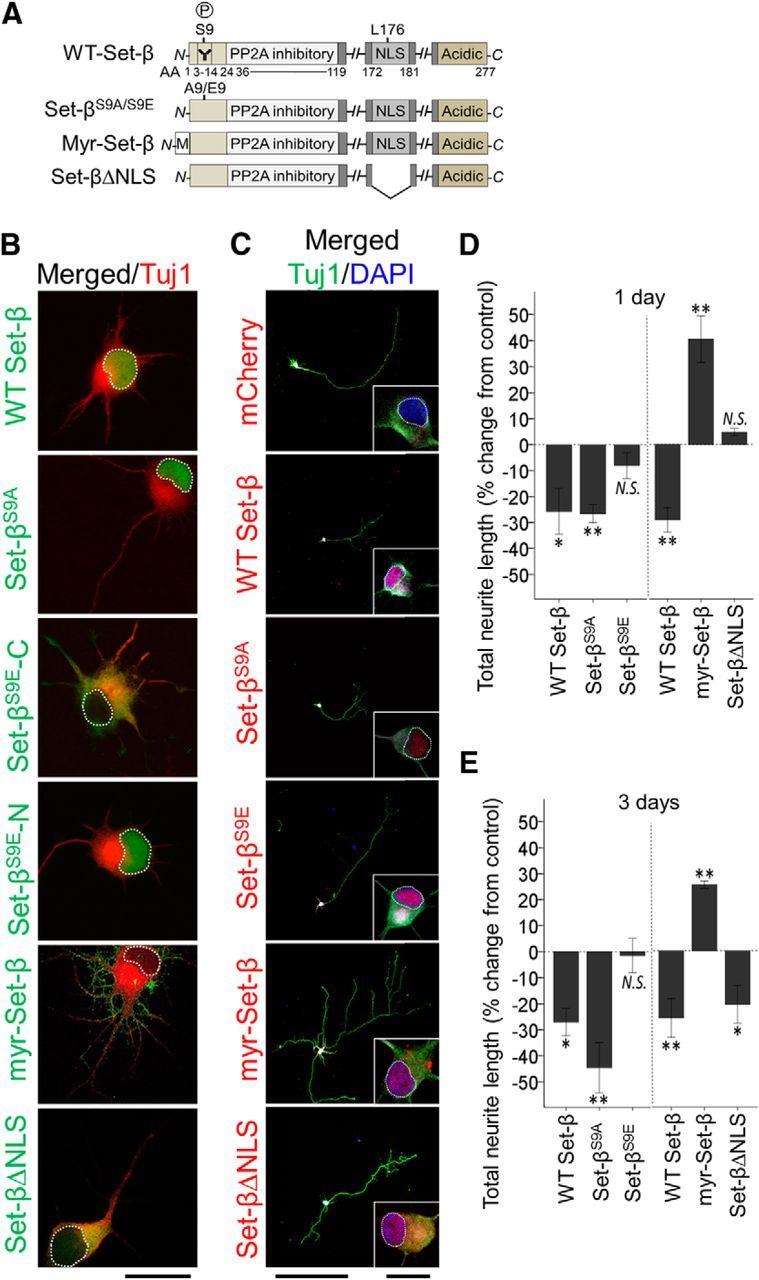
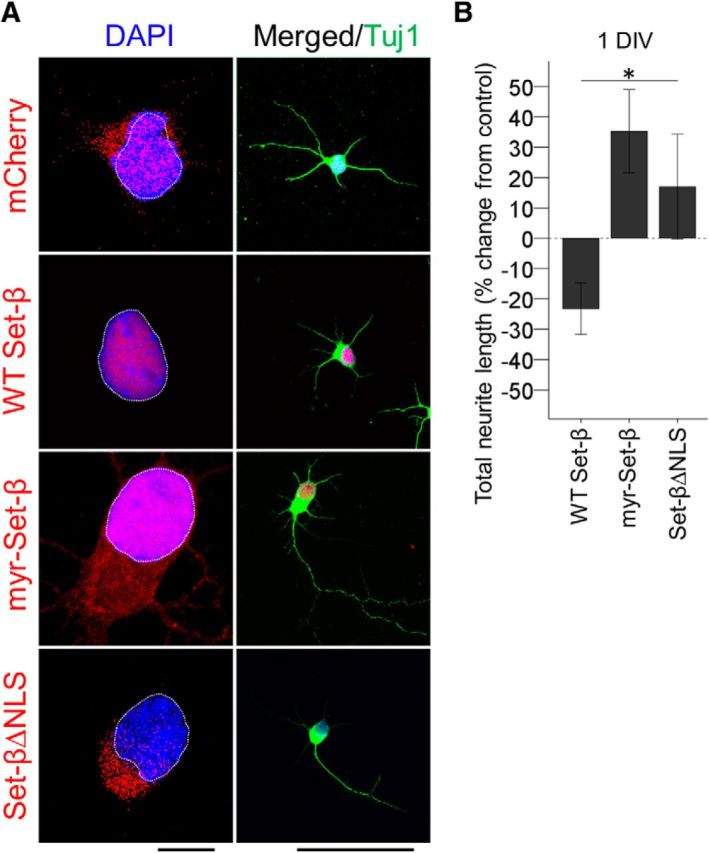
Set-β and Set-β mutants' subcellular localization and effects on neurite growth. A, Set-β domains and mutant constructs, highlighting S9 phosphorylation site (P) and β isoform-specific antibody epitope (Y), PP2A inhibitory domain, NLS, myristoylation (M) tag, and acidic C-terminal domain. B, RGCs transfected with mCherry control or with tagged Set-β constructs as marked, were immunostained at 1 d for Tuj1 (neurite marker, red) and for Set-β tags (green). Set-β, Set-βS9A, and in one third of RGCs Set-βS9E localized to the nucleus (example marked Set-βS9E-N). Set-βΔNLS and one third of Set-βS9E localized to the cytoplasm (labeled Set-βS9E-C). The last third of Set-βΔE localized to both nucleus and the cytoplasm, data not shown. Myr-Set-β localized to cellular membranes and neurites. Scale bar, 20 μm. C, RGCs transfected with mCherry or tagged Set-β constructs as marked, were immunostained at 3 d for fused tags (red), Tuj1 (neurite marker, green), MAP2 (dendrite marker, data not shown), and counterstained with DAPI (nuclear marker, blue). Set-β, Set-βS9A, and Set-βS9E in all cells localized to the nucleus, Set-βΔNLS and myr-Set-β localized to nucleus and cytoplasm, and myr-Set-β also localized to cellular membranes and neurites. Nucleus outlined with dashed white line. Scale bars, 500 μm; insets, 20 μm. D, E, At 1 (D) and 3 (E) days, Tuj1-positive neurites of transfected RGCs were traced. Set-β and Set-βΔS9A significantly suppressed neurite growth, whereas Set-βS9E-N failed to meaningfully suppress neurite growth (N = 3; ≥30 neurons per experiment, mean ± SEM normalized to mCherry shown; *p < 0.05, **p < 0.01 by ANOVA with post hoc LSD). Myr-Set-β significantly increased neurite growth, whereas Set-βΔNLS only affected neurite growth at 3 d (N = 3; ≥30 neurons per experiment, mean ± SEM normalized to mCherry shown; *p < 0.05, **p < 0.01 by ANOVA with post hoc LSD).
To test whether Set-β regulates axon growth we expressed Set-β in postnatal RGCs (Fig. 2A). Set-β localized to the nucleus (Fig. 2B,C), similar to endogenous Set-β (Fig. 1G), and suppressed neurite growth (Fig. 2D,E). In this and all subsequent experiments with Set-β, we immunostained for Tuj1 (axon and dendrite marker), and also with MAP2 (somatodendritic marker) after 3–4 d in culture, and in all cases there was never any obvious change unique to MAP2-positive dendrite growth, suggesting that all effects were on axon growth or neurites in general. Knockdown of Set-β with shRNA promoted neurite growth by 11% at 4 d (N = 3; ≥30 neurons per experiment, p < 0.05 by ANOVA with post hoc LSD). The number of neurites per cell and the number of branches per neurite did not change significantly with Set-β expression or knockdown (ANOVA, post hoc LSD). Set-β expression was not associated with a generalized cellular toxicity (Fig. 3) nor did Set-β knockdown overtly affected survival. Together, these data suggest through overexpression and knockdown approaches that endogenous nuclear Set-β suppresses neurites and axon elongation.
Figure 3.
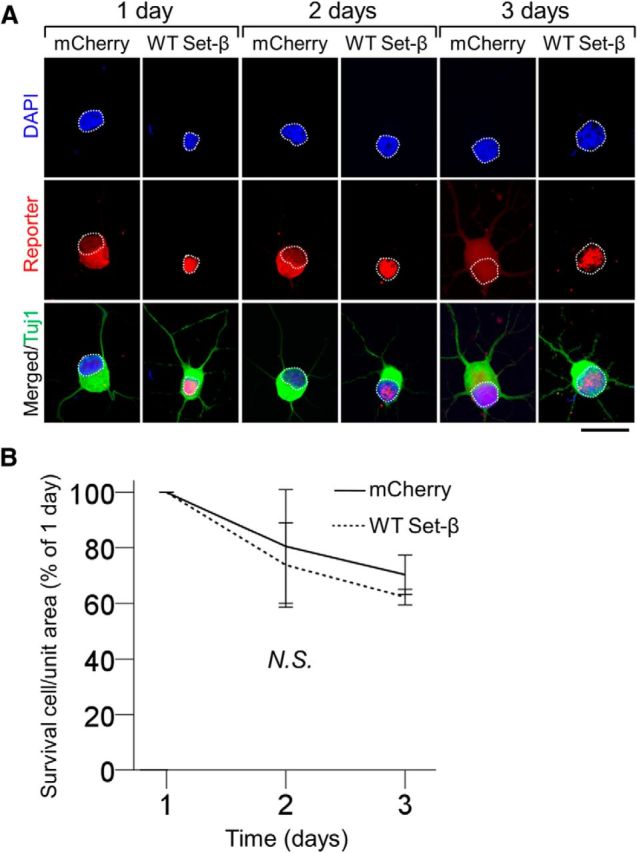
Set-β expression is not associated with generalized cellular toxicity. A, Acutely purified P4 RGCs transfected with mCherry or wild-type Set-β were immunostained at 1, 2, and 3 d for reporter tag (red), Tuj1 (neurite marker, green), and counterstained with DAPI (nuclear marker, blue). Nuclei outlined with white dashed line. Scale bar, 20 μm. B, At 1, 2, and 3 d, the number of RGCs transfected with constructs as marked were counted per unit area normalized to 1 d (106 cells per condition); no significant difference between the conditions was observed (mean ± 95% CI shown; nonsignificant by ANOVA with repeated measures, with post hoc LSD). N.S., Not significant.
S9 phosphorylation has been shown to modulate Set-β's nuclear import in non-neuronal cells (ten Klooster et al., 2007) and is enriched in AD patients' neurons (Yu et al., 2013). We asked whether S9 phosphorylation modulates Set-β's subcellular localization or effect on axon growth in neurons using alanine (Set-βS9A) as a nonphosphorylatable residue, or glutamic acid (Set-βS9E) as a phosphorylation mimic (Fig. 2A). We found that Set-βS9A was localized to the nucleus and suppressed neurite growth, whereas Set-βS9E was localized to both the nucleus and the cytoplasm at 1 d and only to the nucleus at 3 d, a delay in nuclear import; furthermore, Set-βS9E failed to suppress neurite growth when in the nucleus (Fig. 2B-E). At 3 d the number of neurites per cell did not change significantly with Set-β or Set-βS9A, and only slightly in Set-βS9E (average 5.3 neurites per cell, compared with 6.3 neurites per cell in control, p < 0.05 ANOVA, post hoc LSD). The number of branches per neurite did not change significantly in Set-β or Set-βS9E; there were 12.1% fewer branches per neurite in Set-βS9A compared with control (p < 0.05 ANOVA, post hoc LSD), consistent with Set-βS9A's strong overall suppressive effect on neurite growth. These data suggest that S9 phosphorylation delays but does not prevent Set-β's nuclear translocation in neurons, and that in the nucleus it blocks Set-β's suppressive effect on neurite growth.
Because Set-β also localizes to cellular membranes in RGCs (Fig. 1G) and can function there in other cells (Piper et al., 2008; Vasudevan et al., 2011; Le Guelte et al., 2012), we expressed Set-β fused to a myristoylation tag (myr-Set-β; Fig. 2A) which recruits proteins to cellular membranes (Peitzsch and McLaughlin, 1993). Myr-Set-β localized predominantly to cellular membranes (Fig. 2B,C). Unexpectedly, myr-Set-β increased total neurite growth at 1 and 3 d (Fig. 2D,E). The average number of branches per neurite was 7.2% higher after myr-Set-β expression; however, the difference was not statistically significant, suggesting that the myr-Set-β promotes elongation of neurites.
This neurite growth promotion could arise from Set-β's biological action at the cellular membrane, or through a dominant-negative effect, for example by retaining endogenous Set-β in the cytoplasm through dimerization (ten Klooster et al., 2007) or by interfering with endogenous Set-β's nuclear import machinery (Qu et al., 2007). To test these possibilities, we expressed Set-β with the NLS deleted (Qu et al., 2007; Set-βΔNLS; Fig. 2A). Set-βΔNLS localized predominantly to the cytoplasm at 1 d (Fig. 2B) and did not affect neurite growth (Fig. 2D); by 3 d Set-βΔNLS was also detected in the nucleus and suppressed neurite growth albeit to a lesser degree than the wild-type Set-β, consistent with its decreased nuclear import (Fig. 2C,E). Neither the number of neurites per cell nor branches per neurite changed significantly in either condition (ANOVA, post hoc LSD). As Set-βΔNLS in the cytoplasm failed to act as a dominant-negative and promote growth, these data suggest that Set-β at cellular membranes promotes neurite growth due to local activity there. In primary culture of embryonic (E18) hippocampal neurons, similar results were seen for effects of wild-type Set-β, myr-Set-β, and Set-βΔNLS on localization and neurite growth (Fig. 4), although in the hippocampal neurons the myr-Set-β appeared to also be detected in the nucleus as early as after 1 d in culture, whereas in RGCs nuclear myr-Set-β punctae was detected only after 3 d; nevertheless, the cytoplasmic myr-Set-β was sufficient in all cases to promote neurite growth (Fig. 4). Together, these data support a model in which nuclear Set-β suppresses axon growth and membrane-localized Set-β promotes axon growth, and suggest that Set-β's differential promotion versus inhibition of neurite growth depending on subcellular localization is robust across populations of CNS neurons.
Figure 4.
Set-β suppresses and myr-Set-β increases neurite growth of hippocampal neurons. A, E18 hippocampal neurons transfected with mCherry or Set-β constructs were immunostained at 1 d for Tuj1 and fusion tags and counterstained with DAPI, as marked. Set-β localized to the nucleus, myr-Set-β localized to the nucleus, cytoplasm, cellular membranes, and neurites, and Set-βΔNLS localized predominantly to the cytoplasm. Nucleus outlined with dashed white line. Scale bars: left, 25 μm; right, 100 μm. B, At 1 d, wild-type Set-β suppressed whereas myr-Set-β increased neurite growth. Set-βΔNLS also promoted neurite growth but to a lesser extent (≥30 neurons per condition, mean ± SEM normalized to mCherry transfected cells shown; *p < 0.05 by ANOVA).
If Set-β has different mechanisms of action in promoting versus suppressing axon growth, we hypothesized that we should be able to detect differences in the molecular phenotypes between nuclear and membrane-directed Set-β. For example, Set-β is a transcriptional regulator (Seo et al., 2001; Gamble and Fisher, 2007) and may suppress axon growth in its nuclear localization by regulating genes' expression, whereas Set-β localized to cellular membranes may demonstrate less regulatory effect on gene expression due to decreased nuclear import. Indeed, wild-type Set-β regulated expression of significantly more genes than myr-Set-β (Fig. 5A,B; public repository GEO accession number pending), with a subset of genes regulated by both, albeit always in the same direction (Fig. 5C). However, these microarray data did not show that the expression of KLFs or other prominent regulators of axon growth were affected by Set-β expression. Conversely, in our studies of KLF biology, microarray-derived transcriptomes after expression of KLF4, -7, -9 -11, and -16 did not show significant changes in Set-β expression (our unpublished observations), suggesting that Set-β is not a gene target of KLFs in RGCs. We hypothesize that the small group of genes detected uniquely after myr-Set-β expression may have been regulated by its cytoplasmic activity, but have not tested that hypothesis here. These data also reveal potential downstream gene effectors regulating axon growth, and specific candidate genes (Table 1) could be validated and tested in future experiments to identify such effectors, but in any case these data point to differences in gene target regulation by nuclear and membrane-localized Set-β.
Table 1.
List of genes regulated by wild-type Set-β and myr-Set-β expression
| Probe ID | Gene symbol | mCherry (mean) | WT-Set-β (mean) | myr-Set-β (mean) | WT-Set-β: mCherry FC (p value) | myr-Set-β: mCherry FC (p value) |
|---|---|---|---|---|---|---|
| 17708398 | 238.8 | 31.8 | 106.6 | −7.51 (0.02) | −2.24 (N.S.) | |
| 17686716 | 116.7 | 19.6 | 108.4 | −5.95 (0.01) | −1.08 (N.S.) | |
| 17671809 | 519.1 | 97.3 | 234.0 | −5.33 (0.00) | −2.22 (N.S.) | |
| 17764004 | 165.6 | 33.3 | 158.6 | −4.97 (0.01) | −1.04 (N.S.) | |
| 17787097 | 189.2 | 40.3 | 108.5 | −4.69 (0.01) | −1.74 (N.S.) | |
| 17732718 | 161.9 | 35.0 | 100.0 | −4.63 (0.00) | −1.62 (N.S.) | |
| 17670112 | 215.2 | 53.0 | 93.0 | −4.06 (0.03) | −2.31 (N.S.) | |
| 17811543 | 195.6 | 51.5 | 113.5 | −3.80 (0.01) | −1.72 (N.S.) | |
| 17842136 | 151.3 | 42.3 | 66.0 | −3.58 (0.00) | −2.29 (N.S.) | |
| 17680180 | 220.3 | 61.6 | 86.7 | −3.58 (0.00) | −2.54 (N.S.) | |
| 17635338 | 162.1 | 45.8 | 63.6 | −3.54 (0.04) | −2.55 (N.S.) | |
| 17688094 | 51.0 | 14.6 | 31.2 | −3.49 (0.01) | −1.64 (N.S.) | |
| 17721906 | 287.1 | 84.2 | 213.2 | −3.41 (0.04) | −1.35 (N.S.) | |
| 17882217 | 198.4 | 58.9 | 109.8 | −3.37 (0.02) | −1.81 (N.S.) | |
| 17875773 | 568.5 | 176.4 | 312.2 | −3.22 (0.05) | −1.82 (N.S.) | |
| 17693876 | 334.4 | 106.0 | 148.0 | −3.15 (0.01) | −2.26 (N.S.) | |
| 17721921 | 431.5 | 138.6 | 177.7 | −3.11 (0.02) | −2.43 (N.S.) | |
| 17811252 | 571.2 | 184.1 | 354.9 | −3.10 (0.01) | −1.61 (N.S.) | |
| 17764017 | 385.0 | 127.2 | 383.6 | −3.03 (0.02) | 1.00 (N.S.) | |
| 17693958 | 748.3 | 247.6 | 526.2 | −3.02 (0.04) | −1.42 (N.S.) | |
| 17811547 | 146.9 | 48.9 | 53.7 | −3.01 (0.02) | −2.74 (N.S.) | |
| 17807271 | Olr845 | 46.1 | 15.8 | 18.7 | −2.91 (0.04) | −2.46 (N.S.) |
| 17848892 | 373.8 | 132.3 | 238.2 | −2.83 (0.02) | −1.57 (N.S.) | |
| 17748627 | 948.8 | 338.6 | 920.9 | −2.80 (0.00) | −1.03 (N.S.) | |
| 17636394 | 790.3 | 282.1 | 420.3 | −2.80 (0.01) | −1.88 (N.S.) | |
| 17870521 | RGD1563150 | 62.3 | 22.4 | 28.4 | −2.78 (0.01) | −2.19 (N.S.) |
| 17798066 | 837.0 | 306.7 | 367.3 | −2.73 (0.03) | −2.28 (N.S.) | |
| 17743543 | 306.2 | 115.2 | 159.7 | −2.66 (0.00) | −1.92 (N.S.) | |
| 17656383 | LOC100362685 | 495.1 | 188.1 | 223.5 | −2.63 (0.00) | −2.22 (N.S.) |
| 17623010 | 288.1 | 109.9 | 121.5 | −2.62 (0.01) | −2.37 (N.S.) | |
| 17774856 | 483.2 | 184.8 | 250.3 | −2.61 (0.00) | −1.93 (N.S.) | |
| 17748801 | Fdps | 593.0 | 229.3 | 340.8 | −2.59 (0.03) | −1.74 (N.S.) |
| 17636391 | 354.1 | 137.8 | 206.0 | −2.57 (0.01) | −1.72 (N.S.) | |
| 17808769 | 390.4 | 152.1 | 1367.4 | −2.57 (0.02) | 3.50 (N.S.) | |
| 17780694 | 40.1 | 15.7 | 32.8 | −2.56 (0.03) | −1.22 (N.S.) | |
| 17796931 | 124.2 | 48.7 | 167.0 | −2.55 (0.03) | 1.34 (N.S.) | |
| 17636378 | 594.3 | 233.9 | 432.5 | −2.54 (0.01) | −1.37 (N.S.) | |
| 17610773 | 38.2 | 15.0 | 134.7 | −2.54 (0.01) | 3.53 (N.S.) | |
| 17811253 | 1509.6 | 598.8 | 900.0 | −2.52 (0.02) | −1.68 (N.S.) | |
| 17853807 | 1236.0 | 493.3 | 754.6 | −2.51 (0.01) | −1.64 (N.S.) | |
| 17690399 | Rab28 | 198.3 | 79.6 | 117.3 | −2.49 (0.01) | −1.69 (N.S.) |
| 17622672 | 1102.6 | 445.5 | 664.4 | −2.48 (0.03) | −1.66 (N.S.) | |
| 17636536 | Ybx1 | 693.4 | 280.8 | 357.0 | −2.47 (0.03) | −1.94 (N.S.) |
| 17789529 | Bet1 | 476.2 | 196.6 | 241.2 | −2.42 (0.04) | −1.97 (N.S.) |
| 17850299 | 598.9 | 249.0 | 470.8 | −2.41 (0.01) | −1.27 (N.S.) | |
| 17688096 | 465.7 | 195.2 | 205.7 | −2.39 (0.03) | −2.26 (N.S.) | |
| 17731750 | Mt2A | 622.1 | 260.9 | 370.8 | −2.38 (0.04) | −1.68 (N.S.) |
| 17810932 | Zcchc17 | 684.2 | 289.4 | 375.1 | −2.36 (0.00) | −1.82 (N.S.) |
| 17829401 | LOC686736 | 818.9 | 346.5 | 565.8 | −2.36 (0.01) | −1.45 (N.S.) |
| 17646083 | Mrpl22 | 290.6 | 125.6 | 203.3 | −2.31 (0.01) | −1.43 (N.S.) |
| 17678890 | 252.0 | 109.0 | 249.9 | −2.31 (0.01) | −1.01 (N.S.) | |
| 17827707 | Ccdc41 | 321.2 | 139.6 | 169.6 | −2.30 (0.03) | −1.89 (N.S.) |
| 17817435 | 125.0 | 54.4 | 78.5 | −2.30 (0.00) | −1.59 (N.S.) | |
| 17821662 | Arl4a | 273.4 | 120.7 | 145.7 | −2.26 (0.01) | −1.88 (N.S.) |
| 17826268 | 1950.3 | 867.2 | 1083.0 | −2.25 (0.02) | −1.80 (N.S.) | |
| 17854027 | Tmod2 | 583.6 | 260.1 | 358.7 | −2.24 (0.03) | −1.63 (N.S.) |
| 17836358 | Slc16a7 | 160.5 | 71.6 | 86.7 | −2.24 (0.02) | −1.85 (N.S.) |
| 17881132 | 978.6 | 439.4 | 532.7 | −2.23 (0.00) | −1.84 (N.S.) | |
| 17681323 | 258.2 | 116.6 | 205.2 | −2.21 (0.01) | −1.26 (N.S.) | |
| 17748626 | 2226.5 | 1019.9 | 1876.0 | −2.18 (0.00) | −1.19 (N.S.) | |
| 17688862 | 710.0 | 327.5 | 455.0 | −2.17 (0.01) | −1.56 (N.S.) | |
| 17731941 | Fto | 502.1 | 231.9 | 218.4 | −2.16 (0.02) | −2.30 (N.S.) |
| 17703287 | 356.4 | 167.2 | 200.6 | −2.13 (0.03) | −1.78 (N.S.) | |
| 17681409 | 472.8 | 223.6 | 254.5 | −2.11 (0.04) | −1.86 (N.S.) | |
| 17775226 | 468.1 | 221.6 | 292.7 | −2.11 (0.03) | −1.60 (N.S.) | |
| 17876611 | LOC100361854 | 1209.5 | 578.5 | 704.6 | −2.09 (0.04) | −1.72 (N.S.) |
| 17693944 | Srp72 | 503.6 | 241.6 | 281.0 | −2.08 (0.00) | −1.79 (N.S.) |
| 17724140 | Mbd2 | 456.0 | 219.2 | 272.1 | −2.08 (0.03) | −1.68 (N.S.) |
| 17811254 | 1796.3 | 864.6 | 1109.1 | −2.08 (0.00) | −1.62 (N.S.) | |
| 17838723 | 412.4 | 200.3 | 368.1 | −2.06 (0.01) | −1.12 (N.S.) | |
| 17681249 | Mrps14 | 543.8 | 265.9 | 351.0 | −2.04 (0.04) | −1.55 (N.S.) |
| 17615359 | 1622.3 | 798.1 | 973.7 | −2.03 (0.00) | −1.67 (N.S.) | |
| 17751160 | Mettl14 | 217.7 | 107.4 | 159.1 | −2.03 (0.01) | −1.37 (N.S.) |
| 17817437 | 759.6 | 377.3 | 498.1 | −2.01 (0.04) | −1.52 (N.S.) | |
| 17693945 | 694.0 | 348.4 | 357.4 | −1.99 (0.00) | −1.94 (N.S.) | |
| 17674643 | Coro1c | 1461.3 | 734.0 | 950.1 | −1.99 (0.00) | −1.54 (N.S.) |
| 17799944 | LOC100912024 | 18.0 | 9.1 | 14.0 | −1.98 (0.00) | −1.29 (N.S.) |
| 17825478 | Ptges3 | 193.8 | 98.8 | 117.0 | −1.96 (0.00) | −1.66 (N.S.) |
| 17623006 | mrpl11 | 338.1 | 173.2 | 224.3 | −1.95 (0.00) | −1.51 (N.S.) |
| 17832396 | 430.3 | 220.6 | 272.4 | −1.95 (0.00) | −1.58 (N.S.) | |
| 17866714 | Dtymk | 238.2 | 122.3 | 149.2 | −1.95 (0.00) | −1.60 (N.S.) |
| 17751301 | Ap1ar | 443.3 | 228.7 | 267.2 | −1.94 (0.01) | −1.66 (0.03) |
| 17745465 | Mrps30 | 454.0 | 236.2 | 244.0 | −1.92 (0.00) | −1.86 (N.S.) |
| 17854297 | RGD1564964 | 389.6 | 204.8 | 221.5 | −1.90 (0.02) | −1.76 (N.S.) |
| 17677593 | Tmed2 | 1032.4 | 549.6 | 660.2 | −1.88 (0.03) | −1.56 (N.S.) |
| 17742955 | H2afz | 951.3 | 509.7 | 542.6 | −1.87 (0.00) | −1.75 (N.S.) |
| 17880182 | 269.8 | 148.7 | 148.7 | −1.81 (0.02) | −1.82 (N.S.) | |
| 17741407 | 456.5 | 849.6 | 730.3 | 1.86 (0.00) | 1.60 (N.S.) | |
| 17784258 | RGD1565252 | 427.4 | 817.8 | 743.5 | 1.91 (0.00) | 1.74 (N.S.) |
| 17875772 | 892.7 | 1726.3 | 1564.8 | 1.93 (0.00) | 1.75 (N.S.) | |
| 17816550 | 354.5 | 692.6 | 527.2 | 1.95 (0.03) | 1.49 (N.S.) | |
| 17719021 | RGD1565509 | 63.4 | 126.6 | 141.1 | 2.00 (0.04) | 2.23 (N.S.) |
| 17870184 | 464.1 | 935.1 | 875.8 | 2.02 (0.03) | 1.89 (N.S.) | |
| 17832361 | 590.2 | 1189.6 | 973.8 | 2.02 (0.01) | 1.65 (N.S.) | |
| 17881239 | 97.7 | 197.5 | 96.3 | 2.02 (0.00) | −1.01 (N.S.) | |
| 17758222 | 29.6 | 59.8 | 40.6 | 2.02 (0.03) | 1.37 (N.S.) | |
| 17772379 | 364.1 | 746.9 | 590.5 | 2.05 (0.03) | 1.62 (N.S.) | |
| 17818435 | 32.2 | 70.2 | 65.6 | 2.18 (0.01) | 2.04 (N.S.) | |
| 17627324 | LOC100361672 | 46.7 | 104.0 | 79.7 | 2.23 (0.00) | 1.70 (N.S.) |
| 17687349 | 207.4 | 463.1 | 338.8 | 2.23 (0.02) | 1.63 (N.S.) | |
| 17619189 | Olr168 | 334.7 | 750.8 | 855.6 | 2.24 (0.04) | 2.56 (N.S.) |
| 17740501 | 1043.6 | 2422.9 | 2008.6 | 2.32 (0.01) | 1.92 (N.S.) | |
| 17828539 | 23.3 | 59.2 | 108.6 | 2.54 (0.04) | 4.67 (N.S.) | |
| 17670639 | 132.9 | 351.5 | 222.2 | 2.65 (0.01) | 1.67 (N.S.) | |
| 17702361 | 50.0 | 136.0 | 89.5 | 2.72 (0.04) | 1.79 (N.S.) | |
| 17656469 | 161.8 | 449.5 | 366.5 | 2.78 (0.04) | 2.27 (N.S.) | |
| 17747984 | 117.3 | 338.5 | 332.1 | 2.88 (0.05) | 2.83 (N.S.) | |
| 17744450 | 134.4 | 418.8 | 500.9 | 3.12 (0.03) | 3.73 (N.S.) | |
| 17723299 | 91.2 | 304.0 | 328.7 | 3.33 (0.02) | 3.60 (N.S.) | |
| 17848558 | 736.4 | 2837.7 | 2719.6 | 3.85 (0.01) | 3.69 (N.S.) | |
| 17807894 | 34.0 | 131.1 | 73.7 | 3.85 (0.04) | 2.17 (N.S.) | |
| 17851136 | Olr1194 | 55.0 | 297.6 | 201.6 | 5.41 (0.02) | 3.67 (N.S.) |
| 17671811 | 293.4 | 49.5 | 100.3 | −5.92 (0.01) | −2.92 (0.03) | |
| 17811553 | 636.0 | 162.2 | 188.5 | −3.92 (0.01) | −3.37 (0.02) | |
| 17824961 | 59.2 | 19.6 | 10.8 | −3.02 (0.03) | −5.47 (0.02) | |
| 17828799 | 145.6 | 52.4 | 52.2 | −2.78 (0.01) | −2.79 (0.01) | |
| 17811550 | 1575.1 | 573.3 | 616.0 | −2.75 (0.00) | −2.56 (0.01) | |
| 17688101 | 453.1 | 183.4 | 137.6 | −2.47 (0.01) | −3.29 (0.02) | |
| 17688897 | 464.0 | 217.1 | 191.7 | −2.14 (0.00) | −2.42 (0.00) | |
| 17809654 | 427.7 | 213.4 | 179.6 | −2.00 (0.03) | −2.38 (0.02) | |
| 17699513 | 46.1 | 122.8 | 210.2 | 2.66 (0.00) | 4.56 (0.04) | |
| 17853199 | 31.4 | 132.8 | 107.6 | 4.23 (0.04) | 3.42 (0.01) | |
| 17614769 | 64.4 | 27.5 | 20.9 | −2.34 (N.S.) | −3.09 (0.04) | |
| 17774882 | RGD1309730 | 274.5 | 151.6 | 88.0 | −1.81 (N.S.) | −3.12 (0.04) |
| 17688866 | 493.5 | 274.0 | 213.4 | −1.80 (N.S.) | −2.31 (0.02) | |
| 17870626 | RGD1564541 | 138.6 | 87.9 | 66.2 | −1.58 (0.04) | −2.09 (0.01) |
| 17822955 | 51.5 | 68.1 | 116.7 | 1.32 (N.S.) | 2.27 (0.00) | |
| 17681711 | 42.1 | 56.4 | 108.2 | 1.34 (N.S.) | 2.57 (0.02) | |
| 17796151 | 159.5 | 218.6 | 373.7 | 1.37 (N.S.) | 2.34 (0.00) | |
| 17720627 | 52.8 | 80.6 | 114.1 | 1.53 (N.S.) | 2.16 (0.01) | |
| 17724855 | 14.1 | 25.5 | 46.5 | 1.81 (N.S.) | 3.30 (0.00) | |
| 17633331 | 57.3 | 152.2 | 149.7 | 2.65 (N.S.) | 2.61 (0.01) | |
| 17820101 | 22.4 | 61.9 | 172.2 | 2.77 (N.S.) | 7.70 (0.02) | |
| 17633551 | 40.1 | 114.2 | 81.2 | 2.85 (N.S.) | 2.03 (0.01) | |
| 17831284 | 19.4 | 97.2 | 49.4 | 5.01 (N.S.) | 2.54 (0.00) |
Genes regulated by wild-type Set-β and myr-Set-β expression. The fold-change and the p value (shown in parentheses next to the fold-change) for genes with ≥1.75 fold-change at p < 0.05 are in bold type. N.S., Not significant.
We next asked whether we could detect cytoplasmic or nuclear binding partners of Set-β in primary CNS neurons. We purified hippocampal neurons and coimmunoprecipitated protein complexes with anti-Set-β antibody after cytoplasmic and nuclear fractionation, which were first validated using typical markers (Fig. 6A). Mass spectrometry revealed the regulatory subunit PPP2R2D of Set-β's interaction partner PP2A (Li et al., 1996) in the cytoplasmic fraction; with limited recovery of nuclear protein, only importin-α6 was reliably identified in the nuclear fraction (Table 2), consistent with importin-α being previously shown to translocate Set-β into the nucleus (Qu et al., 2007). Thus, no Set-β protein-binding partner was detected in both the cytoplasmic and nuclear fraction, although because detection is limited in such experiments, there may be binding partners common to nuclear and cytoplasmic Set-β not found here. It was interesting to note that Set-β is an inhibitor of PP2A (Li et al., 1996; Saito et al., 1999; Neviani et al., 2005), which also localizes to cellular membranes (Vasudevan et al., 2011; Le Guelte et al., 2012), so we hypothesized that PP2A may inhibit axon growth. In postnatal RGCs, the most highly expressed PP2A subunit transcript is the PP2A-A scaffold subunit PPP2R1A (Table 3; PP2A subunits loci RNA-seq reads raw data are available upon request). By immunostaining, PP2A-A was localized mostly in the cytoplasm and by cellular membranes (Fig. 6B), and coimmunoprecipitated with Set-β from CNS homogenates (Fig. 6C). We found PP2A-A expression in postnatal RGCs suppressed neurite growth by >50% (N = 3; ≥30 neurons per experiment, p < 0.01 by ANOVA, post hoc LSD; Fig. 6D, representative images). The number of neurites per cell did not change significantly; the number of branches per neurite was 16.6% less than in control (p < 0.05 ANOVA, post hoc LSD) consistent with PP2A-A's strong overall suppressive effect on neurite growth. These data suggest a model in which endogenous or exogenous Set-β recruitment to cellular membranes may promote axon growth through locally inhibiting PP2A.
Figure 6.

Set-β interacts with axon growth-suppressing PP2A-A. A, Acutely purified E18 hippocampal neurons' nuclear (N) and cytoplasmic (C) fractions confirm successful separation when immunoblotted for GAPDH (cytoplasmic marker) and histone H3 (nuclear marker; BH, brain homogenate). B, P4 RGCs immunostained at 1 d for endogenous PP2A-A (red) and Set-β (green). Nucleus outlined with dashed white line. Side panel shows Z plane with blue and orange lines indicating x-y plane shown in the middle, demonstrating PP2A-A localization at the membrane and neurites. Scale bar, 20 μm. C, Proteins from E18 hippocampal homogenates coimmunoprecipitated using anti-Set-β antibody or IgG control as marked, immunoblotted for PP2A-A or Set-β as marked. Set-β and PP2A-A immunoprecipitated with anti-Set-β antibody but not with IgG control. D, P4 RGCs transfected with mCherry or DsRed-PP2A-A, were immunostained at 3 d for Tuj1 (neurite marker, green), transfection reporter (red), MAP2 (dendrite marker, data not shown), and counterstained with DAPI (nuclear marker, blue). Nucleus outlined with dashed white line. PP2A-A localized predominantly to the cytoplasm and cellular membranes. Scale bars: 100 μm; insets, 10 μm.
Table 2.
Set-β binding partners identified with MS after co-IP from primary hippocampal neurons
| FDR | Identified proteins | Accession |
|---|---|---|
| Cytoplsmic fraction | ||
| 1.3 | rCG28086, isoform CRA_b | gi:149065001 |
| 1.3 | SLC25A5 | gi 32189350 |
| 1.3 | NUDT21 | gi 13386106 |
| 1.3 | PPP2R2D | gi 148747146 |
| 1.3 | Tubulin T beta15 | gi 224839 |
| 1.3 | CaBP1 | gi 488838 |
| 1.3 | YWHAZ | gi 1051270 |
| Neuclear fraction | ||
| 2.4 | Importin α-6 | gi 68341941 |
Peptides available on request.
Table 3.
PP2A subunits ranked by relative expression levels in purified P5 mouse RGCs
| Gene | NE |
|---|---|
| PPP2R1A | 2.16 |
| PPP2CA | 1.73 |
| PPP2CB | 0.9 |
| PPP2R2C | 0.62 |
| PPP2R5B | 0.61 |
| PPP2R2B | 0.57 |
| PPP2R2D | 0.44 |
| PPP2R4 | 0.41 |
| PPP2R5D | 0.32 |
| PPP2R2A | 0.31 |
| PPP2R5C | 0.29 |
| PPP2R5E | 0.22 |
| PPP2R3C | 0.18 |
| PPP2R1B | 0.12 |
| PPP2R3A | 0.1 |
| PPP2R5A | 0.01 |
PP2A subunits loci RNA-seq reads raw data is available upon request. Normalized expression (NE) values were determined based on the total number of nucleotides from all the reads which uniquely mapped to a transcript, normalized to both the length of a transcript and the total number of nucleotides of all uniquely mapped reads (Genomatix;www.genomatix.de).
To investigate how axon injury affects Set-β expression, we coimmunostained adult rat retinal sections for Set-β and the RGC marker Brn3A 5 d after optic nerve injury. We found that, consistent with the literature (Buckingham et al., 2008), Brn3A immunofluorescence intensity decreased by ∼50%, whereas nuclear Set-β signal stayed at a similar level (Fig. 7A,B). However, cytoplasmic Set-β signal decreased ∼8% after injury (Fig. 7A,B). Although this was not a large decrease, it was statistically significant and is consistent with a model in which regenerative failure after optic nerve injury is associated with an absence of increased Set-β localization to cellular membranes and the cytoplasm (which occurs in AD; Tanimukai et al., 2005), where Set-β could promote axon growth. Together, these data demonstrate that optic nerve injury does not reduce nuclear but slightly reduces cytoplasmic/membrane expression of Set-β in RGCs.
Finally, we tested whether recruiting Set-β to cellular membranes could promote axon regeneration in vivo, using a well established axon regeneration model of optic nerve crush (Park et al., 2008; Moore et al., 2009; Sun et al., 2011). We used AAV2 to express in RGCs myr-Set-β or GFP, which is known not to affect optic nerve regeneration and is commonly used as a control (Park et al., 2008; Sun et al., 2011). After optic nerve injury in adult rats, cholera toxin subunit B (CTB) anterograde label was injected intravitreally 2 d before kill (Fig. 7C). We did not find a statistically significant difference in RGC survival 2 weeks after injury between eGFP- and myr-Set-β-treated animals, with averages of 18.5 and 19.5 RGCs/mm2 per retina, respectively (N ≥ 2, p = 0.83, t test, two-tailed). Myr-Set-β significantly increased axon regeneration at 2 and 3 weeks after injury (Fig. 7D–F). The increase in the distance of regenerating fibers from 2–3 weeks supported the conclusion that this was regenerative axon growth. No spared or growing axons were detected beyond 1.5 or 2.75 mm from the lesion site in the eGFP-treated Group 2 or 3 weeks after injury, respectively, demonstrating that the crush was sufficient to disrupt all the axons, and that there was no axon sparing. In myr-Set-β-treated animals, in contrast, regenerating fibers grew linearly up to 3.5 mm along the optic nerve by 3 weeks after injury, a distance generally not seen in sprouting, and did not demonstrate any branching, although we did not analyze branching or sprouting of the short neurites growing proximal to the injury site. Together, these data demonstrates that myr-Set-β promotes regeneration of axons in vivo.
Discussion
Switching proteins between active and inactive states or activating them through shuttling between cellular compartments, such as occurs with release of NFkB from IkB (Baeuerle and Baltimore, 1988), phosphorylation of map kinases (Khokhlatchev et al., 1998), and cleavage of notch receptors (Kopan and Ilagan, 2009), are well established biological mechanisms for regulating their function. Unrelated cellular compartment-specific activities of the same protein also have been described, such as cytochrome C participating in the electron transport chain in mitochondria (Margoliash et al., 1973) but signaling apoptosis in the cytoplasm (Kluck et al., 1997); p21/WAF1 regulating cell cycle though nuclear activity and neurite growth through cytoplasmic activity (Tanaka et al., 2002, 2004); Eya functioning as a transcriptional coactivator in the nucleus and as phosphatase in the cytoplasm (Xiong et al., 2009); and SRF acting as a transcription factor in the nucleus but stimulating axon regeneration through cytoplasmic localization (Stern et al., 2013). Here, however, we found that Set-β elicits opposing effects on the same cellular behavior, neurite growth, through disparate activities in different cellular compartments (Fig. 8).
Figure 8.

Model for regulation of Set-β and its effects on axon growth and regeneration. Set-β's subcellular localization and function are regulated by a NLS and by phosphorylation (P), which delays nuclear import and prevents Set-β's inhibition of axon growth. In the nucleus, Set-β regulates transcription and suppresses axon growth; Set-β lacking the NLS does not meaningfully affect neurite growth; but Set-β recruited to cellular membranes promotes neurite growth and axon regeneration, possibly through local inhibition of axon growth-suppressing PP2A-A (?). The specific mechanism of endogenous Set-β recruitment to cellular membrane and its physiological function(s) there remain to be identified (?).
Set-β localized to cytoplasmic membranes promoted optic nerve axon regeneration in vivo, an important finding when considering both the potential role for endogenous Set-β at the membrane, and the potential therapeutic relevance of directing exogenous Set-β to that specific compartment. The distance (3.5 mm) reached by regenerating axons beyond the injury site at 3 weeks after injury is significant, although the low numbers of regenerating axons in these experiments could be explained by a combination of only a small number of RGCs surviving that long after injury and limited transduction efficiency of myr-Set-β gene delivery. In contrast, full-length Set-β did not meaningfully decrease survival in vitro, and myr-Set-β-transduced retinas did not show obvious increases in RGC survival after optic nerve injury in vivo. These data suggest that the constructs' effects were specific to neurite and axon growth regulation and not a nonspecific effect on neuronal health, and motivate future investigation of myr-Set-β gene therapy combined with survival-promoting factors such as neurotrophic factors (Sun et al., 2011). Evaluation of relative potency of myr-Set-β's effect on axon regeneration compared with other axon regeneration-promoting factors is limited by differences in species (mice versus rats) and techniques between investigators (e.g., the extent of extra-axonal damage in the optic nerve). It thus would be important for future studies to directly compare myr-Set-β gene therapy and other axon regeneration-promoting treatments such as PTEN, SOCS3, or KLF4 deletion, or intravitreal injection of zymosan and CPT-cAMP (Moore et al., 2009; Sun et al., 2011; de Lima et al., 2012b), as well as to investigate possible synergistic effects by combining such treatments (de Lima et al., 2012a). In addition, given the developmental change we found in Set-β's expression, future studies may also address whether Set-β influences other physiological developmental changes in RGCs, such as dendritic arborization (Bodnarenko et al., 1995) and axonal guidance (Petros et al., 2008).
How does phosphorylation modulate Set-β's neuronal function? Set-β's S9 phosphorylation has been well described in multiple tissues (Adachi et al., 1994), and S9 phosphorylation increases Set-β's cytoplasmic localization in HeLa cells (ten Klooster et al., 2007). Set-β phosphorylation at multiple sites is decreased as human embryonic stem-cells progress toward neural linage and differentiate into human neural stem-cells (Singec et al., unpublished observations), suggesting that Set-β phosphorylation may be associated with neural development. Here we uncovered the importance of Set-β S9 phosphorylation in primary CNS neurons: S9 phosphorylation delays, but does not fully prevent, Set-β's nuclear import, and blocks the ability of nuclear Set-β to suppress neurite growth. Thus, S9 phosphorylation provides a potential pharmacological target for treating neurodegeneration and CNS injury. Further characterization and functional investigation of Set-β posttranslational modifications across Set-β variants and in different biological contexts will be important.
How might endogenous Set-β be recruited to cellular membranes? Set-β can be recruited to the intracellular domain of a transmembrane protein NF-protocadherin in Xenopus (Piper et al., 2008). Although it is unknown whether protocadherin 7, a mammalian homolog of NF-protocadherin, interacts with Set-β, Set-β has been shown to regulate VE-cadherin in mammalian cells (Le Guelte et al., 2012). Set-β is also recruited to the G-protein-coupled β-adrenergic receptor complex (Vasudevan et al., 2011). Our bioinformatics analysis did not suggest a mechanism for direct recruitment through transmembrane insertion or lipid modification. Future biochemical studies will be needed to address this question.
Identification of Set-β effectors, although not a major focus of the current study, may reveal additional understanding of the biology of axon growth and additional targets to promote regeneration. Toward this goal, we found that Set-β interacts with PP2A-A in the cytoplasmic fraction in neurons, and that PP2A-A suppresses neurite growth. Set-β is a well described inhibitor of PP2A (Saito et al., 1999; Neviani et al., 2005), including at cellular membranes (Christensen et al., 2011; Vasudevan et al., 2011; Le Guelte et al., 2012), consistent with our data and model that the increased axon growth after myr-Set-β expression could be through local inhibition of PP2A-A at cellular membranes (Fig. 8), which would need to be further validated in future studies, for example, by using conditional PP2A subunits knock-out mice to determine whether Set-β found at cellular membranes promotes axon growth through PP2A interaction. In contrast to our data, previous experiments have found that the catalytic PP2A-C subunit increases neurite growth in vitro (Zhu et al., 2010). This may reflect the dominance of the scaffold subunit's suppressive effect, as PP2A-A is expressed at much higher levels according to our RNA-seq data (Table 3), or may suggest that PP2A effects vary in different types of neurons. It may be interesting to investigate whether PP2A modulates the phosphorylation of STAT3 or mTOR and their effects on axon growth similarly to other phosphatases, such as PTEN (Sun et al., 2011).
In the nucleus, where Set-β decreases neurite growth, Set-β can regulate transcription factors' access to chromatin (Matsumoto et al., 1993; Okuwaki and Nagata, 1998; Gamble et al., 2005; Gamble and Fisher, 2007), mask acetylation of histone tails and inhibit acetyltransferases (Seo et al., 2001; Loven et al., 2003; Suzuki et al., 2003; Macfarlan et al., 2006), recruit histone deacetylase complexes (Wagner et al., 2006), and lead to alterations in histone tails (Wagner et al., 2006) and DNA methylation (Cervoni et al., 2002), thereby epigenetically regulating transcription (Cervoni et al., 2002; De Koning et al., 2007; Trakhtenberg and Goldberg, 2012). Set-β can also interact with transcription factors directly (Ichijo et al., 2008), for example, with KLFs (Miyamoto et al., 2003) and p53 (Kim et al., 2012), which regulate axon growth and regeneration in CNS (Moore et al., 2009, 2011; Blackmore et al., 2012; Quadrato and Di Giovanni, 2012). Our demonstration of Set-β's expression regulating transcription of multiple genes, in contrast to the significantly fewer genes being regulated by myr-Set-β, is consistent with Set-β's canonical role as transcriptional regulator. Testing specific candidate genes we identified (Table 1) in a search for nuclear Set-β effectors would be important for future studies.
Together, our findings in RGCs and hippocampal neurons suggest that depending on its phosphorylation and localization, Set-β may suppress or promote neurite growth and axon regeneration. Both nuclear gene targets and cytoplasmic protein targets will have to be studied in greater detail to parse out molecular mechanisms of Set-β function in vivo during development or after axon injury, or in neurodegenerative diseases. Along with our finding that injury, which is associated with the failure of axon regeneration, did not affect nuclear Set-β localization in RGCs but rather mildly decreased the cytoplasmic signal, these data also suggest that Set-β translocation from the nucleus to the cytoplasm in Alzheimer's disease may actually reflect a neuroregenerative response (Tanimukai et al., 2005). Myr-Set-β gene therapy may be clinically relevant for treating Alzheimer's disease and other CNS degenerations or trauma; future investigation in appropriate animal models will be important.
Footnotes
This work was supported by the NEI (EY020913 to J.L.G., P30-EY022589 to Shiley Eye Center UCSD, and P30 EY014801 to University of Miami), AHA (11PRE7310069, to E.F.T.), NINDS (T32NS007492, to E.F.T.), the Walter G. Ross Distinguished Chair in Ophthalmic Research (J.L.G.), an unrestricted grant to the University of Miami from Research to Prevent Blindness, the Lois Pope LIFE Fellowship and Research Awards (E.F.T.) and Summer Research Scholarship (S.G.F., A.L.), the CAS Summer Research Program for Underrepresented Minorities and Women (S.G.F.), and an HHMI Summer Scholars Fellowship (J.M.S.). We thank Dianbo Qu (University of Ottawa) for Xpress-Set-β and GFP-ΔNLS-Set-β constructs, Peter Hordijk (University of Amsterdam) for HA-myr-Set-β and myc-S9E-Set-β constructs, Michael Kapiloff (University of Miami) for DsRed-PP2A-A, and Suzanne Specht (NCI-Frederick) for Set-β antibody. We also thank Oliver Umland for flow cytometry, Eleut Hernandez for animal husbandry, George McNamara and Gabe Gaidosh for advanced imaging, Yan Shi for high content imaging, Pingping Jia for viral packaging, William Feuer for biostatistics, Daniel Pita-Thomas, William Hulme, Ryan Gentry, and the Center for Genome Technology for next generation sequencing (NGS), Genomatix Software for NGS analysis, Toumy Guettouche and Luis Espinoza and the Oncogenomics core for microarray processing, Arthur Moseley (Duke University) for proteomics, and Nick Tsinoremas, Lei Cao, Dmitri Velmeshev, Morton Terrell, Han Gao, Noy Ashkenazy, Kapil Gupta, James Farmer, Matthew Feldman, Darcie Moore, Kristina Russano, and Noelia Kunzevitzky for technical assistance and advice.
The authors declare no competing financial interests.
References
- Adachi Y, Pavlakis GN, Copeland TD. Identification and characterization of SET, a nuclear phosphoprotein encoded by the translocation break point in acute undifferentiated leukemia. J Biol Chem. 1994;269:2258–2262. [PubMed] [Google Scholar]
- Baeuerle PA, Baltimore D. I kappa B: a specific inhibitor of the NF-kappa B transcription factor. Science. 1988;242:540–546. doi: 10.1126/science.3140380. [DOI] [PubMed] [Google Scholar]
- Blackmore M, Letourneau PC. Changes within maturing neurons limit axonal regeneration in the developing spinal cord. J Neurobiol. 2006;66:348–360. doi: 10.1002/neu.20224. [DOI] [PubMed] [Google Scholar]
- Blackmore MG, Wang Z, Lerch JK, Motti D, Zhang YP, Shields CB, Lee JK, Goldberg JL, Lemmon VP, Bixby JL. Krüppel-like factor 7 engineered for transcriptional activation promotes axon regeneration in the adult corticospinal tract. Proc Natl Acad Sci U S A. 2012;109:7517–7522. doi: 10.1073/pnas.1120684109. [DOI] [PMC free article] [PubMed] [Google Scholar]
- Bodnarenko SR, Jeyarasasingam G, Chalupa LM. Development and regulation of dendritic stratification in retinal ganglion cells by glutamate-mediated afferent activity. J Neurosci. 1995;15:7037–7045. doi: 10.1523/JNEUROSCI.15-11-07037.1995. [DOI] [PMC free article] [PubMed] [Google Scholar]
- Bologna G, Yvon C, Duvaud S, Veuthey AL. N-terminal myristoylation predictions by ensembles of neural networks. Proteomics. 2004;4:1626–1632. doi: 10.1002/pmic.200300783. [DOI] [PubMed] [Google Scholar]
- Buckingham BP, Inman DM, Lambert W, Oglesby E, Calkins DJ, Steele MR, Vetter ML, Marsh-Armstrong N, Horner PJ. Progressive ganglion cell degeneration precedes neuronal loss in a mouse model of glaucoma. J Neurosci. 2008;28:2735–2744. doi: 10.1523/JNEUROSCI.4443-07.2008. [DOI] [PMC free article] [PubMed] [Google Scholar]
- Carmona-Mora P, Canales CP, Cao L, Perez IC, Srivastava AK, Young JI, Walz K. RAI1 transcription factor activity is impaired in mutants associated with Smith-Magenis syndrome. PLoS One. 2012;7:e45155. doi: 10.1371/journal.pone.0045155. [DOI] [PMC free article] [PubMed] [Google Scholar]
- Cervoni N, Detich N, Seo SB, Chakravarti D, Szyf M. The oncoprotein Set/TAF-1beta, an inhibitor of histone acetyltransferase, inhibits active demethylation of DNA, integrating DNA methylation and transcriptional silencing. J Biol Chem. 2002;277:25026–25031. doi: 10.1074/jbc.M202256200. [DOI] [PubMed] [Google Scholar]
- Christensen DJ, Ohkubo N, Oddo J, Van Kanegan MJ, Neil J, Li F, Colton CA, Vitek MP. Apolipoprotein E and peptide mimetics modulate inflammation by binding the SET protein and activating protein phosphatase 2A. J Immunol. 2011;186:2535–2542. doi: 10.4049/jimmunol.1002847. [DOI] [PubMed] [Google Scholar]
- Corredor RG, Trakhtenberg EF, Pita-Thomas W, Jin X, Hu Y, Goldberg JL. Soluble adenylyl cyclase activity is necessary for retinal ganglion cell survival and axon growth. J Neurosci. 2012;32:7734–7744. doi: 10.1523/JNEUROSCI.5288-11.2012. [DOI] [PMC free article] [PubMed] [Google Scholar]
- De Koning L, Corpet A, Haber JE, Almouzni G. Histone chaperones: an escort network regulating histone traffic. Nat Struct Mol Biol. 2007;14:997–1007. doi: 10.1038/nsmb1318. [DOI] [PubMed] [Google Scholar]
- de Lima S, Habboub G, Benowitz LI. Combinatorial therapy stimulates long-distance regeneration, target reinnervation, and partial recovery of vision after optic nerve injury in mice. Int Rev Neurobiol. 2012a;106:153–172. doi: 10.1016/B978-0-12-407178-0.00007-7. [DOI] [PubMed] [Google Scholar]
- de Lima S, Koriyama Y, Kurimoto T, Oliveira JT, Yin Y, Li Y, Gilbert HY, Fagiolini M, Martinez AM, Benowitz L. Full-length axon regeneration in the adult mouse optic nerve and partial recovery of simple visual behaviors. Proc Natl Acad Sci U S A. 2012b;109:9149–9154. doi: 10.1073/pnas.1119449109. [DOI] [PMC free article] [PubMed] [Google Scholar]
- Fankhauser N, Mäser P. Identification of GPI anchor attachment signals by a Kohonen self-organizing map. Bioinformatics. 2005;21:1846–1852. doi: 10.1093/bioinformatics/bti299. [DOI] [PubMed] [Google Scholar]
- Gamble MJ, Fisher RP. SET and PARP1 remove DEK from chromatin to permit access by the transcription machinery. Nat Struct Mol Biol. 2007;14:548–555. doi: 10.1038/nsmb1248. [DOI] [PubMed] [Google Scholar]
- Gamble MJ, Erdjument-Bromage H, Tempst P, Freedman LP, Fisher RP. The histone chaperone TAF-I/SET/INHAT is required for transcription in vitro of chromatin templates. Mol Cell Biol. 2005;25:797–807. doi: 10.1128/MCB.25.2.797-807.2005. [DOI] [PMC free article] [PubMed] [Google Scholar]
- Gaub P, Joshi Y, Wuttke A, Naumann U, Schnichels S, Heiduschka P, Di Giovanni S. The histone acetyltransferase p300 promotes intrinsic axonal regeneration. Brain. 2011;134:2134–2148. doi: 10.1093/brain/awr142. [DOI] [PubMed] [Google Scholar]
- Goldberg JL, Trakhtenberg EF. Axon growth and regeneration: part I. Int Rev Neurobiol. 2012;105:xi–xiii. doi: 10.1016/B978-0-12-398309-1.09986-8. [DOI] [PubMed] [Google Scholar]
- Goldberg JL, Klassen MP, Hua Y, Barres BA. Amacrine-signaled loss of intrinsic axon growth ability by retinal ganglion cells. Science. 2002;296:1860–1864. doi: 10.1126/science.1068428. [DOI] [PubMed] [Google Scholar]
- Harvey AR, Ooi JW, Rodger J. Neurotrophic factors and the regeneration of adult retinal ganglion cell axons. Int Rev Neurobiol. 2012;106:1–33. doi: 10.1016/B978-0-12-407178-0.00002-8. [DOI] [PubMed] [Google Scholar]
- Hu Y, Cho S, Goldberg JL. Neurotrophic effect of a novel TrkB agonist on retinal ganglion cells. Invest Ophthalmol Vis Sci. 2010;51:1747–1754. doi: 10.1167/iovs.09-4450. [DOI] [PMC free article] [PubMed] [Google Scholar]
- Ichijo T, Chrousos GP, Kino T. Activated glucocorticoid receptor interacts with the INHAT component set/TAF-ibeta and releases it from a glucocorticoid-responsive gene promoter, relieving repression: implications for the pathogenesis of glucocorticoid resistance in acute undifferentiated leukemia with set-can translocation. Mol Cell Endocrinol. 2008;283:19–31. doi: 10.1016/j.mce.2007.10.014. [DOI] [PMC free article] [PubMed] [Google Scholar]
- Kaech S, Banker G. Culturing hippocampal neurons. Nat Protoc. 2006;1:2406–2415. doi: 10.1038/nprot.2006.356. [DOI] [PubMed] [Google Scholar]
- Khokhlatchev AV, Canagarajah B, Wilsbacher J, Robinson M, Atkinson M, Goldsmith E, Cobb MH. Phosphorylation of the MAP kinase ERK2 promotes its homodimerization and nuclear translocation. Cell. 1998;93:605–615. doi: 10.1016/S0092-8674(00)81189-7. [DOI] [PubMed] [Google Scholar]
- Kim JY, Lee KS, Seol JE, Yu K, Chakravarti D, Seo SB. Inhibition of p53 acetylation by INHAT subunit SET/TAF-Iβ represses p53 activity. Nucleic Acids Res. 2012;40:75–87. doi: 10.1093/nar/gkr614. [DOI] [PMC free article] [PubMed] [Google Scholar]
- Kluck RM, Bossy-Wetzel E, Green DR, Newmeyer DD. The release of cytochrome c from mitochondria: a primary site for Bcl-2 regulation of apoptosis. Science. 1997;275:1132–1136. doi: 10.1126/science.275.5303.1132. [DOI] [PubMed] [Google Scholar]
- Kopan R, Ilagan MX. The canonical Notch signaling pathway: unfolding the activation mechanism. Cell. 2009;137:216–233. doi: 10.1016/j.cell.2009.03.045. [DOI] [PMC free article] [PubMed] [Google Scholar]
- Kunzevitzky NJ, Almeida MV, Goldberg JL. Amacrine cell gene expression and survival signaling: differences from neighboring retinal ganglion cells. Invest Ophthalmol Vis Sci. 2010;51:3800–3812. doi: 10.1167/iovs.09-4540. [DOI] [PMC free article] [PubMed] [Google Scholar]
- Lam BD, Anthony EC, Hordijk PL. Cytoplasmic targeting of the proto-oncogene SET promotes cell spreading and migration. FEBS Lett. 2013;587:111–119. doi: 10.1016/j.febslet.2012.11.013. [DOI] [PubMed] [Google Scholar]
- Le Guelte A, Galan-Moya EM, Dwyer J, Treps L, Kettler G, Hebda JK, Dubois S, Auffray C, Chneiweiss H, Bidere N, Gavard J. Semaphorin 3A elevates endothelial cell permeability through PP2A inactivation. J Cell Sci. 2012;125:4137–4146. doi: 10.1242/jcs.108282. [DOI] [PubMed] [Google Scholar]
- Li M, Makkinje A, Damuni Z. The myeloid leukemia-associated protein SET is a potent inhibitor of protein phosphatase 2A. J Biol Chem. 1996;271:11059–11062. doi: 10.1074/jbc.271.19.11059. [DOI] [PubMed] [Google Scholar]
- Loven MA, Muster N, Yates JR, Nardulli AM. A novel estrogen receptor alpha-associated protein, template-activating factor Ibeta, inhibits acetylation and transactivation. Mol Endocrinol. 2003;17:67–78. doi: 10.1210/me.2002-0280. [DOI] [PubMed] [Google Scholar]
- Macfarlan T, Parker JB, Nagata K, Chakravarti D. Thanatos-associated protein 7 associates with template activating factor-Ibeta and inhibits histone acetylation to repress transcription. Mol Endocrinol. 2006;20:335–347. doi: 10.1210/me.2005-0248. [DOI] [PubMed] [Google Scholar]
- Margoliash E, Ferguson-Miller S, Tulloss J, Kang CH, Feinberg BA, Brautigan DL, Morrison M. Separate intramolecular pathways for reduction and oxidation of cytochrome c in electron transport chain reactions. Proc Natl Acad Sci U S A. 1973;70:3245–3249. doi: 10.1073/pnas.70.11.3245. [DOI] [PMC free article] [PubMed] [Google Scholar]
- Matsumoto K, Nagata K, Ui M, Hanaoka F. Template activating factor I, a novel host factor required to stimulate the adenovirus core DNA replication. J Biol Chem. 1993;268:10582–10587. [PubMed] [Google Scholar]
- Maurer-Stroh S, Eisenhaber F. Refinement and prediction of protein prenylation motifs. Genome Biol. 2005;6:R55. doi: 10.1186/gb-2005-6-6-r55. [DOI] [PMC free article] [PubMed] [Google Scholar]
- Meyer-Franke A, Kaplan MR, Pfrieger FW, Barres BA. Characterization of the signaling interactions that promote the survival and growth of developing retinal ganglion cells in culture. Neuron. 1995;15:805–819. doi: 10.1016/0896-6273(95)90172-8. [DOI] [PubMed] [Google Scholar]
- Miyamoto S, Suzuki T, Muto S, Aizawa K, Kimura A, Mizuno Y, Nagino T, Imai Y, Adachi N, Horikoshi M, Nagai R. Positive and negative regulation of the cardiovascular transcription factor KLF5 by p300 and the oncogenic regulator SET through interaction and acetylation on the DNA-binding domain. Mol Cell Biol. 2003;23:8528–8541. doi: 10.1128/MCB.23.23.8528-8541.2003. [DOI] [PMC free article] [PubMed] [Google Scholar]
- Moore DL, Blackmore MG, Hu Y, Kaestner KH, Bixby JL, Lemmon VP, Goldberg JL. KLF family members regulate intrinsic axon regeneration ability. Science. 2009;326:298–301. doi: 10.1126/science.1175737. [DOI] [PMC free article] [PubMed] [Google Scholar]
- Moore DL, Apara A, Goldberg JL. Kruppel-like transcription factors in the nervous system: novel players in neurite outgrowth and axon regeneration. Mol Cell Neurosci. 2011;47:233–243. doi: 10.1016/j.mcn.2011.05.005. [DOI] [PMC free article] [PubMed] [Google Scholar]
- Nadal-Nicolás FM, Jiménez-López M, Sobrado-Calvo P, Nieto-López L, Cánovas-Martínez I, Salinas-Navarro M, Vidal-Sanz M, Agudo M. Brn3a as a marker of retinal ganglion cells: qualitative and quantitative time course studies in naive and optic nerve-injured retinas. Invest Ophthalmol Vis Sci. 2009;50:3860–3868. doi: 10.1167/iovs.08-3267. [DOI] [PubMed] [Google Scholar]
- Nagata K, Kawase H, Handa H, Yano K, Yamasaki M, Ishimi Y, Okuda A, Kikuchi A, Matsumoto K. Replication factor encoded by a putative oncogene, set, associated with myeloid leukemogenesis. Proc Natl Acad Sci U S A. 1995;92:4279–4283. doi: 10.1073/pnas.92.10.4279. [DOI] [PMC free article] [PubMed] [Google Scholar]
- Nagata K, Saito S, Okuwaki M, Kawase H, Furuya A, Kusano A, Hanai N, Okuda A, Kikuchi A. Cellular localization and expression of template-activating factor I in different cell types. Exp Cell Res. 1998;240:274–281. doi: 10.1006/excr.1997.3930. [DOI] [PubMed] [Google Scholar]
- Neviani P, Santhanam R, Trotta R, Notari M, Blaser BW, Liu S, Mao H, Chang JS, Galietta A, Uttam A, Roy DC, Valtieri M, Bruner-Klisovic R, Caligiuri MA, Bloomfield CD, Marcucci G, Perrotti D. The tumor suppressor PP2A is functionally inactivated in blast crisis CML through the inhibitory activity of the BCR/ABL-regulated SET protein. Cancer Cell. 2005;8:355–368. doi: 10.1016/j.ccr.2005.10.015. [DOI] [PubMed] [Google Scholar]
- Okuwaki M, Nagata K. Template activating factor-I remodels the chromatin structure and stimulates transcription from the chromatin template. J Biol Chem. 1998;273:34511–34518. doi: 10.1074/jbc.273.51.34511. [DOI] [PubMed] [Google Scholar]
- Park KK, Liu K, Hu Y, Smith PD, Wang C, Cai B, Xu B, Connolly L, Kramvis I, Sahin M, He Z. Promoting axon regeneration in the adult CNS by modulation of the PTEN/mTOR pathway. Science. 2008;322:963–966. doi: 10.1126/science.1161566. [DOI] [PMC free article] [PubMed] [Google Scholar]
- Peitzsch RM, McLaughlin S. Binding of acylated peptides and fatty acids to phospholipid vesicles: pertinence to myristoylated proteins. Biochemistry. 1993;32:10436–10443. doi: 10.1021/bi00090a020. [DOI] [PubMed] [Google Scholar]
- Petros TJ, Rebsam A, Mason CA. Retinal axon growth at the optic chiasm: to cross or not to cross. Annu Rev Neurosci. 2008;31:295–315. doi: 10.1146/annurev.neuro.31.060407.125609. [DOI] [PubMed] [Google Scholar]
- Piper M, Dwivedy A, Leung L, Bradley RS, Holt CE. NF-protocadherin and TAF1 regulate retinal axon initiation and elongation in vivo. J Neurosci. 2008;28:100–105. doi: 10.1523/JNEUROSCI.4490-07.2008. [DOI] [PMC free article] [PubMed] [Google Scholar]
- Quadrato G, Di Giovanni S. Gatekeeper between quiescence and differentiation: p53 in axonal outgrowth and neurogenesis. Int Rev Neurobiol. 2012;105:71–89. doi: 10.1016/B978-0-12-398309-1.00005-6. [DOI] [PubMed] [Google Scholar]
- Qu D, Zhang Y, Ma J, Guo K, Li R, Yin Y, Cao X, Park DS. The nuclear localization of SET mediated by impalpha3/impbeta attenuates its cytosolic toxicity in neurons. J Neurochem. 2007;103:408–422. doi: 10.1111/j.1471-4159.2007.04747.x. [DOI] [PubMed] [Google Scholar]
- Saito S, Miyaji-Yamaguchi M, Shimoyama T, Nagata K. Functional domains of template-activating factor-I as a protein phosphatase 2A inhibitor. Biochem Biophys Res Commun. 1999;259:471–475. doi: 10.1006/bbrc.1999.0790. [DOI] [PubMed] [Google Scholar]
- Seo SB, McNamara P, Heo S, Turner A, Lane WS, Chakravarti D. Regulation of histone acetylation and transcription by INHAT, a human cellular complex containing the set oncoprotein. Cell. 2001;104:119–130. doi: 10.1016/S0092-8674(01)00196-9. [DOI] [PubMed] [Google Scholar]
- Smith PD, Sun F, Park KK, Cai B, Wang C, Kuwako K, Martinez-Carrasco I, Connolly L, He Z. SOCS3 deletion promotes optic nerve regeneration in vivo. Neuron. 2009;64:617–623. doi: 10.1016/j.neuron.2009.11.021. [DOI] [PMC free article] [PubMed] [Google Scholar]
- Stern S, Haverkamp S, Sinske D, Tedeschi A, Naumann U, Di Giovanni S, Kochanek S, Nordheim A, Knöll B. The transcription factor serum response factor stimulates axon regeneration through cytoplasmic localization and cofilin interaction. J Neurosci. 2013;33:18836–18848. doi: 10.1523/JNEUROSCI.3029-13.2013. [DOI] [PMC free article] [PubMed] [Google Scholar]
- Sun F, Park KK, Belin S, Wang D, Lu T, Chen G, Zhang K, Yeung C, Feng G, Yankner BA, He Z. Sustained axon regeneration induced by co-deletion of PTEN and SOCS3. Nature. 2011;480:372–375. doi: 10.1038/nature10594. [DOI] [PMC free article] [PubMed] [Google Scholar]
- Suzuki T, Muto S, Miyamoto S, Aizawa K, Horikoshi M, Nagai R. Functional interaction of the DNA-binding transcription factor Sp1 through its DNA-binding domain with the histone chaperone TAF-I. J Biol Chem. 2003;278:28758–28764. doi: 10.1074/jbc.M302228200. [DOI] [PubMed] [Google Scholar]
- Tan HB, Shen X, Cheng Y, Jiao Q, Yang ZJ, Zhong YS. Evaluation of a partial optic nerve crush model in rats. Exp Ther Med. 2012;4:401–404. doi: 10.3892/etm.2012.619. [DOI] [PMC free article] [PubMed] [Google Scholar]
- Tanaka H, Yamashita T, Asada M, Mizutani S, Yoshikawa H, Tohyama M. Cytoplasmic p21(Cip1/WAF1) regulates neurite remodeling by inhibiting Rho-kinase activity. J Cell Biol. 2002;158:321–329. doi: 10.1083/jcb.200202071. [DOI] [PMC free article] [PubMed] [Google Scholar]
- Tanaka H, Yamashita T, Yachi K, Fujiwara T, Yoshikawa H, Tohyama M. Cytoplasmic p21(Cip1/WAF1) enhances axonal regeneration and functional recovery after spinal cord injury in rats. Neuroscience. 2004;127:155–164. doi: 10.1016/j.neuroscience.2004.05.010. [DOI] [PubMed] [Google Scholar]
- Tanimukai H, Grundke-Iqbal I, Iqbal K. Up-regulation of inhibitors of protein phosphatase-2A in Alzheimer's disease. Am J Pathol. 2005;166:1761–1771. doi: 10.1016/S0002-9440(10)62486-8. [DOI] [PMC free article] [PubMed] [Google Scholar]
- ten Klooster JP, Leeuwen Iv, Scheres N, Anthony EC, Hordijk PL. Rac1-induced cell migration requires membrane recruitment of the nuclear oncogene SET. EMBO J. 2007;26:336–345. doi: 10.1038/sj.emboj.7601518. [DOI] [PMC free article] [PubMed] [Google Scholar]
- Trakhtenberg EF, Goldberg JL. Epigenetic regulation of axon and dendrite growth. Front Mol Neurosci. 2012;5:24. doi: 10.3389/fnmol.2012.00024. [DOI] [PMC free article] [PubMed] [Google Scholar]
- Vaesen M, Barnikol-Watanabe S, Götz H, Awni LA, Cole T, Zimmermann B, Kratzin HD, Hilschmann N. Purification and characterization of two putative HLA class II associated proteins: PHAPI and PHAPII. Biol Chem Hoppe Seyler. 1994;375:113–126. doi: 10.1515/bchm3.1994.375.2.113. [DOI] [PubMed] [Google Scholar]
- Vasudevan NT, Mohan ML, Gupta MK, Hussain AK, Naga Prasad SV. Inhibition of protein phosphatase 2A activity by PI3Kγ regulates β-adrenergic receptor function. Mol Cell. 2011;41:636–648. doi: 10.1016/j.molcel.2011.02.025. [DOI] [PMC free article] [PubMed] [Google Scholar]
- von Lindern M, van Baal S, Wiegant J, Raap A, Hagemeijer A, Grosveld G. Can, a putative oncogene associated with myeloid leukemogenesis, may be activated by fusion of its 3′ half to different genes: characterization of the set gene. Mol Cell Biol. 1992;12:3346–3355. doi: 10.1128/MCB.12.8.3346. [DOI] [PMC free article] [PubMed] [Google Scholar]
- Wagner S, Weber S, Kleinschmidt MA, Nagata K, Bauer UM. SET-mediated promoter hypoacetylation is a prerequisite for coactivation of the estrogen-responsive pS2 gene by PRMT1. J Biol Chem. 2006;281:27242–27250. doi: 10.1074/jbc.M605172200. [DOI] [PubMed] [Google Scholar]
- Xiong W, Dabbouseh NM, Rebay I. Interactions with the Abelson tyrosine kinase reveal compartmentalization of eyes absent function between nucleus and cytoplasm. Dev Cell. 2009;16:271–279. doi: 10.1016/j.devcel.2008.12.005. [DOI] [PMC free article] [PubMed] [Google Scholar]
- Xue Y, Chen H, Jin C, Sun Z, Yao X. NBA-palm: prediction of palmitoylation site implemented in naïve Bayes algorithm. BMC Bioinformatics. 2006;7:458. doi: 10.1186/1471-2105-7-458. [DOI] [PMC free article] [PubMed] [Google Scholar]
- Yiu G, He Z. Glial inhibition of CNS axon regeneration. Nat Rev Neurosci. 2006;7:617–627. doi: 10.1038/nrn1956. [DOI] [PMC free article] [PubMed] [Google Scholar]
- Yu G, Yan T, Feng Y, Liu X, Xia Y, Luo H, Wang JZ, Wang X. Ser9 phosphorylation causes cytoplasmic detention of I2PP2A/SET in Alzheimer disease. Neurobiol Aging. 2013;34:1748–1758. doi: 10.1016/j.neurobiolaging.2012.12.025. [DOI] [PubMed] [Google Scholar]
- Zhu LQ, Zheng HY, Peng CX, Liu D, Li HL, Wang Q, Wang JZ. Protein phosphatase 2A facilitates axonogenesis by dephosphorylating CRMP2. J Neurosci. 2010;30:3839–3848. doi: 10.1523/JNEUROSCI.5174-09.2010. [DOI] [PMC free article] [PubMed] [Google Scholar]