

One of the most important ways to curb the spread of antibiotic resistance among disease-causing organisms is to ensure the prudent use of antimicrobial agents, thus avoiding selective pressures that drive the spread of resistance. Accordingly, it is important to perform regular surveillance of antibiotic prescribing patterns to identify areas for improvement as well as to act as a benchmark for the measurement of change in future studies. This article, the first of five complementary articles in the current issue of the Journal, summarizes the prescribing pattern of all classes of antibiotics according to time and province in Canada.
Keywords: Antimicrobial spending, Antimicrobial stewardship, Antimicrobial use, Prescribing patterns, Surveillance
Abstract
BACKGROUND:
The volume and patterns of antimicrobial drug use are key variables to consider when developing guidelines for prescribing, and programs to address stewardship and combat the increasing prevalence of antimicrobial resistant pathogens. Because drug programs are regulated at the provincial level, there is an expectation that antibiotic use may vary among provinces.
OBJECTIVE:
To assess these potential differences according to province and time.
METHODS:
Provincial antimicrobial prescribing data at the individual drug level were acquired from the Canadian Integrated Program for Antimicrobial Resistance Surveillance for 2000 to 2010. Data were used to calculate two yearly metrics: prescriptions per 1000 inhabitant-days and the average defined daily doses per prescription. The proportion of liquid oral prescriptions of total prescriptions was also calculated as a proxy measure for the proportion of prescriptions given to children versus adults. To assess the significance of provincial antimicrobial use, linear mixed models were developed for each metric, accounting for repeated measurements over time.
RESULTS:
Significant differences among provinces were found, as well as significant changes in use over time. Newfoundland and Labrador was found to have significantly higher prescribing rates than all other provinces (P<0.001) in 2010, as well as the mean of all other provinces (P<0.001). In contrast, Quebec exhibited significantly lower prescribing than all other provinces (P<0.001 for all provinces except British Columbia, where P=0.024) and the mean of all other provinces (P<0.001).
DISCUSSION/CONCLUSION:
Reports of reductions in antimicrobial use at the Canadian level are promising, especially prescribing to children; however, care must be taken to avoid the pitfall of the ecological fallacy. Reductions are not consistent among the provinces or among the classes of antimicrobial drugs dispensed in Canada.
Abstract
HISTORIQUE :
Le volume et les modes d’utilisation d’antimicrobiens sont des variables importantes à envisager lorsqu’on élabore des lignes directrices de prescription et des programmes pour aborder la question de la gouvernance et pour lutter contre la prévalence croissante des pathogènes résistants aux antimicrobiens. Puisque les programmes de médicaments sont réglementés sur la scène provinciale, on s’attend que l’utilisation d’antibiotiques varie entre les provinces.
OBJECTIF :
Évaluer ces différences potentielles selon la province et dans le temps.
MÉTHODOLOGIE :
Les chercheurs ont extrait les données sur la prescription de chaque médicament antimicrobien sur la scène provinciale du Programme intégré canadien de surveillance de la résistance aux antimicrobiens entre 2000 et 2010. À l’aide de ces données, ils ont calculé deux mesures annuelles : les prescriptions par 1 000 habitants-jours et les doses thérapeutiques quotidiennes moyennes dispensées par prescription. Ils ont également calculé la proportion de prescriptions orales liquides par rapport aux prescriptions totales pour établir approximativement la proportion de prescriptions administrées aux enfants par rapport aux adultes. Pour évaluer l’importance de l’utilisation d’antimicrobiens sur la scène provinciale, les chercheurs ont élaboré des modèles linéaires mixtes pour chaque mesure, tenant compte de mesures répétées dans le temps.
RÉSULTATS :
Les chercheurs ont constaté des différences significatives entre les provinces, ainsi que des changements importants d’utilisation dans le temps. Ils ont déterminé que Terre-Neuve-et-Labrador présentait des taux de prescription considérablement plus élevés que toutes les autres provinces (P<0,001) en 2010, ainsi que de la moyenne de toutes les autres provinces (P<0,001). Par contre, le Québec présentait des taux de prescription considérablement plus faibles que toutes les autres provinces (P<0,001 pour toutes les provinces sauf la Colombie-Britannique, où P=0,024) ainsi que de la moyenne de toutes les autres provinces (P<0,001).
EXPOSÉ ET CONCLUSION :
Les rapports sur la diminution de l’utilisation d’antimicrobiens sur la scène canadienne sont prometteurs, notamment les prescriptions aux enfants. Cependant, il faut s’assurer d’éviter l’écueil des erreurs écologiques. Les réductions ne sont pas uniformes entre les provinces ou entre les classes d’antimicrobiens administrées au Canada.
In light of the continuing rise of antimicrobial-resistant pathogens, it has become increasingly important to surveil the use of antimicrobial drugs. Furthermore, this surveillance allows the advancement in the practice and monitoring of antimicrobial stewardship, which aims to maintain treatment options for bacterial pathogens in the future.
The overall prescription rate for antimicrobial drugs in Canada has declined since 1995 (1). However, care must be taken to avoid interpreting the decline at the provincial level due to the ecological fallacy (rates for all of Canada may not be representative of rates within the provinces). Prescription drug coverage is mandated at the provincial/territorial level and, thus, is organized by 13 different groups. Furthermore, it is known that antimicrobial drug use is not homogeneous among Canadian provinces because use in Quebec varies substantially from the provincial average (2). Due to provincial-level drug regulations, the lists of drugs available for financial reimbursement (formularies) are quite different among the provinces (3), and are expected to produce diverse patterns of drug use. At this time, differences in the use of antimicrobial drugs among Canadian provinces have not been quantified in the literature, leaving a gap in critical information required by policy groups who recommend changes to provincial/territorial drug plans. Therefore, the objective of the present article was to highlight significant differences in the use of antimicrobial drugs at the provincial level according to two metrics: prescriptions per 1000 inhabitant-days (PrIDs) and defined daily doses (DDDs) per prescription. A secondary objective of the present article was to compare antimicrobial use in Canadian provinces with those reported by the European Surveillance of Antimicrobial Consumption (ESAC-Net) group (4).
METHODS
The Canadian CompuScript (CSC) dataset was obtained from IMS Health Canada (http://www.imshealth.com) by the Public Health Agency of Canada-Canadian Integrated Program for Antimicrobial Resistance Surveillance. The CSC dataset is developed by accessing all marketed outpatient drug data dispensed via prescriptions by 5900 geographically representative retail pharmacies across Canada, with provincial-level coverage ranging from 51% to 88%. Geospatial extrapolation is used to infer use across all 8800 pharmacies (current as of May 2013). The extrapolation stratifies according to pharmacy size, type and province (5). This methodology nullifies any variance in store coverage over time and across geography. All data were reported monthly according to province for all new and refilled prescriptions. The CSC dataset included individual drug-level prescription count information, but also included manufacturer name, extended units prescribed (total number of tablets, capsules, millilitres, etc), drug strength, volume of active ingredient and patient acquisition cost. Data from Newfoundland and Labrador and Prince Edward Island were provided as combined values for the years 2000 to 2004. In 2005 and subsequent years, data from these provinces were provided individually. Population values were acquired from Statistics Canada (6). Where necessary, prescribing data were merged and, together with population data, were used to produce PrID, DDDs per 1000 inhabitant-days (DID) and DDD per prescription measures.
Linear mixed models were built in a forward stepwise fashion to assess differences in use according to province over the 2000 to 2010 study frame. Province and year were assessed as predictors for use at P<0.05 and assessed for confounding effects using a 25% change cutoff in any significant coefficient. Quadratic terms for year were assessed at P<0.05 where visually appropriate to model a curvilinear relationship between time and the outcome, as well as interaction terms between province and year, and province with the quadratic term for year. Repeated measures were accounted for by assigning a covariance structure to the residuals, and the best-fitting covariance structure was chosen using the most negative Akaike information criterion. Heteroscedasticity of the residuals was assessed visually and, where necessary, corrected using natural logarithm, square root or inverse transformations of the outcome variables. Normality was assessed by consensus using a combination of normality tests at P<0.05. Outlying observations were assessed by standardized residuals. Where extreme observations were present, models were re-run without these observations to assess their impact on the model parameters. Data for these extreme observations were assessed to assure that recording errors were not present. Predictions were back-transformed where necessary to produce graphics.
Antimicrobial use data (PrID, DID and DDD per prescription) for reporting European countries in 2009 were obtained from ESAC-Net (4) and used to compare with data from Canadian provinces in 2009. Permission was obtained to reproduce ESAC-Net data. All calculations and analyses were performed using SAS 9.3 (SAS Institute Inc, USA) for Windows (Microsoft Corporation, USA) and graphs were produced using Excel (Microsoft Corporation, USA).
RESULTS
Model building and residual analyses
The PrID model included province, time, and an interaction term between province and time as significant predictors. A first-order autoregressive term was included to account for repeated measures, and a natural logarithm of the outcome variable was applied to meet the assumption of homoscedasticity. The assumption of normality could not be met with all observations, but was achieved with the removal of three outlying observations. The removal of these observations did not dramatically affect the model estimates and these observations did not include recording errors. As such, the outlying observations were retained in the final model.
For the DDD per prescription model, province, year and a quadratic term for year were included as significant predictors. A first-order autoregressive term was included to account for repeated measures, normality was met, heteroscedasticity of the residuals was obtained by a natural logarithm transformation of the outcome and no extreme outlying observations were found.
PrIDs
The linear mixed model revealed that prescribing rates were different among provinces and that these differences were time dependent (Figure 1A). The majority of provinces showed a slight decline in prescribing from 2000 to 2010 (Figure 1A). Because the prescribing rates were dependent on time, all comparisons were performed for 2010 data. Newfoundland and Labrador was found to have significantly higher prescribing rates than all other provinces (P<0.001) in 2010, as well as the mean of all other provinces (P<0.001). In contrast, Quebec displayed significantly lower prescribing than all other provinces (P<0.001 for all provinces except British Columbia, where P=0.024) and the mean of all other provinces (P<0.001). In addition, prescribing was significantly higher in Saskatchewan compared with Alberta, British Columbia, New Brunswick and Ontario (P<0.02), as well as the mean of all other provinces (P=0.005). Finally, prescribing was lower in British Columbia compared with Prince Edward Island, Nova Scotia, and Manitoba (P<0.05), as well as the mean of all other provinces (P=0.003). No other significant differences were found.
Figure 1).
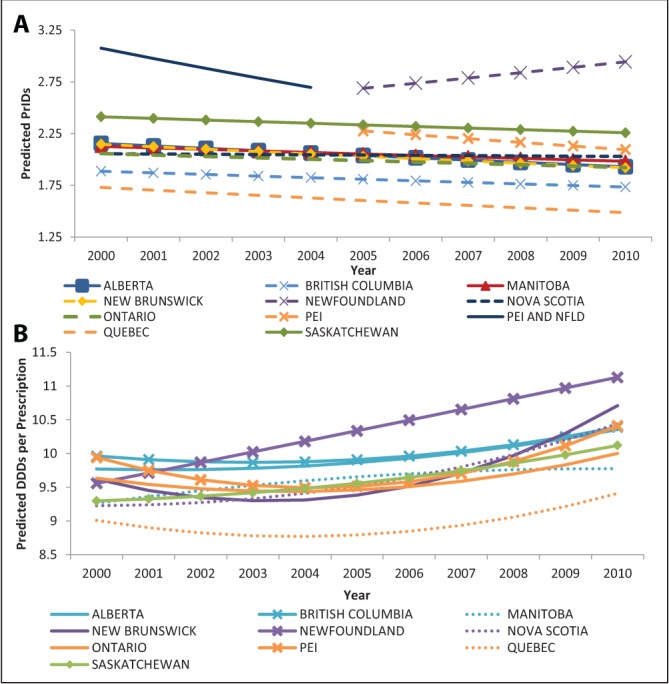
Linear mixed-model predictions for the models describing provincial antimicrobial prescriptions per 1000 inhabitant-days (PrIDs) (A) and defined daily doses (DDDs) per prescription (B) dispensed by outpatient pharmacies in Canada (2000 to 2010). Data for the provinces of Prince Edward Island (PEI) and Newfoundland and Labrador were provided as combined values for 2000 to 2004. As of 2005, the data were provided at the individual provincial level. To ensure model conversion, the analysis had to be performed with Newfoundland and Labrador and PEI separately, including the years from 2000 to 2004. This was possible by assigning the same data values to both provinces during this time period
DDDs per prescription
The linear mixed model for the DDD per prescription measure revealed significant differences among provinces (Figure 1B). Considerable increases were observed for Newfoundland and Labrador, New Brunswick and Nova Scotia from 2000 to 2010, while smaller increases were observed for the remaining provinces. In 2010, the DDDs per prescription were significantly lower for Quebec than all provinces (P<0.05). Furthermore, the DDDs per prescription were significantly lower in Manitoba than in Newfoundland and Labrador, New Brunswick, Nova Scotia, Prince Edward Island, British Columbia and Alberta (P<0.05). Ontario’s DDDs per prescription were significantly lower than New Brunswick, Prince Edward Island, British Columbia and Alberta, while Alberta had significantly lower DDDs per prescription than New Brunswick.
Comparison with European countries
Antimicrobial use data for 2009 according to province were compared with reporting European countries and ranked according to DID, PrID and DDD per prescription measures, with the lowest use ranked as 1. Results of ranking are displayed in Table 1.
TABLE 1.
Comparison of total antimicrobial use among Canadian provinces and the reporting European Surveillance of Antimicrobial Consumption countries according to defined daily doses (DDDs) per 1000 inhabitant-days (DIDs) prescriptions per 1000 inhabitant-days (PrIDs) and DDD per prescription measures in 2009
| Country or province |
DIDs
|
PrIDs
|
DDD per prescription
|
|||
|---|---|---|---|---|---|---|
| Value | Rank | Value | Rank | Value | Rank | |
| Alberta | 19.33 | 22 | 1.89 | 8 | 10.21 | 22 |
| Austria | 15.93 | 11 | 1.97 | 13 | 8.08 | 11 |
| Belgium | 27.52 | 37 | 2.53 | 19 | 10.89 | 26 |
| British Columbia | 17.43 | 15 | 1.70 | 5 | 10.25 | 24 |
| Bulgaria | 18.59 | 19 | 3.26 | 25 | 5.70 | 3 |
| Canada | 18.19 | 17 | 1.84 | 7 | 9.87 | 19 |
| Croatia | 21.21 | 29 | 2.87 | 23 | 7.38 | 8 |
| Cyprus | 34.44 | 42 | NR | NR | NR | NR |
| Czech Republic* | 18.44 | 18 | 2.08 | 15 | 8.87 | 12 |
| Denmark | 15.97 | 12 | 1.72 | 6 | 9.26 | 15 |
| Estonia | 11.07 | 3 | 1.70 | 4 | 6.52 | 4 |
| Finland | 17.96 | 16 | 1.90 | 9 | 9.46 | 16 |
| France | 29.58 | 40 | NR | NR | NR | NR |
| Germany | 14.90 | 9 | NR | NR | NR | NR |
| Greece | 38.64 | 43 | 5.30 | 27 | 7.30 | 7 |
| Hungary | 15.98 | 13 | NR | NR | NR | NR |
| Iceland | 19.35 | 23 | NR | NR | NR | NR |
| Ireland* | 20.76 | 28 | 2.68 | 21 | 7.76 | 10 |
| Israel | 22.42 | 32 | NR | NR | NR | NR |
| Italy† | 28.66 | 39 | 11.01 | 28 | 2.60 | 1 |
| Latvia | 10.48 | 2 | NR | NR | NR | NR |
| Lithuania | 19.72 | 25 | 2.97 | 24 | 6.64 | 5 |
| Luxembourg | 28.19 | 38 | NR | NR | NR | NR |
| Malta | 21.59 | 30 | NR | NR | NR | NR |
| Manitoba | 18.98 | 20 | 1.95 | 11 | 9.71 | 17 |
| New Brunswick | 20.23 | 26 | 1.95 | 10 | 10.39 | 25 |
| Newfoundland and Labrador | 31.36 | 41 | 2.86 | 22 | 10.98 | 27 |
| Norway | 15.23 | 10 | NR | NR | NR | NR |
| Nova Scotia | 20.52 | 27 | 2.01 | 14 | 10.23 | 23 |
| Ontario | 19.24 | 21 | 1.96 | 12 | 9.84 | 18 |
| Prince Edward Island | 22.19 | 31 | 2.19 | 17 | 10.12 | 21 |
| Poland | 23.59 | 35 | NR | NR | NR | NR |
| Portugal | 22.94 | 34 | 2.55 | 20 | 8.98 | 13 |
| Quebec | 14.19 | 7 | 1.54 | 3 | 9.23 | 14 |
| Romania | 10.19 | 1 | NR | NR | NR | NR |
| Russian Federation | 12.20 | 5 | 4.12 | 26 | 2.96 | 2 |
| Saskatchewan | 22.82 | 33 | 2.30 | 18 | 9.93 | 20 |
| Slovakia | 23.78 | 36 | NR | NR | NR | NR |
| Slovenia | 14.42 | 8 | 2.12 | 16 | 6.80 | 6 |
| Spain | 19.68 | 24 | NR | NR | NR | NR |
| Sweden | 13.95 | 6 | 1.19 | 1 | 11.77 | 28 |
| The Netherlands | 11.39 | 4 | 1.53 | 2 | 7.44 | 9 |
| United Kingdom | 17.27 | 14 | NR | NR | NR | NR |
Lowest use ranking = 1.
2007 values;
2008 values; NR Not reported
DISCUSSION
Although the overall rate of prescribing (PrID) of antimicrobials has declined in Canada since 1995 (1), patterns of use vary significantly according to time and province. Although dependent on time, the overall pattern of reduced prescribing in Canada is also present at the provincial level. However, the amount of reduction observed over the time frame differed according to province, and the provinces showed significant differences in their volume of prescribing. The two most divergent provinces were Newfoundland and Labrador and Quebec, representing the high and low extremes, respectively. The prescribing rates for Newfoundland and Labrador were higher than all other provinces at every time point examined.
In contrast to declining prescribing, the average DDDs per prescription increased in all provinces over time. In recent years, there has been a push to reduce inappropriate prescribing of antimicrobials to children; this increase in DDDs per prescription may reflect adherence to this reduction because a relative increase in prescribing to adults would produce such a trend (authors’ unpublished observation). This trend could also be produced by increases in the average strength or duration of antimicrobial treatments, which may occur with increases in infections with resistant pathogens. Future assessment of prescribing at various age groupings is suggested to address this issue.
Although the DID and PrID measures ranked Canada in the top one-half or upper one-third of the ESAC countries (with the lowest use being ranked highest) in 2009, results of the present study suggest that ranking Canada as a single country may be misleading. The province of Quebec has historically reported lower use of antibiotic drugs than other provinces (2), and this was similarly apparent in the data accessed for the present study. Ranking individual Canadian provinces against the reporting European countries again highlighted the low use patterns in Quebec (seventh of 43 according to DIDs, third of 28 according to PrIDs) and the dramatically higher usage in Newfoundland and Labrador (41 of 43 according to DIDs, 22 of 28 according to PrIDs). The DDD per prescription measure revealed that the average volume of active ingredient supplied per prescription in Canada is relatively high compared with reporting European countries. However, this measure may be influenced by age distributions and prescribing for children (author’s unpublished observation). Because there have been programs in recent years aimed at reducing inappropriate prescribing for children in Canadian provinces, these results are expected and welcomed.
Due to the disparity in ranking of Canadian provinces, it is difficult to assess antimicrobial use in Canada and effectively report on changes without analysis at the provincial level. Furthermore, assessment of the reasons for these discrepancies is necessary, and may require discussions with stakeholders from each province to identify potential factors and programs that may be implemented nationally.
If the disease burden is relatively homogenous among the provinces, discrepancies in the prescribing rates for antimicrobial drugs and the relative ranking of antimicrobial classes among provinces suggest that the choice of antimicrobial prescribed may be based on reasons other than the pathogen alone. One such reason may be the list of antimicrobials that is available for reimbursement through provincial drug plans (formularies) (3). Research has clearly demonstrated that changes to formularies can result in significant changes to the patterns in use (7) and is correlated with the number of hospitalizations (8). Furthermore, the listing of specific drugs on provincial formularies has been shown to be associated with increased use compared with provinces in which the drug is not listed (8). However, the general stringency or flexibility of provincial formularies is not associated with the volume of antimicrobial use in that province, suggesting that the use of individual drugs may be modified by formulary changes, but use of that drug may be replaced by another.
Multifaceted community stewardship programs to change the general social environment of antimicrobial use may be the most effective tool for stewardship. In a review of the characteristics and outcomes of 22 antimicrobial use public education campaigns, it was found that most campaigns were able to reduce antibiotic use. However, the impact this may have had on the prevalence of antimicrobial resistant organisms could not be assessed (9). In Canada, the medical community within the province of Quebec has been diligent in their efforts to change the social view of antimicrobials, and the results in the present article highlight the significance of these efforts. Antimicrobial stewardship education is included in the medical programs in Quebec, and supported by continuing education programs and the publication of antimicrobial prescribing guidelines, which have been updated recently (10). Furthermore, the media has been used to educate the public on the importance of appropriate antimicrobial use. In British Columbia, the ‘Do Bugs Need Drugs?’ program has been increasing awareness and knowledge among physicians with the aim to reduce unnecessary prescribing since the fall of 2005 (11). An evaluation of this program showed significant improvements in prescribing practices among physicians that participated in Do Bugs Need Drugs?, highlighting the need to reach all physicians to have a community level change.
We recognize the limitations of our analysis, including the inclusion of three outlying observations when building the PrID model, although the assumption of normality could not be met with all observations. Retaining them in the final model did not affect the obtained estimates and they were retained for completeness. In addition, we recognize that comparison of data for 2009 may not reflect 2012 patterns of use; however, given the need for comparison with the 2009 European data, it was considered to be the most appropriate.
The effective management of antimicrobial use in Canada will require cooperation among the 13 governing bodies and considerable inputs. Examination of current policies, continued physician education, and public awareness campaigns will all be necessary to maintain the efficacy of these life-saving drugs that have been taken for granted since their discovery.
Footnotes
DISCLAIMER: This article was prepared using data from IMS Health Canada Inc. The analyses, conclusions, opinions and statements expressed are those of the authors and not those of IMS Health Canada Inc.
REFERENCES
- 1.Conly JM. Antimicrobial resistance programs in Canada 1995–2010: A critical evaluation. Antimicrob Resist Infect Control. 2012;1:10–4. doi: 10.1186/2047-2994-1-10. [DOI] [PMC free article] [PubMed] [Google Scholar]
- 2.Weiss K, Blais R, Fortin A, Lantin S, Gaudet M. Impact of a multipronged education strategy on antibiotic prescribing in Quebec, Canada. Clin Infect Dis. 2011;53:433–9. doi: 10.1093/cid/cir409. [DOI] [PubMed] [Google Scholar]
- 3.Anis AH, Guh D, Wang X. A dog’s breakfast: Prescription drug coverage varies widely across Canada. Med Care. 2001;39:315–26. doi: 10.1097/00005650-200104000-00003. [DOI] [PubMed] [Google Scholar]
- 4.Adriaenssens N, Coenen S, Versporten A, et al. European surveillance of antimicrobial consumption (ESAC): Outpatient antibiotic use in Europe (1997 – 2009) J Antimicrob Chemother. 2011;66(Suppl 6):vi3–vi12. doi: 10.1093/jac/dkr453. [DOI] [PubMed] [Google Scholar]
- 5.IMS Health Canada Unlocking the value of health information: How Canada’s healthcare community uses IMS evidence-based intelligence to improve healthcare. 2007. < www.imshealth.com/ims/Global/Content/Solutions/Solutions%20by%20Sector/Providers/ValueofHealthInformation.pdf> (Accessed September 6, 2012)
- 6.Statistics Canada Table 051-0001 – Estimates of population, by age group and sex for July 1, Canada, provinces and territories, annual (persons), 1971 to 2010 (table), CANSIM (database), Using E-STAT (distributor). < www5.statcan.gc.ca/cansim/a05?lang=eng&id=0510001> (Accessed March 21, 2012).
- 7.Marshall D, Gough J, Grootendorst P, et al. Impact of administrative restrictions on antibiotic use and expenditure in Ontario: Time series analysis. J Health Serv Res Pol. 2006;11:13–20. doi: 10.1258/135581906775094253. [DOI] [PubMed] [Google Scholar]
- 8.LeLorier J, Derderian F. The effect of listing ciprofloxacin in provincial formularies on hospitalizations for bronchitis and pyelonephritis. Can J Clin Pharmacol. 1998;5:133–7. [Google Scholar]
- 9.Huttner B, Goossens H, Verheij T, Harbarth S. Characteristics and outcomes of public campaigns aimed at improving the use of antibiotics in outpatients in high-income countries. Lancet Infect Dis. 2010;10:17–31. doi: 10.1016/S1473-3099(09)70305-6. [DOI] [PubMed] [Google Scholar]
- 10.Institut national d’excellence en santé et en services sociaux Clinical guides for antibiotic use. < www.inesss.qc.ca/> (Accessed July 11, 2012). [Google Scholar]
- 11.McKay RM, Vrbova L, Fuertes E, et al. Evaluation of the Do Bugs Need Drugs? program in British Columbia: Can we curb antibiotic prescribing? Can J Infect Dis Med Microbiol. 2011;22:19–24. doi: 10.1155/2011/745090. [DOI] [PMC free article] [PubMed] [Google Scholar]