Abstract
Purpose
The purpose of this study was to create synthetic vocal fold models with nonlinear stress-strain properties and to investigate the effect of linear versus nonlinear material properties on fundamental frequency during anterior-posterior stretching.
Method
Three materially linear and three materially nonlinear models were created and stretched up to 10 mm in 1 mm increments. Phonation onset pressure (Pon) and fundamental frequency (F0) at Pon were recorded for each length. Measurements were repeated as the models were relaxed in 1 mm increments back to their resting lengths, and tensile tests were conducted to determine the stress-strain responses of linear versus nonlinear models.
Results
Nonlinear models demonstrated a more substantial frequency response than did linear models and a more predictable pattern of F0 increase with respect to increasing length (although range was inconsistent across models). Pon generally increased with increasing vocal fold length for nonlinear models, whereas for linear models, Pon decreased with increasing length.
Conclusions
Nonlinear synthetic models appear to more accurately represent the human vocal folds than linear models, especially with respect to F0 response.
Keywords: voice production, vocal fold modeling, fundamental frequency response, phonation onset pressure, nonlinear stress-strain
Introduction
Synthetic vocal fold models have long been used to explore the complex, coupled aerodynamic-acoustic-structural physics of voice production. Some of the models have been rigid and motionless, some have exhibited prescribed motion, while others have mimicked the self-oscillating nature of the human vocal folds, i.e., the motion has been coupled with the air flow. As early as 1930, for example, Paget (Paget, 1930; Zemlin, 1998) created a model using rubberlike vocal folds and a complex resonating cavity which successfully produced humanlike sounds. Self-oscillating synthetic models have been used increasingly in recent years, particularly in conjunction with advanced technological tools such as high-speed digital recording for structural imaging and particle image velocimetry (PIV) for flow field quantification.
Many of the self-oscillating synthetic models have been single-layered and isotropic, having the same mechanical properties throughout (Thomson, Mongeau, & Frankel, 2005; Zhang, Neubauer, & Berry, 2006a, 2006b). For example, Thomson et al. (2005) compared the flow-induced response of a single-layered synthetic model, made of a two-part addition cure polymer called Evergreen™ 10, to that of the human vocal folds. Similarities between the model's response and human phonation (Jiang & Titze, 1993) were found in frequency of oscillation, amplitude of vibration, and flow rate. However, several differences were also found. First, the mucosal wave seen in typical human vocal fold vibration (Titze, 1994) was not significantly manifest in this model. Also, extensive adhesion of the surfaces resulted in additional changes in the vibration pattern. Inferior-superior motion in this model was considered to be significantly greater than what is typically seen in human vocal fold vibration.
Other self-oscillating synthetic models have been multi-layered, but also isotropic (Chan, Titze, & Titze, 1997; Drechsel & Thomson, 2008; Pickup & Thomson, 2009; Riede, Tokuda, Munger, & Thomson, 2008). Many of these models have demonstrated similar results to single-layered isotropic models with respect to frequency of oscillation, adhesion of the vocal fold surfaces, and exaggerated inferior-superior motion. Many multi-layered models have also continued to lack a visible mucosal wave during vibration. Attempts to improve model motion have been made using geometry changes (Pickup & Thomson, 2010, 2011). However, the material properties are also an important consideration, particularly the characteristics of anisotropy and nonlinear stress-strain response that are more reflective of the composition and material properties of the multi-layered human vocal folds.
Synthetic vocal fold models are intended to complement (not replace) excised larynx and in vivo vocal fold studies. In this capacity they offer several advantages, two of which are mentioned here. First, since fabrication of synthetic models is relatively straightforward and inexpensive, and since the prototyping process allows for control over geometry and material properties, parametric studies involving systematic changes to geometry and material properties can be performed that would not be possible with real or excised vocal folds (Chan et al., 1997). Second, models can typically be continuously used (vibrated and tested) for several hours, and in some cases reused even after several months with reasonable reliability (Thomson et al., 2005). This is not feasible with excised and in vivo studies (Pickup & Thomson, 2009), and this extended period of access allows for more detailed and extensive data acquisition. Recent uses of synthetic, self-oscillating vocal fold models include investigations of aerodynamic energy transfer (Thomson et al., 2005), left-right stiffness asymmetry (Pickup & Thomson, 2009; Zhang, 2010), and flow field quantification (Becker et al., 2009). Several more examples and a more thorough review of synthetic vocal fold models can be found in Kniesburges et al (2011).
Synthetic models have a number of disadvantages, among them the fact that no synthetic model to date fully represents the human vocal folds. Human vocal fold modeling is particularly challenging due to the complex structure of the vocal folds, which consist of multiple, anisotropic layers with their own biomechanical properties, including contractile muscle tissue. Nevertheless, the aforementioned advantages of synthetic models provide the motivation to improve their properties to make them more lifelike and thus broaden their application.
While many quantitative measures of synthetic vocal fold model response have been reported, no attempt has to date been made to apply strain to a synthetic model in order to observe changes in fundamental frequency (F0) with respect to change in length. Many factors contribute to F0 regulation in human phonation. These include changes in length, tension, and effective mass of the vocal folds, which result from muscle activity in the larynx, particularly of the cricothyroid (CT) and thyroarytenoid (TA) muscles (Case, 2002; Lofqvist, Baer, McGarr, & Story, 1989; Titze, 1994; Zemlin, 1998). In addition, differing concentrations of elastin and collagen fibers throughout the three layers of the lamina propria give the vocal folds passive nonlinear stress-strain properties (Gray, Alipour, Titze, & Hammond, 2000; Gray, Hirano, & Sato, 1993; Hirano & Kakita, 1985).
The purpose of the present study was to create a materially nonlinear synthetic model of the vocal folds and compare its oscillation with that of human vocal folds. The effect of nonlinear material properties on F0 response and onset pressure (Pon, or the pressure required to initiate vibration) was investigated. It was reasoned that this would contribute to the development of a more realistic synthetic model of the vocal folds which could be used in further voice research.
Methods
Model Fabrication
Six pairs of synthetic vocal fold models were fabricated and tested in this study. Each model had two layers: a flexible outer layer (“cover”) and a relatively stiff inner layer (“body”). The geometry was based on that of Scherer et al. (2001). This two-layer model concept was described by Hirano & Kakita (1985) and has been previously used in vocal fold modeling (e.g., Riede et al., 2008). Three models were fabricated that yielded linear stress-strain responses (hereafter called “linear models”). Three additional models were fabricated that were identical to the linear models, with the addition of fibers interspersed in the cover layer such that the stress-strain responses were nonlinear (“nonlinear models”).
Linear Model Fabrication
The three linear models were fabricated according to the process described by Riede et al. (2008) and Drechsel (2008) and as summarized here. The models were made using the two-part addition-cure silicone compounds Ecoflex™ 0030 (hereafter denoted EF) and Dragon Skin™ Q (hereafter denoted DS), in addition to a silicone thinner (Silicone Thinner®, hereafter denoted ST). These products are manufactured and distributed by Smooth-On, Inc. (Easton, PA, USA).
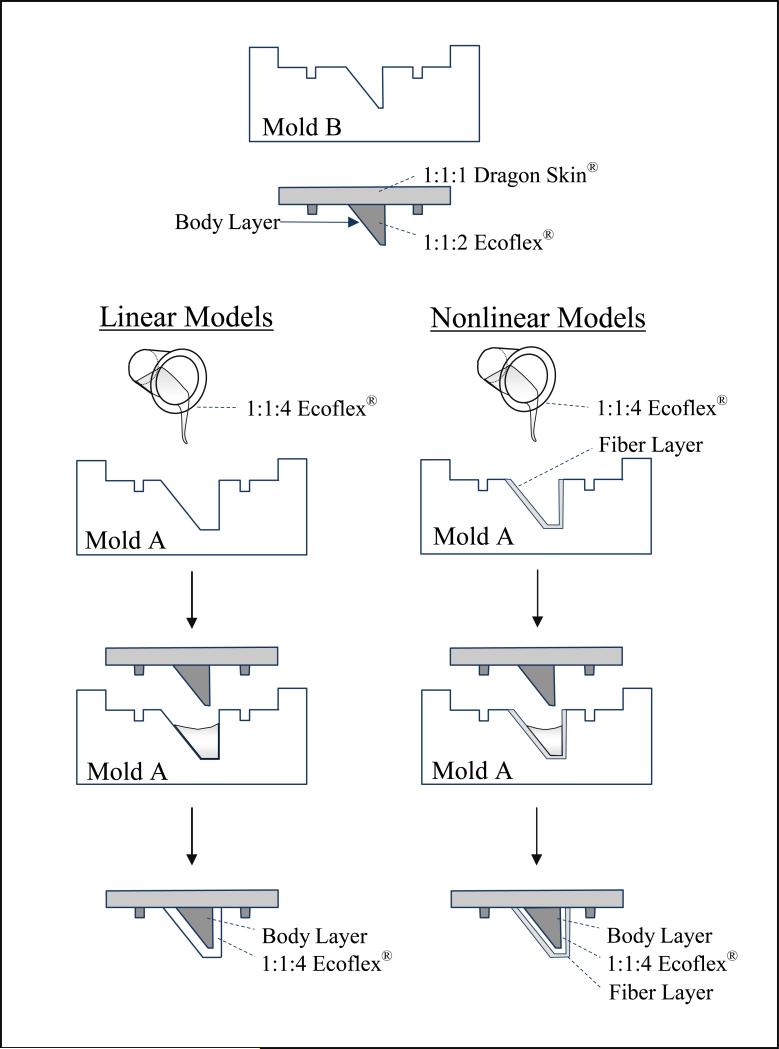
The models were created using two separate molds (Figure 1) that had been previously fabricated using computer-generated 3D models and rapid prototyping techniques (Riede et al., 2008). The body layer was first made by pouring a 1:1:2 silicone mixture into Mold B (where 1:1:2 denotes a mixture of one part EFPart A, one part EFPart B, and two parts ST; parts being measured by weight). The mixture was allowed to cure at room temperature (about 4 hours), afterwards yielding a material that exhibited a nearly linear stress-strain response with a Young's modulus of approximately 10.53 kPa. After the body was completely cured, a layer of DS with a mixing ratio of 1:1:1 (DSPart A:DSPart B:ST) was poured over the body layer and allowed to cure (about 75 minutes). This stiff base layer was about 2.5 mm thick and was primarily used for attachment purposes.
Figure 1.
Molds used to create a two-layered synthetic model of the vocal folds. Mold B was used to create the body layer for both linear (LM) and nonlinear (NLM) models. For LM, Mold A was then used to add a 2 mm thick cover layer to the body. For NLM, a cured, 1 mm thick fiber layer was first added to Mold A (left). Then, additional 1:1:4 Ecoflex silicone was added on top of this fiber layer, and the body layer was inserted (right).
After curing, the combined body and base layers were removed from Mold B so a 2 mm-thick cover layer could be added to the model using Mold A. This cover layer was created using a 1:1:4 mixing ratio of EFPart A:EFPart B:ST. This mixture yields a Young's modulus of approximately 3.34 kPa. This 1:1:4 mixture was poured into Mold A, followed by insertion of the cured body model, ensuring that no visible air bubbles remained underneath. After curing (about 8 hours) the completed linear model was removed from Mold A.
Nonlinear Model Fabrication
The three nonlinear models were created using a similar procedure with the same M5 geometry. The body layer for each nonlinear model was created as outlined above for the linear models. The nonlinear models contained curled fibers embedded into the cover to allow a simulation of the nonlinear stress-strain function of collagen fibers in human vocal folds. As described below, two types of fibers were used to construct fiber layers: curled polyester fiber bundles unwoven from a sample of polyester fabric, and curled acrylic fiber bundles unwoven from yarn strands. Fiber layers were approximately 1 mm thick and were created using the following procedure.
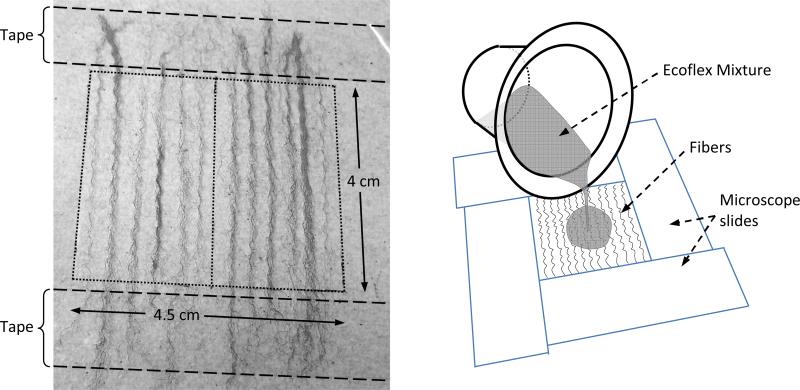
Bundled strands of unwoven curled polyester and acrylic fibers were arranged over a 4.0 cm × 4.5 cm region of an overhead transparency sheet (Figure 2). The fiber ends were anchored to the transparency using tape. Twelve acrylic fiber bundles and 14 polyester fiber bundles were used. A form with inside dimensions of 4.0 cm × 4.5 cm was created around the fibers using four 1 mm-thick microscope slides arranged in a rectangular box shape and adhered with Duro® Super Glue. Dow Corning® High Vacuum Grease was placed over the fibers to seal the microscope slides to the overhead transparency. A 1:1:4 EF mixture (the same mixture used to form the cover layer of the linear models) was poured over the fibers until the silicone was level with the microscope slides and left to cure for at least 8 hours. This resulted in a silicone layer with embedded fibers. After curing, the microscope slides were removed and the fiber layer was removed from the transparency sheet. Each layer was then cut parallel to the direction of the fibers into two equal halves.
Figure 2.
Illustrations of fiber layer fabrication used in the nonlinear models. (Left) Acrylic fibers secured in place. (Right) Fibers within microscope slide framework, and pouring of 1:1:4 EF mixture over fibers to complete fiber layer construction.
Each half-layer was used to make one nonlinear pair of matching vocal folds. A half-fiber layer was placed into Mold A (the cover mold). Additional 1:1:4 EF mixture was poured over this fiber layer, increasing the total cover layer thickness to 2 mm. The body was then inserted into Mold A, and this setup was left to cure (at least 8 hours). The result was a nonlinear fiber model with a body layer and a 2 mm cover layer, where the cover layer consisted of two 1 mm layers (a linear material layer adjacent to the body, and 1 mm nonlinear fiber layer closest to the surface).
Model Mounting and Experiment Setup
Each of the six molded elements (three linear and three nonlinear) was used to create a pair of matching vocal folds. This was done by cutting each molded element in half so that each individual vocal fold measured 17 mm in the anterior-posterior direction. Individual folds were mounted to cured blocks of 1:1:1 ratio DS, measuring 17 mm (anterior-posterior) × 17 mm (medial-lateral) × 13 mm (inferior-superior), using Sil-Poxy© Silicone Rubber Adhesive. Talc powder was applied to the folds’ surfaces to reduce surface tackiness.
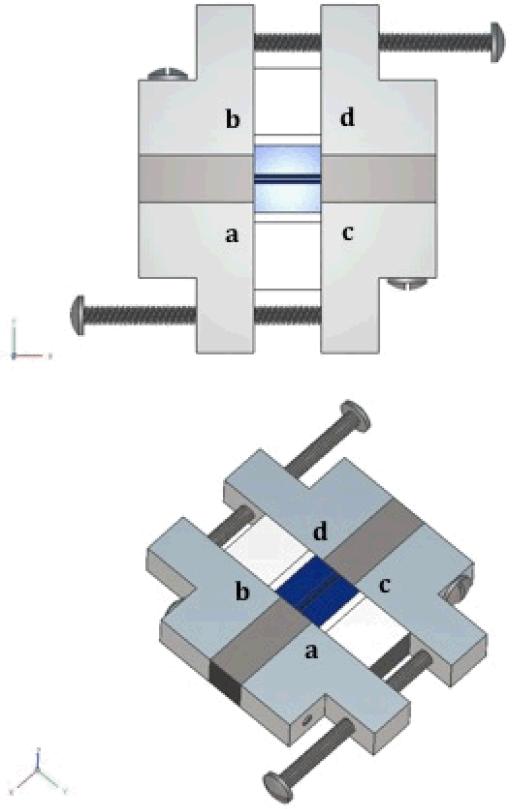
A four-plate aluminum tensioning system was designed to allow the vocal fold positions to be adjusted in two dimensions (Figure 3). Two layers of closed-cell foam were placed between blocks a and b and blocks c and d to allow for complete glottal closure following each length adjustment. The synthetic vocal folds (which had been mounted to DS blocks as noted above) were adhered to the four aluminum blocks using Elmer's™ Stix-All glue, and two sets of screws were used to anchor the aluminum plates together. Models were first stretched in the anterior-posterior direction and were then adjusted medially, ensuring contact between opposing vocal folds (see Shaw (2010) for a more detailed description).
Figure 3.
Diagram illustrating the constructed four-plate tensioning system used for this study.
Data Collection
During testing the four-plate system was fastened to an air supply tube which was fed using a compressed air source. This flow setup was based on the previous work of Pickup & Thomson (2009). Dow Corning® High Vacuum Grease was used between the air supply and tensioning plates to minimize air leakage. Subglottal pressure (Ps) was monitored using a pressure transducer (Omega PX138-0015DV with an Omega DP24-E Process Meter) placed inside the tubing, approximately flush with the inside wall, and directly below the tensioning plates. To calculate F0, a ¼-inch Larson-Davis 2520 microphone was also mounted inside the tubing just below the tensioning plates, and F0 was recorded using a National Instruments data acquisition system (PXI-1042Q) and National Instruments LabVIEW software.
During testing, the length of the models was measured for each extension. Tests were performed at resting position (no extension) and in 1 mm increments up to 10 mm extension. Tests were repeated during relaxation of the vocal folds from +9 mm extension back to resting position (also in 1 mm increments). For each length the following procedure was followed.
Procedure
The tensioning plates were removed from the air supply. Screws running from plates a to c and b to d were tightened in order to stretch the models anteriorly-posteriorly (analogous to the effect of CT muscle activation) until the desired extension length was reached. The glottal gap was closed (such that the medial surfaces of the models were just touching) after each extension by tightening the short screws running from plates a to b and c to d, and the system was remounted to the air supply. Vocal fold length was re-measured after mounting to ensure that the plates did not slide during the clamping process. Air flow was supplied to the system, and Ps was gradually increased in increments of 0.10 kPa until oscillation began. This measure was recorded as Pon for the given vocal fold extension. F0 was also recorded at this point. This procedure, including extension and relaxation measures, was repeated approximately twenty-four hours later to check for retest reliability of the models (see Shaw (2010) for these results).
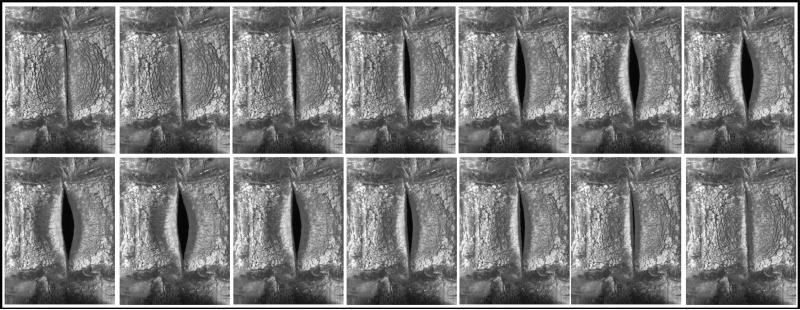
Vocal fold motion during all testing conditions was recorded with a Panasonic PV-GS400 digital video camera and an Omega HHT41B portable digital industrial stroboscope. In addition, high speed images were acquired at 0 mm, +5 mm, and +10 mm extensions for one linear and one nonlinear model using a Photron APX-RS high speed camera at a rate of 10,000 frames per second with a 512 × 512 pixel resolution (Figures 4 and 5).
Figure 4.
High-speed images taken during testing from a linear vocal fold model at 0 mm extension. Note that there is no visible mucosal wave and significant interior-superior motion.
Figure 5.
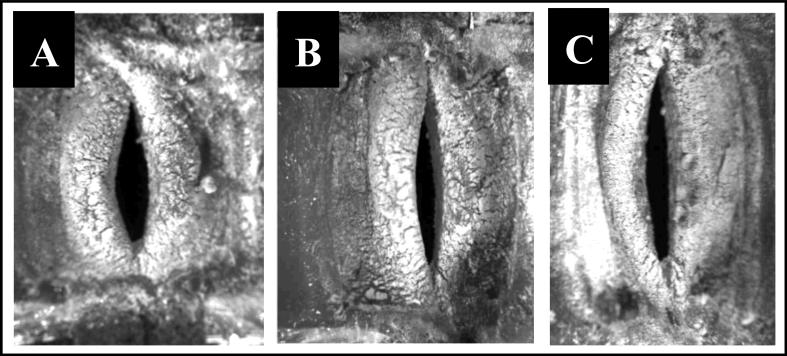
High-speed images taken during testing from a nonlinear vocal fold model at (A) 0 mm, (B) 5 mm, and (C) 10 mm extensions. Note the changes in geometry with respect to extension.
Stress-strain data
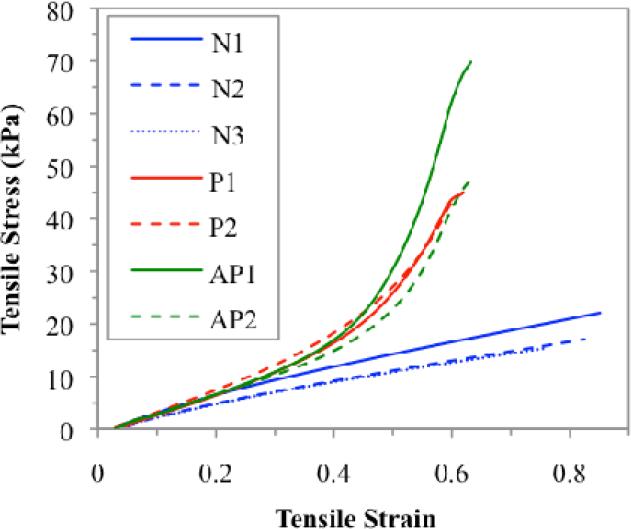
Stress-strain data were collected for the body and cover layer materials for both linear and nonlinear models. In addition, stress-strain data were obtained for three constructed linear models and for four constructed nonlinear models, two of which contained only polyester fibers and two of which contained polyester and acrylic fibers (see Figure 6). The constructed vocal fold models used to collect stress-strain data were distinct from those used in frequency testing but had similar material properties and dimensions. An Instron® tensile testing apparatus was used to obtain stress and strain for each sample item.
Figure 6.
Stress-strain properties for three linear (N) and four nonlinear (P/AP) silicone vocal fold models. Two of the nonlinear models contained only polyester fibers (P), and two contained polyester and acrylic fibers (AP), similar to those used in frequency testing. As shown by the slope, linear vocal fold models had a nearly linear stress-strain characteristic. Models with polyester and acrylic fibers embedded in the cover demonstrated a nonlinear stress-strain curve, with acrylic fibers potentially providing more resistance than polyester fibers.
Fiber density data
During an initial review of the findings, it was reasoned that differences in acrylic fiber density across models could have influenced the F0 test results. Therefore, acrylic fiber density readings for each nonlinear model were obtained using the following procedure.
Each of the three nonlinear models was removed from the aluminum tensioning plates and then from its DragonSkin™ blocks. Each model contained two individual vocal folds (taken from the same original mold) for a total of six individual nonlinear vocal folds. Each individual fold was then cut in half using a razor blade. Scissors were used to remove a 1-2 mm sample of cover layer from the medial portion of each vocal fold. Using a 10X magnification Selsi Loupe (model No. 415), acrylic yarn fibers were carefully removed and counted.
Results
The analysis of the data from these testing procedures focused on a few key variables. These included F0, Pon, and retest reliability for each model type and extension. Each of these variables is addressed individually below.
Fundamental Frequency (F0)
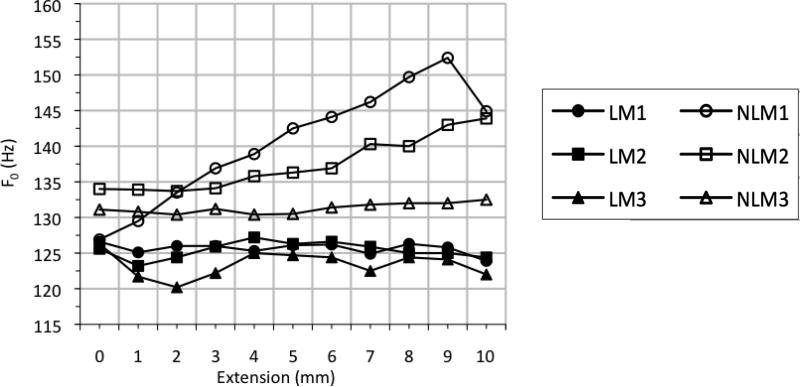
As expected from the stress-strain results (Figure 6), the three linear models produced little variation in F0 as a function of length (Figure 7). Linear model 1 (LM1) decreased slightly in F0 as length increased, exhibiting a decrease of 2.7 Hz at Pon as length increased from resting position to 10 mm extension. LM2 and LM3 fluctuated within about 4 Hz and 7 Hz, respectively, with slightly negative frequency vs. pressure slopes.
Figure 7.
Fundamental frequency (F0) vs. extension for linear vocal fold models (filled symbols) and nonlinear vocal fold models with acrylic and polyester fibers embedded into the cover layer (hollow symbols).
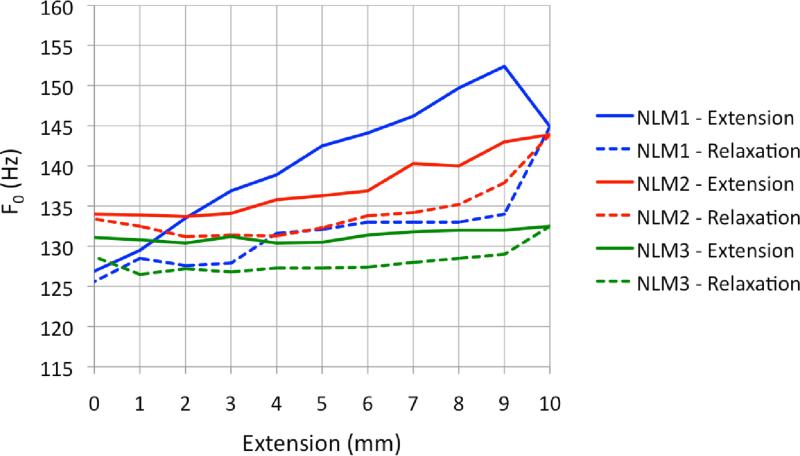
Two of the three nonlinear models, on the other hand, yielded a much more significant (and expected) pattern of F0 change. These models exhibited F0 increase as length increased. The extent of F0 change varied across the three models, with a modest overall increase in frequency between 0 mm and 9 mm extension observed for nonlinear model 3 (NLM3).
Nonlinear model 1 (NLM1) exhibited a total F0 increase at Pon of 25.5 Hz, with the largest difference occurring between 0 mm and 9 mm extension (Figure 7). NLM2 followed a similar F0 increase as the model was stretched. However, its response was not quite as dramatic as was the response of NLM1. With NLM2, the change in F0 totaled 10.2 Hz at Pon, with the largest difference occurring between +2 mm and +10 mm extensions.
As mentioned above, the final nonlinear model, NLM3, provided the most modest results of all of the fiber models. At Pon, the maximum F0 increase was 2.1 Hz, with the largest differences occurring between +2 mm and +10 mm extensions. This difference in frequency response across models suggests the possibility of mechanical differences between nonlinear models NLM1 and NLM2 and nonlinear model NLM3. This is addressed below in the discussion on fiber density.
Phonation onset pressure (Pon)
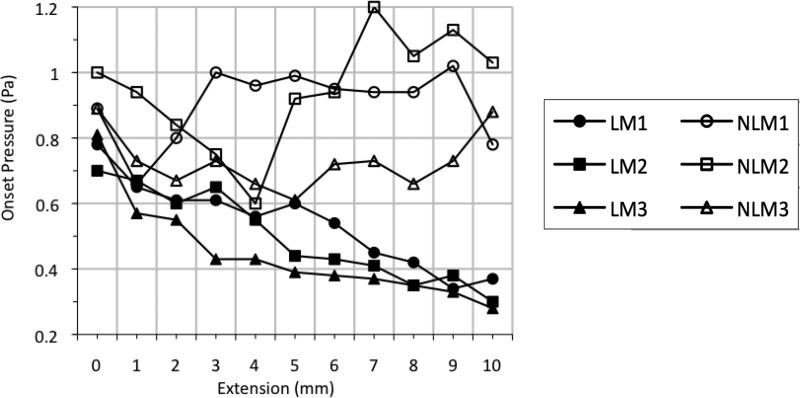
For each length tested, the onset pressure, Pon, was measured. In vivo studies conducted with human subjects have shown that phonation threshold pressure, or Pon, increases as pitch increases (Cleveland & Sundberg, 1988; Finkelhor, Titze, & Durham, 1988; Gramming, 1988; Solomon, Ramanathan, & Makashay, 2007; Titze, 1992; Verdolini-Marston, Titze, & Druker, 1990). This trend was not seen in any of the linear models. In fact, all three linear models demonstrated the opposite response, with a steady decrease in Pon as vocal fold length increased (Figure 8). At resting position, all three linear models had a Pon close to 0.80 kPa. At +10 mm extension, on the other hand, all three had a Pon of closer to 0.30 kPa, a significant decrease from its initial Pon.
Figure 8.
Onset pressures (Pon) vs. extension for linear vocal fold models (filled symbols) and nonlinear vocal fold models with acrylic and polyester fibers embedded into the cover layer (hollow symbols).
The nonlinear models followed a less predictable pattern for changes in Pon with respect to vocal fold length (Figure 8). In general, Pon was slightly higher for the three nonlinear models than for the three linear models. The lowest Pon of the nonlinear models was 0.60 kPa, which occurred at 4 mm extension for NLM2. The highest recorded Pon of any of the nonlinear models was 1.29 kPa (which was recorded with NLM2 during the relaxation phase when it was returned to its resting position, +0 mm extension). For NLM1, the mean Pon was 0.90 kPa (median = 0.94 kPa). Mean Pon for NLM2 was 0.95 kPa (median = 0.94 kPa). For NLM3, the mean Pon was 0.73 kPa (median = 0.73 kPa). These Pon measurements again suggest mechanical differences between nonlinear models NLM1 and NLM2 and nonlinear model NLM3.
High-speed imaging
The vibration pattern for one of the linear models at 0 mm extension is illustrated in Figure 4. No visible mucosal wave can be seen and significant inferior-superior motion is present. Similar observations were made using high-speed images obtained from this same linear model at 5 mm and 10 mm extensions and using images obtained from one nonlinear model.
Figure 5 illustrates increasing vocal fold length for 0 mm, 5 mm, and 10 mm extension during testing of one of the nonlinear vocal fold models. This figure also illustrates subtle changes in geometry which occurred as length increased.
Fiber density
After the frequency and Pon data were initially examined, it was hypothesized that variations in the number of acrylic fibers in each nonlinear model may have contributed to the variability in results. Polyester fibers were more consistently bundled in the weave of the fabric from which they were taken, so this density was believed to be fairly standard. Therefore, only the number of acrylic fibers embedded in each of the six individual vocal folds was counted. Samples taken from the middle of each vocal fold yielded the following results: NLM1 contained 143 acrylic fibers in one fold and 177 in the other (mean = 160). NLM2 contained 162 and 154 fibers in the two folds (mean = 158). NLM3 contained 145 and 124 (mean =134.5). These results confirm that NLM3 contained about 15% fewer acrylic fibers than models NLM1 and NLM2. It is likely that this influenced the F0 results and contributed to the variation seen across models.
Reliability and hysteresis
To check the retest reliability of the F0 response for both linear and nonlinear vocal fold models, a second set of frequency data was obtained 24 hours later following the same procedures described previously. In addition, both sets of data contained measures for both stretching and relaxation phases to determine the level of hysteresis present in the models.
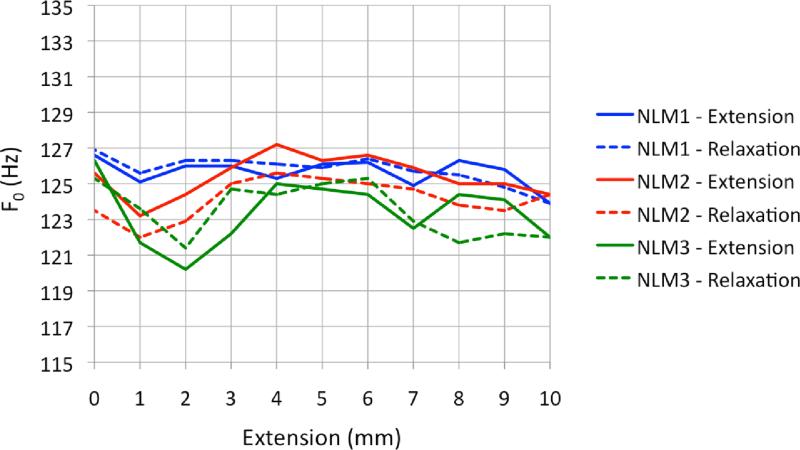
Briefly, nonlinear models demonstrated hysteresis during relaxation testing (see Figure 9). However, linear models did not demonstrate consistent or conclusive evidence of hysteresis during relaxation testing (see Figure 10). In both linear and nonlinear models, the overall pattern of F0 response remained unchanged during 24-hour reliability retesting. The range of F0 response, on the other hand, was significantly reduced in NLM1 and NLM2. More detailed results from the 24-hour retest can be found can be found in Shaw (2010).
Figure 9.
F0 with respect to length for extension and relaxation phases for nonlinear models. Evidence of hysteresis (differences between F0 during the extension phase and F0 during the relaxation phase) can be seen.
Figure 10.
F0 with respect to length for extension and relaxation phases for linear models. No clear evidence of hysteresis can be seen, as differences between F0 during the extension phase and F0 during the relaxation phase are inconsistent. (Note difference in scale for F0 from Figure 9)
Discussion
Synthetic vocal fold modeling has gained increasing attention in voice research over the past several years. The primary goals of the current study were to develop a synthetic model of the vocal folds with nonlinear material properties and to determine its effect on frequency response. These models do not aim to reproduce the fine structure of the vocal folds, but rather to mimic the nonlinear tissue properties of the human vocal folds through the use of embedded fibers.
As described and illustrated above, there were many differences between the responses of the linear and nonlinear models used in this study. A difference in F0 response as the models were stretched was anticipated due to the effect of linear vs. nonlinear material stress-strain properties. These anticipated differences were indeed observed in this study, with minimal changes in F0 for increasing length with the linear models and with more significant increases in F0 for increasing length with two out of the three nonlinear models tested.
Direct measurements of vocal fold length with respect to F0 have been limited due to difficulties accessing and visualizing the vocal folds during phonation, especially in vivo. Hollien (1960) conducted a study to address this question by using a laryngeal mirror to visualize the vocal folds during phonation and a motion picture camera to capture the images for later analysis. He attempted to adjust the data for lens-to-fold distance by taking x-rays during each testing condition to determine the lens-to-fold distance. Using this method, Hollien was able to demonstrate that vocal fold length does appear to increase with increasing F0 (with an average of 37% increase in vocal fold length [range = 11-62%]).
On the other hand, research conducted by Doellinger and Berry (2006) using an excised human hemilarynx did not demonstrate a significant increase in F0 with increasing vocal fold length. However, this study utilized only two weights to induce vocal fold elongation (10 g and 20 g) which resulted in an average maximum displacement of 2.05 mm (± 0.17) across 18 trials.
The findings from Hollien's early study have been augmented by more recent research conducted by Schuberth and colleagues (2002), who found that increased glottal length during phonation was associated with increased F0.
Also, Titze and colleages (1988; 1997), demonstrated an increase in vocal fold length on the order of 30-45% following CT activation (via direct stimulation of the external branch of the superior laryngeal nerve [SLN]) in in vivo canine larynges. Around this same time, Roubeau and colleagues (1997), demonstrated that the CT muscle is most active during increasing F0. Using percutaneous, hooked-wire electrodes, they were able to obtain EMG measurements of strap and CT muscle activity during pitch glides in one untrained male and one untrained female participant. This study demonstrated that the CT muscle is increasingly active as F0 increases for both male and female voices.
Since these models did not simulate TA muscle activation, the increasing F0 seen with increasing length is likely due to the stress-strain properties of the human vocal folds (Gray et al., 2000; Hirano & Ohala, 1969; Hollien, 1960; Hollien & Moore, 1960; Roubeau et al., 1997; Titze et al., 1988; Titze et al., 1997). In light of these previous findings, F0 results for the nonlinear models appear more representative of true human vocal fold response than those obtained with the linear models. For the nonlinear models, the mechanism for F0 increase with increasing length is likely due to the stretching of a model increasing the model stiffness, resulting in a higher frequency vibration.
In addition to a difference in frequency response between linear and nonlinear models, the measured Pon data for differing model lengths were significantly influenced by the linearity of the material properties. Linear models demonstrated a progressive decrease in Pon for increasing lengths while nonlinear models showed a more varied and somewhat higher average Pon. Previous studies suggest that in the human voice, phonation threshold pressure (equivalent to Pon in the present study) increases steadily with increasing F0 (Cleveland & Sundberg, 1988; Solomon et al., 2007; Titze, 1994). This typical increase in Pon with increasing F0 is likely related to an increase in vocal fold tension, which increases both Pon and F0. Antagonistic TA muscle activity does influence cross-sectional area as well as vocal fold tension, and is therefore likely to further influence PTP, although this exact relationship is not fully understood (Solomon et al., 2007).
It is unclear why this pattern of increasing Pon with increasing length was not seen with any of the models used in the current study, especially with the nonlinear models. However, the higher Pon seen with the nonlinear models is likely due to increased stiffness caused by the presence of fibers within the cover layer, even without extension or increased vocal fold tension.
Nonlinear vocal folds, on the other hand, did demonstrate evidence of hysteresis during relaxation data collection, while linear models did not. Hysteresis has likewise been observed with human vocal fold tissues and excised larynges (Chan, Fu, Young, & Tirunagari, 2007; Gray et al., 2000; Hunter & Titze, 2007; Min, Titze, & Alipour-Haghighi, 1995; Plant, Freed, & Plant, 2004). In this regard, nonlinear models more accurately represented true human vocal folds than did linear vocal fold models. As was stated previously, there is a possibility that the fibers embedded within the nonlinear vocal fold models did not hold up under the higher levels of strain used in testing. Therefore, it is possible that the hysteresis seen during the relaxation phase of nonlinear vocal fold testing was really a result of the changes in fiber positioning within the vocal folds as a result of fibers coming unglued during testing. Further research would be needed to determine if this was truly the case.
Retest results demonstrated a more reliable and repeatable F0 response from the linear models than the nonlinear models. This is most likely due to the fact that the fibers embedded in the nonlinear models did not hold up well under the 10 mm strain. It is likely that the fibers began to pull out of the glue or break after a single set of testing at high strains. This is not anticipated to be a concern in future studies with synthetic vocal fold models, since most tests will not include such extreme strains.
One rather unexpected result was that the F0 responses of the nonlinear vocal folds were not consistent across the three models tested. There are several possible explanations for this. One is that each model may have contained more or fewer fibers than the others, since it was difficult to control the exact number of strands contained in each, especially with the acrylic fibers. This was found to be the case upon visual examination that showed that NLM3 contained fewer fibers (about 15% fewer) than either of nonlinear models NLM1 and NLM2.
Another potentially significant factor relates to how well the glue was able to cure and hold together under the stretching forces. Several early models used during preliminary testing came unglued, possibly due to the presence of air bubbles in the source glue, or to bubbles that became embedded in the glue during the fabrication process. In preliminary models at the early stages of model development, this occasional poor adhesion sometimes caused the fibers themselves, or even the actual vocal folds, to detach from the plates, resulting in reduced tension and a diminished effect of the fibers on the model's response. Many of these problems were resolved during model development and prior to data collection, but it is possible that some of these material characteristics may have come into play during testing as well.
In addition, the amount of pre-strain placed on the fibers during fiber layer construction was not closely monitored. This also may have influenced the amount of tension present in each set of vocal folds used for testing.
Additional factors could have further influenced Pon measurements. One such factor has to do with vocal fold adduction. Following each extension, vocal folds were re-adducted to ensure complete glottal closure prior to testing. However, contact pressures between the models were not closely monitored. Rather, adduction was considered adequate once vocal folds were visibly touching. It is possible then that variations in contact pressure could have affected Pon results.
It is also important to note that the vibration pattern seen with these synthetic vocal fold models (see Figure 4) differed from true human vocal fold vibration. First of all, no mucosal wave was present for either linear or nonlinear models (Drechsel & Thomson, 2008; Jiang & Titze, 1993; Pickup & Thomson, 2010). Secondly, inferior-superior motion of the synthetic models appeared greater than what is typically observed during human vocal fold vibration (Boessenecker, Berry, Lohscheller, Eysholdt, & Doellinger, 2007; Doellinger & Berry, 2006; Pickup & Thomson, 2010; Rasp, Lohscheller, Doellinger, Eysholdt, & Hoppe, 2006), although somewhat less extensive for nonlinear vs. linear models. No quantitative measures were made of vibration pattern during this study. Further testing would be needed to corroborate these visual impressions.
While differences in vibration pattern have been a drawback to the use of synthetic vocal fold models in this and other research studies, recently-developed multi-layer models, with a thin epithelium and a very pliable layer representing the superficial lamina propria, have been shown to exhibit reduced inferior-superior displacement and clear mucosal wave-like motion (Murray & Thomson, in press). Combining such advances with the concepts introduced in the paper, namely the use of nonlinear material properties, would provide an even more accurate model for future studies. Research into improving the vibration patterns and frequency response of synthetic vocal fold models is currently ongoing.
Conclusions
This current study sought to create a nonlinear synthetic vocal fold model which would more realistically represent human vocal folds for research purposes. The F0 response of these nonlinear synthetic vocal folds was compared with that of similar linear vocal fold models to determine the effect of nonlinear material properties on F0 response and onset pressure (Pon)
Notable differences were found between synthetic models with linear and nonlinear material properties. In particular, F0 vs. elongation and Pon vs. elongation responses varied significantly between the two types of models. Nonlinear models more accurately represented human F0 changes with length than did the linear models.
Further research appears warranted to simulate the effects of active tensioning within the human vocal folds, taking into account antagonistic TA and CT muscle activation, and its impact on F0 response and Pon. In addition, more realistic synthetic vocal fold models are needed which take into account the nonlinear tissue properties of the human vocal folds, as well as more realistic geometry.
This present study provides a preliminary foundation for future voice research using nonlinear silicone vocal fold models to study a variety of physical phenomena associated with flow-induced vibration and changes associated with length and tension adjustments.
Acknowledgements
This research was supported by NIH Grant R01DC005788 and constituted the first author's Master's Thesis in the Department of Communication Disorders at Brigham Young University. Portions of this research were presented at the Acoustical Society of America Conference held October 26-30, 2009 in San Antonio, TX; at the American Speech-Language-Hearing Association Conference held November 18-20, 2010 in Philadelphia, PA; and at the Rehabilitation Sciences Sector Clinical Education and Research Day Conference held at the University of Toronto on May 11, 2011.
Contributor Information
Stephanie M. Shaw, Department of Communication Disorders, Brigham Young University Department of Speech-Language Pathology at the University of Toronto..
Scott L. Thomson, Department of Mechanical Engineering, Brigham Young University
Christopher Dromey, Department of Communication Disorders, Brigham Young University.
Simeon Smith, Department of Mechanical Engineering, Brigham Young University.
References
- Becker S, Kniesburges S, Muller S, Delgado A, Link G, Kaltenbacher M, et al. Flow-structure-acoustic interaction in a human voice model. Journal of the Acoustical Society of America. 2009;125(3):1351–1361. doi: 10.1121/1.3068444. doi: 10.1121/1.3068444. [DOI] [PubMed] [Google Scholar]
- Boessenecker A, Berry DA, Lohscheller J, Eysholdt U, Doellinger M. Mucosal wave properties of a human vocal fold. Acta Acustica United with Acustica. 2007;93(5):815–823. [Google Scholar]
- Case JL. Clinical management of voice disorders. 4th ed. ProEd; Austin, TX: 2002. [Google Scholar]
- Chan RW, Fu M, Young L, Tirunagari N. Relative contributions of collagen and elastin to elasticity of the vocal fold under tension. Annals of Biomedical Engineering. 2007;35(8):1471–1483. doi: 10.1007/s10439-007-9314-x. doi: 10.1007/s10439-007-9314-x. [DOI] [PubMed] [Google Scholar]
- Chan RW, Titze IR, Titze MR. Further studies of phonation threshold pressure in a physical model of the vocal fold mucosa. Journal of the Acoustical Society of America. 1997;101(6):3722–3727. doi: 10.1121/1.418331. doi: 10.1121/1.418331. [DOI] [PubMed] [Google Scholar]
- Cleveland T, Sundberg J. Paper presented at the Stockholm Music Acoustics Conference. Royal Swedish Academy of Music; Stockholm: 1988. Acoustic analysis of three male voices of different quality. [Google Scholar]
- Doellinger M, Berry DA. Visualization and quantification of the medial surface dynamics of an excised human vocal fold during phonation. Journal of Voice. 2006;20(3):401–413. doi: 10.1016/j.jvoice.2005.08.003. doi: 10.1016/j.jvoice.2005.08.003. [DOI] [PubMed] [Google Scholar]
- Drechsel JS, Thomson SL. Influence of supraglottal structures on the glottal jet exiting a two-layer synthetic, self-oscillating vocal fold model. Journal of the Acoustical Society of America. 2008;123(6):4434–4445. doi: 10.1121/1.2897040. doi: 10.1121/1.2897040. [DOI] [PMC free article] [PubMed] [Google Scholar]
- Finkelhor BK, Titze IR, Durham PL. The effect of viscosity changes in the vocal folds on range of oscillation. Journal of Voice. 1988;1(4):320–325. doi: 10.1016/S0892-1997(88)80005-5. [Google Scholar]
- Gramming P. Dissertation. University of Lund; Malmö, Sweden: 1988. The phonetogram: An experimental and clinical study. [Google Scholar]
- Gray SD, Alipour F, Titze IR, Hammond TH. Biomechanical and histologic observations of vocal fold fibrous proteins. Annals of Otology, Rhinology, & Laryngology. 2000;109(1):77–85. doi: 10.1177/000348940010900115. [DOI] [PubMed] [Google Scholar]
- Gray SD, Hirano M, Sato K. Molecular and cellular structure of vocal fold tissue. In: Titze IR, editor. Vocal fold physiology: Frontiers in basic science. Singular Publishing Group; San Diego, CA: 1993. pp. 1–36. [Google Scholar]
- Hirano M, Kakita Y. Cover-body theory of vocal fold vibration. In: Daniloff RG, editor. Speech science: Recent advances. College-Hill Press; San Diego, CA: 1985. pp. 1–46. [Google Scholar]
- Hirano M, Ohala J. Use of hooked-wire electrodes for electromyography of the intrinsic laryngeal muscles. Journal of Speech and Hearing Research. 1969;12(2):362–373. doi: 10.1044/jshr.1202.362. [DOI] [PubMed] [Google Scholar]
- Hollien H. Vocal pitch variation related to changes in vocal fold length. Journal of Speech and Hearing Research. 1960;3(2):150–156. [Google Scholar]
- Hollien H, Moore GP. Measurements of the vocal folds during changes in pitch. Journal of Speech and Hearing Research. 1960;3(2):157–165. [Google Scholar]
- Hunter EJ, Titze IR. Refinements in modeling the passive properties of laryngeal soft tissue. Journal of Applied Physiology. 2007;103(1):206–219. doi: 10.1152/japplphysiol.00892.2006. doi: 10.1152/japplphysiol.00892.2006. [DOI] [PubMed] [Google Scholar]
- Jiang JJ, Titze IR. A methadological study of hemilaryngeal phonation. Laryngoscope. 1993;103:872–882. doi: 10.1288/00005537-199308000-00008. doi: 10.1288/00005537-199308000-00008. [DOI] [PubMed] [Google Scholar]
- Kniesburges S, Thomson SL, Barney A, Triep M, Šidlof P, Horáček J, et al. In vitro experimental investigation of voice production. Current Bioinformatics. 2011;6(3):305–322. doi: 10.2174/157489311796904637. [DOI] [PMC free article] [PubMed] [Google Scholar]
- Lofqvist A, Baer T, McGarr NS, Story RS. The cricothyroid muscle in voicing control. Journal of the Acoustical Society of America. 1989;85(3):1314–1321. doi: 10.1121/1.397462. doi: 10.1121/1.397462. [DOI] [PubMed] [Google Scholar]
- Min YB, Titze IR, Alipour-Haghighi F. Stress-strain response of the human vocal ligament. Annals of Otology, Rhinology, & Laryngology. 1995;104(7):563–569. doi: 10.1177/000348949510400711. [DOI] [PubMed] [Google Scholar]
- Murray PR, Thomson SL. Synthetic, multi-layer, self-oscillating vocal fold model fabrication. Journal of Visualized Experiments. doi: 10.3791/3498. (in press) [DOI] [PMC free article] [PubMed] [Google Scholar]
- Paget R. Human speech. Harcourt, Brace; New York: 1930. [Google Scholar]
- Pickup BA, Thomson SL. Influence of asymmetric stiffness on the structural and aerodynamic response of synthetic vocal fold models. Journal of Biomechanics. 2009;42:2219–2225. doi: 10.1016/j.jbiomech.2009.06.039. doi: 10.1016/j.jbiomech.2009.06.039. [DOI] [PMC free article] [PubMed] [Google Scholar]
- Pickup BA, Thomson SL. Flow-induced vibratory response of idealized versus magnetic resonance imaging-based synthetic vocal fold models. Journal of the Acoustical Society of America. EL124–EL129. 2010;128(3) doi: 10.1121/1.3455876. doi: 10.1121/1.3455876. [DOI] [PMC free article] [PubMed] [Google Scholar]
- Pickup BA, Thomson SL. Identification of geometric parameters influencing the flow-induced vibration of a two-layer self-oscillating computational vocal fold model. Journal of the Acoustical Society of America. 2011;129(4):2121–2132. doi: 10.1121/1.3557046. doi: 10.1121/1.3557046. [DOI] [PMC free article] [PubMed] [Google Scholar]
- Plant RL, Freed GL, Plant RE. Direct measurement of onset and offset phonation threshold pressure in normal subjects. Journal of the Acoustical Society of America. 2004;116(6):3640–3646. doi: 10.1121/1.1812309. doi: 10.1121/1.1812309. [DOI] [PubMed] [Google Scholar]
- Rasp O, Lohscheller J, Doellinger M, Eysholdt U, Hoppe U. The pitch rise paradigm: A new task for real-time endoscopy of non-stationary phonation. Folia Phoniatrica et Logopaedica. 2006;58(3):175–185. doi: 10.1159/000091731. [DOI] [PubMed] [Google Scholar]
- Riede T, Tokuda IT, Munger JB, Thomson SL. Mammalian laryngeal air sacs add variability to the vocal tract impedence: Physical and computational modeling. Journal of the Acoustical Society of America. 2008;124(1):634–647. doi: 10.1121/1.2924125. doi: 10.1121/1.2924125. [DOI] [PMC free article] [PubMed] [Google Scholar]
- Roubeau B, Chevrie-Muller C, Lacau Saint Guily J. Electromyographic activity of strap and cricothyroid muscles in pitch change. Acta Oto-laryngolica. 1997;117(3):459–464. doi: 10.3109/00016489709113421. [DOI] [PubMed] [Google Scholar]
- Scherer RC, Shinwari D, De Witt KJ, Zhang C, Kucinschi BR, Afjeh AA. Intraglottal pressure profiles for a symmetric and oblique glottis with a divergence angle of 10 degrees. Journal of the Acoustical Society of America. 2001;109(4):1616–1630. doi: 10.1121/1.1333420. doi: 10.1121/1.1333420. [DOI] [PubMed] [Google Scholar]
- Schuberth S, Hoppe U, Döllinger M, Lohscheller J, Eysholdt U. High-precision measurement of the vocal fold length and vibratory amplitudes. Laryngoscope. 2002;112(6):1043–1049. doi: 10.1097/00005537-200206000-00020. doi: 10.1097/00005537-200206000-00020. [DOI] [PubMed] [Google Scholar]
- Shaw SM. Unpublished master's thesis. Brigham Young University; Provo, UT.: 2010. Frequency response of synthetic vocal fold models with linear and nonlinear material properties. [DOI] [PMC free article] [PubMed] [Google Scholar]
- Solomon NP, Ramanathan P, Makashay MJ. Phonation threshold pressure across pitch and range: Preliminary test of a model. Journal of Voice. 2007;21(5):541–550. doi: 10.1016/j.jvoice.2006.04.002. doi: 10.1016/j.jvoice.2006.04.002. [DOI] [PubMed] [Google Scholar]
- Thomson SL, Mongeau L, Frankel SH. Aerodynamic transfer of energy to the vocal folds. Journal of the Acoustical Society of America. 2005;118(3 Pt 1):1689–1700. doi: 10.1121/1.2000787. doi: 10.1121/1.2000787. [DOI] [PubMed] [Google Scholar]
- Titze IR. Phonation threshold pressure: A missing link in glottal aerodynamics. Journal of the Acoustical Society of America. 1992;91(5):2926–2935. doi: 10.1121/1.402928. doi: 10.1121/1.402928. [DOI] [PubMed] [Google Scholar]
- Titze IR. Principles of voice production. Prentice Hall; Englewood Cliffs, N.J.: 1994. [Google Scholar]
- Titze IR, Jiang J, Drucker DG. Preliminaries to the body-cover theory of pitch control. Journal of Voice. 1988;1(4):314–319. doi: 10.1016/s0892-1997(88)80004-3. [Google Scholar]
- Titze IR, Jiang JJ, Lin E. The dynamics of length change in canine vocal folds. Journal of Voice. 1997;11(3):267–276. doi: 10.1016/s0892-1997(97)80004-5. doi: 10.1016/s0892-1997(97)80004-5. [DOI] [PubMed] [Google Scholar]
- Verdolini-Marston K, Titze IR, Druker DG. Changes in phonation threshold pressure with induced conditions of hydration. Journal of Voice. 1990;4(2):142–151. doi: 10.1016/S0892-1997(05)80139-0. [Google Scholar]
- Zemlin WR. Speech and hearing science: Anatomy and physiology. 4th ed. Boston Allyn and Bacon: 1998. [Google Scholar]
- Zhang Z. Vibration in a self-oscillating vocal fold model with left-right asymmetry in body-layer stiffness. Journal of the Acoustical Society of America. 2010;128(5):EL279–285. doi: 10.1121/1.3492798. doi: 10.1121/1.3492798. [DOI] [PMC free article] [PubMed] [Google Scholar]
- Zhang Z, Neubauer J, Berry DA. Aerodynamically and acoustically driven modes of vibration in a physical model of the vocal folds. Journal of the Acoustical Society of America. 2006a;120(5 Pt 1):2841–2849. doi: 10.1121/1.2354025. doi: 10.1121/1.2354025. [DOI] [PubMed] [Google Scholar]
- Zhang Z, Neubauer J, Berry DA. The influence of subglottal acoustics on laboratory models of phonation. Journal of the Acoustical Society of America. 2006b;120(3):1558–1569. doi: 10.1121/1.2225682. doi: 10.1121/1.2225682. [DOI] [PubMed] [Google Scholar]


