Abstract
Here we evaluated a series of Si-derivatized rhodamine (SiR) dyes for their ability to visualize a model drug in live cells. We show that a charge neutral SiR derivative (but not others) can indeed be used to follow the intracellular location of the model therapeutic drug in GFP cells
There is a growing need for small footprint, cell membrane permeable fluorochromes for cellular and subcellular imaging in live cells and in vivo. Such molecules would find particular application for tagging small molecule therapeutic drugs to image their distribution (pharmacokinetics; PKs) as well as their action (pharmacodynamics; PDs). The simplest way to accomplish this is by conjugating a therapeutic drug of interest with bright fluorochromes that possess the desired emission wavelength. Contrary to popular belief, the fluorochrome partners are often not simply an inert color tag, but instead are capable of interacting with biological molecules on their own1, thus potentially re-directing drug-fluorochrome conjugates to undesired cellular sub-compartments. In the past, fluorochrome addition has been successfully done with BODIPY-FL2,3, or fluorescein diacetate (FDA)4. These green fluorochromes have good cell permeation properties and are < 500 dalton MW. Unfortunately, the green emission spectrum overlaps with that of Green Fluorescent Protein (GFP), which is often used in genetically engineered cells as a genetic co-read out. We have thus become interested in evaluating red-shifted fluorochromes that could be readily used instead. Many commercially available fluorochromes including BODIPY-red, texas red (TR), tetramethyrhodamine (TMR), Cy3, and Cy5 are often cell membrane impermeable in live cells, thus requiring the use of either fixed cells or permeabilization protocols which can disturb the cellular milieu. The recent observation that the replacement of oxygen with a silicon atom in the rhodamine framework produces a strong Near Infrared (NIR)-emission fluorophore5,6 has led to interesting compounds with the potential for cellular imaging7. Some prior work has been done utilizing SiR-derivatives for imaging. Previous studies have focused on SiR-derivatives for applications such as protein or ligand tagging6, but using these fluorochromes for live cell imaging of fluorochrome-drug conjugates have been relatively unexplored. The goal of the current study was to test a number of SiR fluorochrome-drug conjugates for use in live cell imaging.
As a model system we chose to derivatize the PARP-1/2 inhibitor, Olaparib (AZD2281)8, with different SiR dyes, since the former had previously been shown to localize to the nucleus where it binds to PARPs at nanomolar affinity, thus resulting in a unique cellular phenotype9 in a well validated model system2,10. We were particularly interested in testing linker length and charge variables on cellular imaging characteristics. We found that certain SiR conjugates indeed have favorable imaging characteristics while others show high tropism for mitochondria, irrespective of the targeting ligand. The choice of spacer and charge are thus essential in designing ideal companion imaging drugs (CID) for live cell imaging.
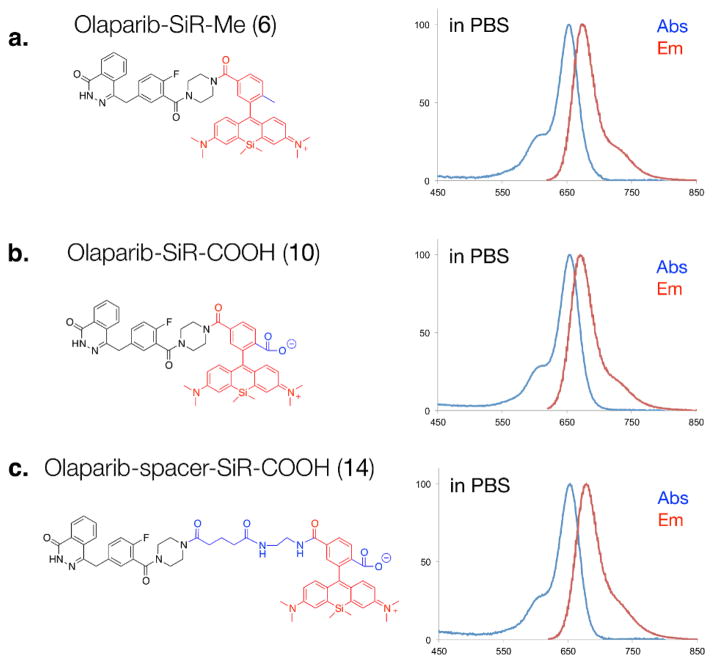
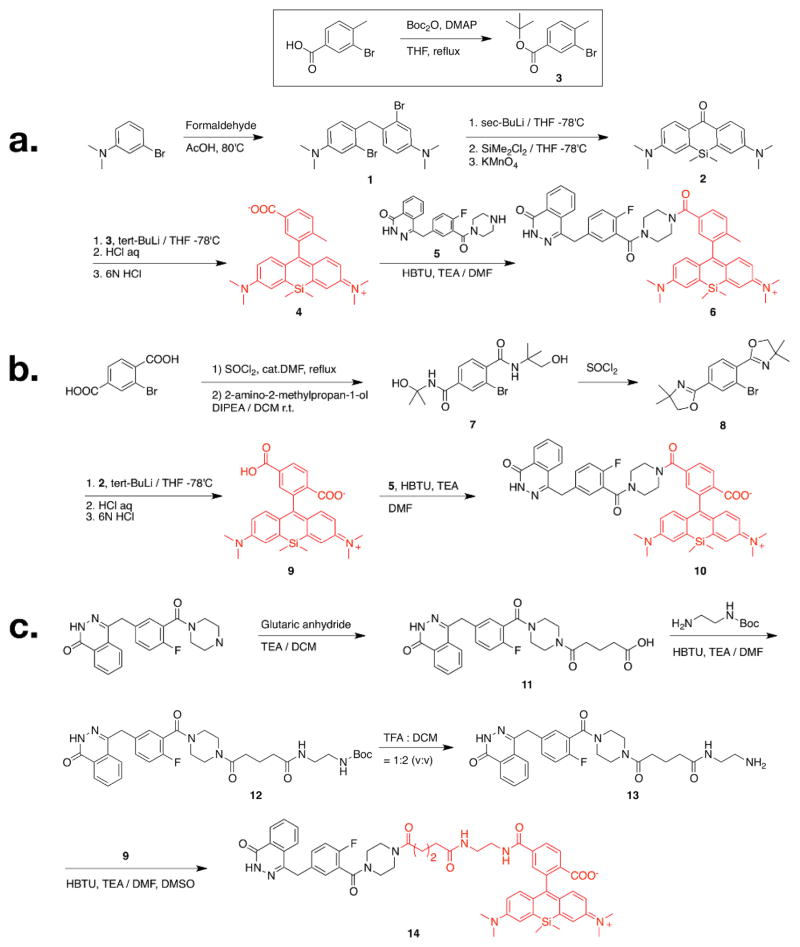
To determine the effects of charge and spacer on single cell uptake and distribution, we designed three different SiR-Olaparib conjugates (Fig. 1). We chose two different versions of SiR fluorochromes, SiR-Me (4) and SiR-COOH (9)5,6. Starting with the 3-bromoaniline, 2 was synthesized by a facile one-pot synthesis process, lithiation, silylanization and oxidation of 1 (Scheme 1). The reaction of 2 with lithiated 3 or 8, followed by acidic deprotection resulted in the desired SiR-Me (4) or SiR-COOH (9). Based on previous analysis of the PARP1 crystal structure with an inhibitor bound2, we conjugated the SiR-Me (4) and SiR-COOH (9) directly to the piperazine functional group of an amine version of Olaparib (58), which resulted in 6 and 10. To address the effect of the spacer on the PK of our CID, we also synthesized 13, which was conjugated with SiR-COOH (9) to generate 14. Absorption and emission spectra of SiR-Me (4), SiR-COOH (9), and the CIDs (6, 10 and 14) were measured in 1X PBS (with 0.1% DMSO). All compounds had similar absorption and emission profiles (Table 1 and Fig. S1, ESI†) around 650 and 675 nm (ex/em).
Fig. 1.
Three different SiR-based companion imaging drugs, (a) Olaparib-SiR-Me (6), (b) Olaparib-SiR-COOH (10) and (c) Olaparib-spacer-SiR-COOH (14) with absorption and emission spectra in PBS.
Scheme 1.
Synthetic scheme of A) Olaparib-SiR-Me (6), B) Olaparib-SiR-COOH (10) and C) Olaparib-spacer-SiR-COOH (14). Boc = tert-Butyloxycarbonyl; THF = tetrahydrofuran; HBTU = O-(Benzotriazol-1-yl)-N,N,N′,N′-tetramethyluronium hexafluorophosphate; TEA = triethylamine; DMF = dimethylformamide; DIPEA = diisopropylethylamine; TFA = trifluoroacetic acid; DCM = dichloromethane; DMSO = dimethyl sulfoxide.
Table 1.
Summary of SiR based companion imaging drug with Olaparib.
| Compound | # | MW | ClogP | Charge (pH 7.0) | Abs (nm) | Em (nm) | IC50 (nM) | Live Cell permeability |
|---|---|---|---|---|---|---|---|---|
| SiR-Me | 4 | 443.63 | −0.13 | 0 | 649 | 672 | NA | Yes |
| SiR-COOH | 9 | 473.62 | −0.88 | −1 | 645 | 676 | NA | No |
|
| ||||||||
| Olaparib-SiR-Me | 6 | 792.01 | 4.23 | +1 | 653 | 675 | 99.2±9.8 | Yes |
| Olaparib-SiR-COOH | 10 | 821.99 | 3.74 | 0 | 653 | 670 | 100.3±9.8 | Yes |
| Olaparib-spacer-SiR-COOH | 14 | 978.17 | 3.59 | 0 | 653 | 678 | 112.9±9.6 | Yes |
|
| ||||||||
| Olaparib[8] | 434.46 | 1.24 | 0 | NA | NA | 5 | Yes | |
| Olaparib-BODIPY-FL[2] | 640.46 | 4.8 | 0 | 507 | 525 | 12.2±1.1 | Yes | |
| Olaparib-TCO/Tz-TR[13] | 1535.6 | 5.15 | −1 | 595 | 615 | 15.4±1.2 | No | |
To determine the effect of SiR modification on target binding of Olaparib, depending on the charge and linker length, the half-maximal inhibitory concentration (IC50) of the three different CIDs (6, 10 and 14) were measured against recombinant human PARP1 (Fig. S2, ESI†). Interestingly, all of the conjugates exhibited the same degree of reduction in inhibition efficacy against purified enzyme. For instance, the IC50 value of 6, 10 and 14 against PARP1 was 99.2, 100.3 and 112.9 nM, respectively, which is marginally higher than that of Olaparib but still in nanomolar range (Table 1). Therefore, SiR modification did not abrogate the inhibitory effect of the original compound.
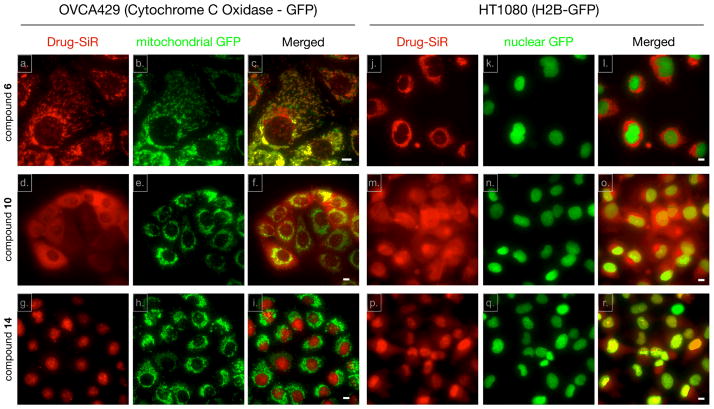
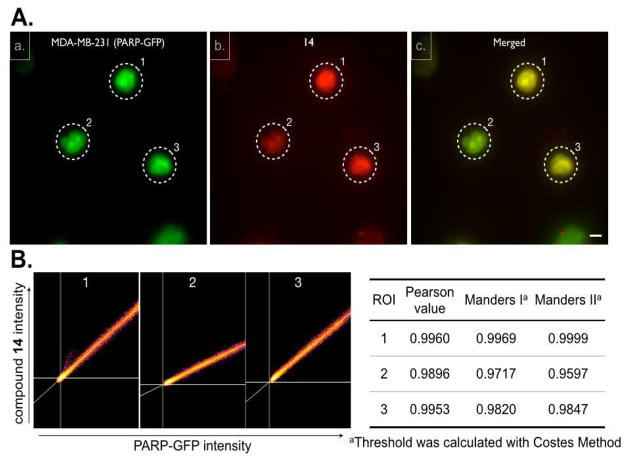
We next set out to determine whether the Olaparib SiR conjugates i) are cell membrane permeable, ii) are localized to the nucleus, the main site of PARP1 expression11 and iii) colocalize with PARP1. We chose three different GFP expressing cell lines: HT1080 cells expressing GFP-H2B12 to delineate the nucleus, OVCA429 cells expressing GFP-Cytochrome C Oxidase (GFP-Mito) to stain mitochondria and MDA-MB-231 cells stably expressing PARP1-GFP13 (ESI†). For live cell imaging, cells were seeded on a 96 well plate and were incubated with fluorochrome or CIDs for 30 minutes, washed briefly three times with culture media for 3 min each, and imaged in a humidified environmental chamber of a DeltaVision microscope using a 40X objective. We first tested the cationic 6, which was cell permeable. Interestingly, the CID uniquely distributed to mitochondria with co-localization in GFP-Mito OVCA429 cells (Fig. 2a, b and c, Fig. S3, ESI†), i.e. a distribution that was strongly reminiscent of other cationic dyes such as mitotrackers14 or rhodamine 12315. In contrast, SiR-Me (4) did not show a mitochondrial-staining pattern (Fig. S4, ESI†). Interestingly, a fluorochrome having similar chemical structure to that of 4, except for an additional carboxylic acid group on the fluorochrome, also localized to the mitochondria in a previous report5. Based on the above observation, changing the methyl substituent to a carboxylic group resulted in a completely different staining pattern in the cells. 10 displays more ubiquitous cytoplasmic staining in both GFP expressing cell lines (Fig. 2d, e and f for GFP-Mito cells, Fig. 2m, n and o for GFP-H2B cells). Because the COOH-SiR fluorochrome (9; net charge = −1) did not show any fluorescent signal or nonspecific binding (Fig. S4, ESI†), we concluded that the negatively charged SiR is not cell permeable. The original purpose of a short chemical spacer between Olaparib and the SiR-COOH fluorochrome (14) was to minimize the steric hindrance of the fluorochrome modification and to rescue the original binding event between Olaparib and PARP. However there was negligible difference of IC50 between compound 10 and 14. To our surprise however, compared to the in vitro enzyme assay result, incorporation of this small spacer dramatically reconstituted target binding. As shown in Fig. 2, there was excellent localization in the nucleus as well as distinct nucleolar staining, the known localization pattern of PARP 19, in both GFP-mito and GFP-H2B cell lines (Fig. 2g, h and i for GFP-Mito cells, and Fig. 2p, q and r for GFP-H2B cells). This result suggests that there is different PK behavior of the CID at the single cell level compared to the in vitro condition. A possible scenario here is that the short aliphatic chemical spacer increases the hydrophobicity of the CID (compound 14) and improves nuclear permeability of the compound. To further confirm 14 binding to the original target PARP1, we used MDA-MB-231 cells stably expressing PARP1-GFP (Fig. 3A) to show there was a high degree of colocalization between 14 and PARP-GFP (Pearson value was 0.9948 and Manders I and II values were 0.9408 and 0.9149 respectively.16 Fig. 3B, ESI†). In addition, competition imaging experiment between Olaparib and compound 14 further confirmed target binding of compound 14 to target PARP protein (Fig. S5, ESI†). Collectively, Olaparib modification with COOH-SiR with the chemical spacer allowed us to utilize a unique NIR CID for PARP. Overall, this implies that the zwitterionic SiR-COOH compound with an appropriate linker is a promising fluorochrome for novel CIDs for PK and PD studies in live cells.
Fig. 2.
Live cell staining pattern of the three different companion imaging drugs in green fluorescence protein (GFP) cell lines. Both OVCA429 (expressing Cytochrome C Oxidase fused to GFP; a–c, d–f and g–i) and HT1080 (expressing H2B fused to GFP; j–l, m–o and p–r) cells were treated with 10 μM 6 (a–c and j–l), 10 (d–f and m–o) and 14 (g–I and p–r) for 30 minutes. After washing with growth media three times for 3 minutes each, live cell images were acquired using a DeltaVision fluorescence microscope equipped with a 40X objective. Scale bar: 10μm.
Fig. 3.
Colocalization of 14 with PARP1. A) Live cell imaging of MDA-MB-231 cells (expressing PARP1 fused to GFP) with 10 μM 14. a) PARP1-GFP cellular localization, b) 14, c) merged image showing colocalization between PARP1-GFP and 14. Scale bar: 10 μm. B) Colocalization scatter plot of representative cell (dotted circle) and table of Pearson and Manders correlation coefficients.
We show that SiR fluorochromes and the PARPi (Olaparib) derivatives are cell membrane permeable in OVCA429 (ovarian cancer), HT1080 (fibrosarcoma) and MDA-MB-231 (breast cancer) cells. The finding of cell membrane permeation is important because many other red fluorochromes (TMR, TR) and their small molecule conjugates fail to distribute ubiquitously throughout mammalian cells and/or are shuttled into unique vesicular structures potentially avoiding their intended targets. SiR fluorochromes also have a number of other advantages such as a relatively small size, bright fluorescence, high water solubility, good photostability, are excellent for nanoscopic optical microscopy (STED or GSDIM/STORM) and have a reasonable cLogP (Table 1). An unexpected finding in our study was the fact that relatively minor molecular modifications resulted in very different cellular phenotypes of drug accumulation. Direct conjugation of the SiR-Me to Olaparib showed unique mitochondrial localization, similar to Mito-tracker or GFP labeled mitochondria We attribute this to the positive charge, an observation that has in retrospect also been made for other fluorochromes (such as rhodamine 123). In contradistinction and support of this observation, elimination of the charge by carboxylation, abrogated the mitochondrial phenotype and the drug fluorochrome conjugate showed a ubiquitous cellular distribution. Finally, introduction of a small spacer further improved cellular distribution and presumably target binding, as shown by co-localization and affinity studies with the Olaparib-conjugated CID and PARP1.
The current study focused on the PARP inhibitor Olaparib as a proof-of-principle of cellular nuclear targeting. However, we envision similar strategies to be applicable the growing number of kinase inhibitors and other small molecule drugs. Such labeled companion imaging drugs are expected to be valuable compounds for imaging pharmacokinetics and pharmacodynamics at the single cell level in vivo3.
Supplementary Material
Acknowledgments
We thank Jenna Klubnick for synthesis of 4-(4-fluoro-3-(piperazine-1-carbonyl)benzyl)phthalazin-1(2H)-one and Alex Zaltsman for assistance in imaging. This work was supported in part by the National Institutes of Health (NIH) grants 1R01CA164448, P01CA139980 and P50CA086355 (R.W.). K. Y. and R. G. were supported by NIH grant T32CA079443.
Footnotes
Electronic Supplementary Information (ESI) available: [details of any supplementary information available should be included here]. See DOI: 10.1039/b000000x/
These might include comments relevant to but not central to the matter under discussion, limited experimental and spectral data, and crystallographic data.
Notes and references
- 1.Vendrell M, Zhai D, Er JC, Chang YT. Chem Rev. 2012;112:4391. doi: 10.1021/cr200355j. [DOI] [PubMed] [Google Scholar]
- 2.Reiner T, Lacy J, Keliher EJ, Yang KS, Ullal A, Kohler RH, Vinegoni C, Weissleder R. Neoplasia. 2012;14:169. doi: 10.1593/neo.12414. [DOI] [PMC free article] [PubMed] [Google Scholar]
- 3.Thurber GM, Yang KS, Reiner T, Kohler RH, Sorger P, Mitchison T, Weissleder R. Nat Commun. 2013;4:1504. doi: 10.1038/ncomms2506. [DOI] [PMC free article] [PubMed] [Google Scholar]
- 4.Yang KS, Budin G, Reiner T, Vinegoni C, Weissleder R. Angew Chem Int Ed Engl. 2012;51:6598. doi: 10.1002/anie.201200994. [DOI] [PMC free article] [PubMed] [Google Scholar]
- 5.Koide Y, Urano Y, Hanaoka K, Terai T, Nagano T. ACS Chem Biol. 2011;6:600. doi: 10.1021/cb1002416. [DOI] [PubMed] [Google Scholar]
- 6.Lukinavicius G, et al. Nat Chem. 2013;5:132. doi: 10.1038/nchem.1546. [DOI] [PubMed] [Google Scholar]
- 7.Egawa T, Hanaoka K, Koide Y, Ujita S, Takahashi N, Ikegaya Y, Matsuki N, Terai T, Ueno T, Komatsu T, Nagano T. J Am Chem Soc. 2011;133:14157. doi: 10.1021/ja205809h. [DOI] [PubMed] [Google Scholar]
- 8.Menear KA, et al. J Med Chem. 2008;51:6581. doi: 10.1021/jm8001263. [DOI] [PubMed] [Google Scholar]
- 9.Desnoyers S, Kaufmann SH, Poirier GG. Exp Cell Res. 1996;227:146. doi: 10.1006/excr.1996.0259. [DOI] [PubMed] [Google Scholar]
- 10.Mortusewicz O, Ame JC, Schreiber V, Leonhardt H. Nucleic Acids Res. 2007;35:7665. doi: 10.1093/nar/gkm933. [DOI] [PMC free article] [PubMed] [Google Scholar]
- 11.Vyas S, Chesarone-Cataldo M, Todorova T, Huang YH, Chang P. Nat Commun. 2013;4:2240. doi: 10.1038/ncomms3240. [DOI] [PMC free article] [PubMed] [Google Scholar]
- 12.Orth JD, Kohler RH, Foijer F, Sorger PK, Weissleder R, Mitchison TJ. Cancer Res. 2011;71:4608. doi: 10.1158/0008-5472.CAN-11-0412. [DOI] [PMC free article] [PubMed] [Google Scholar]
- 13.Reiner T, Earley S, Turetsky A, Weissleder R. ChemBioChem. 2010;11:2374. doi: 10.1002/cbic.201000477. [DOI] [PMC free article] [PubMed] [Google Scholar]
- 14.Poot M, Zhang YZ, Kramer JA, Wells KS, Jones LJ, Hanzel DK, Lugade AG, Singer VL, Haugland RP. J Histochem Cytochem. 1996;44:1363. doi: 10.1177/44.12.8985128. [DOI] [PubMed] [Google Scholar]
- 15.Johnson LV, Walsh ML, Chen LB. Proc Natl Acad Sci U S A. 1980;77:990. doi: 10.1073/pnas.77.2.990. [DOI] [PMC free article] [PubMed] [Google Scholar]
- 16.Manders EMM, Verbeek FJ, Aten JA. J Microsc. 1993;169:375. doi: 10.1111/j.1365-2818.1993.tb03313.x. The Pearson’s correlation coefficient is a standard method of image correlation, with output values ranging from −1 to 1, where 1 indicates a perfect correlation between two channels, −1 indicates a perfect negative correlation and 0 indicates random correlation. Mander’s coefficients, M1 and M2, measures overlap with value ranges between 0 and 1, where 1 indicates a perfect colocalization and 0 indicates no colocalization. [DOI] [PubMed] [Google Scholar]
Associated Data
This section collects any data citations, data availability statements, or supplementary materials included in this article.


