

Abstract
Background
The liver plays a major role in regulating metabolic homeostasis and is vital for nutrient metabolism. Identifying the genetic factors regulating these processes could lead to a greater understanding of how liver function responds to a high-fat diet and how that response may influence susceptibilities to obesity and metabolic syndrome. In this study we examine differences in hepatic gene expression between the LG/J and SM/J inbred mouse strains and how gene expression in these strains is affected by high-fat diet. LG/J and SM/J are known to differ in their responses to a high-fat diet for a variety of obesity- and diabetes-related traits, with the SM/J strain exhibiting a stronger phenotypic response to diet.
Results
Dietary intake had a significant effect on gene expression in both inbred lines. Genes up-regulated by a high-fat diet were involved in biological processes such as lipid and carbohydrate metabolism; protein and amino acid metabolic processes were down regulated on a high-fat diet. A total of 259 unique transcripts exhibited a significant diet-by-strain interaction. These genes tended to be associated with immune function. In addition, genes involved in biochemical processes related to non-alcoholic fatty liver disease (NAFLD) manifested different responses to diet between the two strains. For most of these genes, SM/J had a stronger response to the high-fat diet than LG/J.
Conclusions
These data show that dietary fat impacts gene expression levels in SM/J relative to LG/J, with SM/J exhibiting a stronger response. This supports previous data showing that SM/J has a stronger phenotypic response to high-fat diet. Based upon these findings, we suggest that SM/J and its cross with the LG/J strain provide a good model for examining non-alcoholic fatty liver disease and its role in metabolic syndrome.
Keywords: Liver, Dietary fat, Non-alcoholic fatty liver disease, NAFLD, Gene expression, Microarray, SM/J, LG/J
Background
The relationship between dietary intake and metabolic syndrome is complex, with a number of genes, genetic interactions, and gene by environment interactions having significant effects on disease susceptibility and severity. Obesity-related metabolic disorders can occur when dietary energy intake chronically exceeds expenditure leading to a variety of conditions that include increased blood pressure, insulin resistance, and serum cholesterol levels [1]. Obesity per se is significantly influenced by both environmental factors, such as diet and exercise, and genetic factors, with heritability estimates ranging from 40% to 75% [2,3]. More critically, there is genetic variation among individuals in their responses to an obesogenic diet, with some being more likely to develop aspects of metabolic syndrome than others [4,5].
While metabolism involves a number of different organs, the liver is one of the key organs regulating nutrient homeostasis. Because of its direct involvement in dietary nutrient metabolism, the liver’s functional association to dietary obesity and metabolic syndrome is of keen interest. Previous work has shown that increased levels of dietary fat intake are associated with increased fat deposition in the liver and can lead to non-alcoholic fatty liver disease (NAFLD) [6-8]. This increase in hepatic fat is associated with a higher risk of obesity [9], insulin resistance [10-12], and type 2 diabetes mellitus [13,14]. As with obesity and metabolic syndrome, it has been suggested that susceptibility to NAFLD also has a strong genetic basis [15-19] with relatively high heritability values after controlling for age, sex, race, and body mass index [17]. Because of the strong association between hepatic fat accumulation and metabolic syndrome disorders, understanding how genetic factors influence the way in which the liver responds to increased dietary fat levels is critical.
Whole-genome expression studies have previously examined the effect of dietary fat intake on hepatic gene expression. A review of these studies shows that many of the genes whose expression is affected by dietary fat are related to lipid metabolism, adipocyte differentiation, defense against foreign bodies or injury, and stress response, particularly response to oxidative stress [20]. In a comprehensive study, Shockley et al. [21] examined hepatic gene expression profiles in relation to dietary fat and cholesterol for 10 different inbred mouse strains. Over all 10 strains, only Gene Ontology (GO) terms for cholesterol biosynthesis and isoprenoid metabolism were repressed by a high-fat diet in all of the strains. No biological GO terms were induced by a high-fat diet across all strains, indicating that differences in genetic background have a dominant effect on which genes and pathways respond to high dietary fat levels. However, the level of fat in the high-fat diet used by Shockley et al. [21] was modest (30% calories from fat), the low fat diet was not matched for other ingredients [22], and the dietary treatment lasted only from 6–10 weeks of age.
This study was designed to evaluate hepatic gene expression profiles for two mouse strains, LG/J and SM/J, on both a low and a high-fat diet. While the effect of dietary intake on hepatic gene expression has been assessed in a number of mouse strains, including SM/J [21], evaluating differences in expression levels between SM/J and LG/J provides a unique opportunity to examine the genetic factors associated with a number of obesity and metabolic syndrome related traits. LG/J and SM/J mice have been shown to differ in their response to a high-fat diet for traits involved in various metabolic syndrome domains [23,24]. SM/J individuals tend to be more responsive to the effect of a high-fat diet in relation to body weight, fat depot weight, organ weight, basal glucose levels, and triglyceride levels [23,24]. In addition, quantitative trait loci (QTLs) for a number of these phenotypes, including obesity [25-29], diabetes [25,30], serum lipid levels [25,31], fatty liver [32] and multiple domains of metabolic syndrome [33], have been mapped in populations derived from the intercross of these two strains. Thus, the goals of this project are twofold. First, we describe general differences in gene expression between these strains, between males and females, and between animals reared on low- and high-fat diets. More critically, we identify genes whose response to a high-fat diet differs between the LG/J and SM/J strains. Second, we relate these expression differences to genes located within previously defined QTLs where genetic effects were found to be diet-specific.
Results
Global gene expression
Of the 26,209 gene transcripts that showed significant expression levels, a total of 4,796 unique genes were differentially expressed among treatments. Of those, 3,880 transcripts were significantly different between SM/J and LG/J strains (Additional file 1), 1,224 were significantly different between males and females (Additional file 2), and 1,676 transcripts were significantly different by diet (Additional file 3). Three hundred transcripts showed a strain by diet interaction, 26 showed a significant strain by sex interaction, and only two showed a significant diet-by-sex-by-strain interaction, both of which corresponded to the gene Cidea (Table 1).@@@@
Table 1.
Number of differentially expressed genes for each factor and their interactions
| Factor | Number of significant genes |
|---|---|
| Diet |
1676 |
| Sex |
1224 |
| Strain |
3880 |
| Diet*Sex |
26 |
| Diet*Strain |
300 |
| Sex*Strain |
0 |
| Diet*Sex*Strain | 2 |
Strain Effects. Forty-seven percent of the genes (1,840 gene transcripts) that were significantly different by strain were expressed more strongly in the LG/J strain and 53% more strongly in SM/J (2,040 gene transcripts) (Additional file 1). The genes that were significantly over-expressed within both LG/J and SM/J strains represented similar biological processes, such as lipid metabolism, protein metabolism and carbohydrate metabolic processes (Additional file 4). There were, however, differences in the biochemical pathways these genes represented (Additional file 4). Biochemical pathways that contained the largest number of genes over-expressed in SM/J included several response-to-stimulus pathways, including the platelet-derived growth factor (PDGF), integrin, and inflammation by chemokine and cytokine signaling pathways. In addition, a relatively large number of genes involved in apoptosis were over-expressed in SM/J. In LG/J, the metabolic-related pathways that were enriched included the purine metabolism and the cholesterol biosynthesis pathway. Other interesting pathways over-expressed in LG/J included the endothelin signaling pathway, the angiogensis pathway, and the insulin/IGF pathway.
Sex Effects. Of the 1,224 expressed transcripts that were significantly different between males and females, 46% were higher in males (568 gene transcripts) and 54% were higher in females (656 gene transcripts) (Additional file 2). As expected, genes that are sex-linked showed significant differences in expression between the sexes. Inactive X specific transcripts (Xist), located on the X chromosome, displayed the largest differences between males and females. Genes located on the Y chromosome, such as DEAD box polypeptide 3, Y-linked (Ddx3y), eukaryotic translation initiation factor 2, subunit 3, structural gene Y-linked (Eif2s3y) and ubiquitously transcribed tetratricopeptide repeat gene, Y chromosome (Uty), were expressed more in males. A number of cytochrome p-450 genes (Cyp) were also differentially expressed between the sexes (Additional file 2). Both males and females exhibited high expression in genes related to biological processes, such as lipid metabolism, carbohydrate metabolism, response to toxin, apoptosis and the generation of precursor metabolites and energy (Additional file 5), but the specific genes involved differed between males and females. On the other hand, the biochemical pathways represented by genes over-expressed in females differed substantially from those up-regulated in males. Pathways with genes expressed significantly higher in females were typically associated with amino acid biosynthesis, whereas pathways associated with increased expression in males were involved in a number of signaling pathways, including the heterotrimeric G-protein signaling pathway-Gi alpha and Gs alpha mediated pathway, the endothelial signaling pathway, and the cortocotropin releasing factor receptor signaling pathway (Additional file 5).
Response to Diet. For genes that were expressed differently on high and low-fat diets, 46% were higher in high-fat fed individuals (775 genes transcripts), while 54% (901 gene transcripts) were higher in low-fat fed individuals (Additional file 3). GO terms that were enriched for genes that showed significantly higher expression in high-fat fed individuals were involved in lipid and carbohydrate metabolism. Processes enriched in low-fat fed individuals included those involved in protein and amino acid metabolic processes (Additional file 6). Interesting biochemical pathways that were enriched by genes showing higher expression with high-fat diet are involved in stress response, such the p53 pathway, integrin signaling pathway, ubiquitin promeasome pathway, and the inflammation-mediated by chemokine and cytokine signaling pathways. Those enriched with genes that exhibited higher expression on a low-fat diet included blood coagulation, EGF receptor signaling, cholesterol biosynthesis, and a number of amino acid biosynthesis pathways (Additional file 6).
Diet-by-Strain Interactions. There were 259 genes (300 gene transcripts) whose expression exhibited a significant diet-by-strain interaction, i.e. diet affected expression differently in the two strains (Additional file 7). Gene expression was much more responsive to the high-fat diet in SM/J than in LG/J, with 95% of the diet related expression changes occurring in SM/J. GO terms enriched for genes exhibiting a diet-by-strain interaction included those involved in immune function, lipid and carbohydrate metabolic processes, and apoptosis (Table 2). The biochemical pathways that were significantly enriched included the plasminogen activating pathway, p53 pathway, angiogenesis, the integrin signaling pathway, and the blood coagulation pathway (Table 2).
Table 2.
Biological processes and biochemical pathways enriched by genes exhibiting a diet by strain interaction
| GO annotation term | GO annotation | Mus musculus genes FEFLIST (26185) | Number of genes in pathway | Number of genes expected | Over/under represented | P-value |
|---|---|---|---|---|---|---|
| Biological Process |
|
|
|
|
|
|
| immune system process |
GO:0002376 |
2974 |
62 |
20.22 |
+ |
1.72×10⁻¹⁶ |
| antigen processing and presentation |
GO:0019882 |
95 |
10 |
0.65 |
+ |
1.54×10⁻⁹ |
| antigen processing and presentation of peptide or polysaccharide antigen via MHC class II |
GO:0002504 |
35 |
6 |
0.24 |
+ |
1.90×10⁻⁷ |
| response to stimulus |
GO:0050896 |
2486 |
52 |
16.9 |
+ |
1.01×10⁻¹³ |
| response to stress |
GO:006950 |
547 |
13 |
3.72 |
+ |
1.08×10⁻⁴ |
| cellular defense response |
GO:0006968 |
564 |
16 |
3.83 |
+ |
1.93×10⁻⁶ |
| response to toxin |
GO:0009636 |
121 |
9 |
0.82 |
+ |
1.92×10⁻⁷ |
| signal transduction |
GO:0007165 |
4858 |
52 |
33.02 |
+ |
3.68×10⁻⁴ |
| immune response |
GO:0006955 |
900 |
16 |
6.12 |
+ |
4.75×10⁻⁴ |
| Unclassified |
|
10946 |
39 |
74.41 |
- |
1.81×10⁻⁸ |
| metabolic process |
GO:0008152 |
9603 |
93 |
65.28 |
+ |
1.63×10⁻⁵ |
| primary metabolic process |
GO:0044238 |
9122 |
91 |
62.01 |
+ |
6.03×10⁻⁶ |
| lipid metabolic process |
GO:0006629 |
1266 |
24 |
8.61 |
+ |
6.06×10⁻⁶ |
| carbohydrate metabolic process |
GO:005975 |
1038 |
19 |
7.06 |
+ |
9.55×10⁻⁵ |
| cellular process |
GO:0009987 |
7133 |
69 |
48.49 |
+ |
5.51×10⁻⁴ |
| endocytosis |
GO:0006897 |
604 |
14 |
4.11 |
+ |
7.65×10⁻⁵ |
| apoptosis |
GO:0006915 |
1035 |
18 |
7.04 |
+ |
2.73×10⁻⁴ |
| developmental process |
GO:0032502 |
3296 |
38 |
22.41 |
+ |
7.37×10⁻⁴ |
| system development |
GO:0048731 |
2222 |
29 |
15.1 |
+ |
5.23×10⁻⁴ |
| transport |
GO:0006810 |
3009 |
36 |
20.45 |
+ |
5.33×10⁻⁴ |
|
Biochemical Pathway |
|
|
|
|
|
|
| Plasminogen activation cascade |
|
18 |
3 |
0.12 |
+ |
2.74×10⁻⁴ |
| p53 pathway |
|
127 |
5 |
0.86 |
+ |
1.89×10⁻³ |
| Angiogenesis |
|
193 |
6 |
1.31 |
+ |
2.22×10⁻³ |
| Blood coagulation |
|
55 |
3 |
0.37 |
+ |
6.52×10⁻³ |
| Integrin signalling pathway |
|
185 |
5 |
1.26 |
+ |
9.06×10⁻³ |
| Androgen/estrogene/progesterone biosynthesis |
|
28 |
2 |
0.19 |
+ |
1.59×10⁻² |
| Ornithine degradation |
|
3 |
1 |
0.02 |
+ |
2.02×10⁻² |
| FAS signaling pathway |
|
38 |
2 |
0.26 |
+ |
2.80×10⁻² |
| Methylmalonyl pathway |
|
5 |
1 |
0.03 |
+ |
3.34×10⁻² |
| Xanthine and guanine salvage pathway |
|
6 |
1 |
0.04 |
+ |
4.00×10⁻² |
| p53 pathway feedback loops 2 | 51 | 2 | 0.35 | + | 4.77×10⁻² |
In order to evaluate gene clusters that responded similarly for genes exhibiting a diet-by-strain interaction, a K-means clustering analysis was preformed and produced 2 stable gene clusters. Cluster 1 is composed of genes involved in response to stimulus pathways, such as the p53 pathway, integrin signaling pathway, and the TGF signaling pathway (Additional file 8). Cluster two was comprised of pathways related to multiple salvage pathways, the plaminogen activating cascade, and blood coagulation (Additonal file 8). Hierarchical biclustering of the data also show that high-fat fed SM/J individuals clustered separately from all other groups for these genes (Figure 1).
Figure 1.
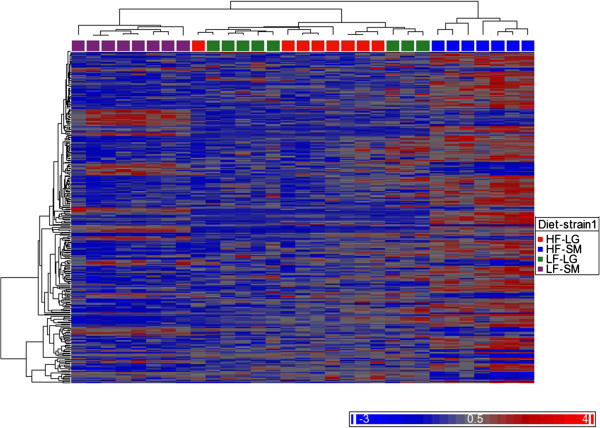
Heat map of genes exhibiting a diet by strain interaction. Hierarchical cluster analysis was performed producing two clusters, with the high-fat fed SM/J group clustering separately from all other groups. HF-LG: High-fat LG/J; HF-SM: High-fat SM/J; LF-LG: Low-fat LG/J; LF-SM: Low-fat SM/J.
Within Strain Effects. Analyzing SM/J and LG/J separately for the effects of diet and sex on gene expression produced very different results. When SM/J was analyzed separately, diet had the strongest effect on gene expression with 2,137 gene transcripts being differentially expressed. Of these, 1,200 transcripts were up-regulated and 937 down-regulated on the high-fat diet (Additional file 9). Only 25 gene transcripts showed differential expression in relation to diet in the LG/J strain, 15 with increased expression and 10 with decreased expression on a high-fat diet (Additional file 9).
The major factor responsible for variation in LG/J gene expression was sex, with 637 transcripts differentially expressed between males and females. Of the 637 transcripts, 396 were higher in females and 241 were higher in males. This is in sharp contrast to the sex effects observed in SM/J, where only 190 transcripts showed differential expression (Additional file 10).
Candidate Genes within QTLs
Studies of these strains have previously mapped QTLs affecting obesity, diabetes-related traits, and serum lipid levels in the LG,SM Advanced Intercross Lines (AIL). We correlated the list of genes in these QTLs with those demonstrating a differential response between strains to a high fat diet. Of the 259 genes showing different responses in LG/J and SM/J in relation to the high fat diet, 18 are located within QTLs previously mapped for serum lipid levels [31], 24 are located within QTLs mapped for obesity [27], and 20 are located within regions previous associated with diabetes [30] (Table 3). Chi-square analysis show QTLs previously identified as associated with serum lipid levels and obesity were significantly enriched with genes showing significant diet-by-strain interactions (Obesity: χ2=5.95, p=0.015; Lipids: χ2=6.91, p=0.008). However, QTLs associated with diabetes were not enriched (χ2=1.49; p=0.22). This result indicates that differential gene expression between strains in response to diet is the likely source of at least some of the mapped QTL effects.
Table 3.
Genes transcripts with a significant diet by strain interaction for lipid, obesity, and diabetes QTLs
| QTL | Probe ID | Gene ID | Chromosome | Start | Stop | Strand |
|---|---|---|---|---|---|---|
|
Lipid Serum QTLs |
|
|
|
|
|
|
|
Dserum1b |
ILMN_2717387 |
Fbxo36 |
1 |
84836416 |
84897062 |
+ |
|
Dserum1b |
ILMN_2502317 |
Ugt1a10 |
1 |
89951963 |
90115579 |
+ |
|
Dserum1b |
ILMN_2754718 |
Ugt1a9 |
1 |
89967375 |
90115572 |
+ |
|
Dserum1c |
ILMN_2954575 |
Arhgap30 |
1 |
173319085 |
173340429 |
+ |
|
Dserum3a |
ILMN_2529128 |
LOC329702 |
3 |
89169322 |
89178368 |
+ |
|
Dserum3a |
ILMN_2883392 |
S100a11 |
3 |
93324410 |
93330209 |
+ |
|
Dserum3a |
ILMN_1213457 |
Snx27 |
3 |
94301466 |
94386638 |
- |
|
Dserum3a |
ILMN_2837802 |
BC028528 |
3 |
95687877 |
95695928 |
- |
|
Dserum3a |
ILMN_2656422 |
BC028528 |
3 |
95687877 |
95695928 |
- |
|
Dserum4a
|
ILMN_2674367 |
Agrn
|
4 |
155539399 |
155560010 |
- |
|
Dserum5a
|
ILMN_2690061 |
Hnrpdl
|
5 |
100462596 |
100468683 |
- |
|
Dserum8a |
ILMN_2719473 |
Asf1b |
8 |
86479406 |
86494096 |
+ |
|
Dserum10a
|
ILMN_3100812 |
Gpx4
|
10 |
79509911 |
79519184 |
+ |
|
Dserum10a
|
ILMN_2684855 |
Gpx4
|
10 |
79509911 |
79519184 |
+ |
|
Dserum17a |
ILMN_2729447 |
9030612M13Rik |
17 |
32910210 |
32924492 |
- |
|
Dserum17a |
ILMN_1236993 |
March2 |
17 |
33825041 |
33855598 |
- |
|
Dserum17a |
ILMN_1226525 |
H2-Ab1 |
17 |
34400185 |
34406355 |
+ |
|
Dserum17a |
ILMN_2631423 |
H2-Ab1 |
17 |
34400185 |
34406355 |
+ |
|
Dserum17a |
ILMN_2913716 |
H2-Ab1 |
17 |
3440185 |
34406355 |
+ |
|
Dserum17a |
ILMN_1239102 |
H2-Eb1 |
17 |
34442843 |
34453144 |
+ |
|
Dserum17a |
ILMN_2741935 |
H2-Ea |
17 |
34479878 |
34481588 |
- |
|
Dserum17a |
ILMN_2599858 |
Pbx2 |
17 |
34729416 |
34734286 |
+ |
|
Dserum18a |
ILMN_1226868 |
Mapk4 |
18 |
74088140 |
74225013 |
- |
|
Dserum19a |
ILMN_2677859 |
Insl6 |
19 |
29395844 |
29399808 |
- |
|
Dserum19a |
ILMN_2738893 |
Ermp1 |
19 |
29682704 |
29722905 |
- |
|
Obesity QTLs |
|
|
|
|
|
|
|
Dob2a |
ILMN_1220441 |
Camk1d |
2 |
5214503 |
5635561 |
- |
|
Dob3a
|
ILMN_1219717 |
Sort1
|
3 |
108087009 |
108164429 |
+ |
|
Dob4a |
ILMN_247997 |
2310040A07Rik/Enho |
4 |
41585177 |
41587357 |
- |
|
Dob6a |
ILMN_2656021 |
Osbpl3 |
6 |
50243329 |
50406200 |
- |
|
Dob6a |
ILMN_2974064 |
Osbpl3 |
6 |
50243329 |
50406200 |
- |
|
Dob6e |
ILMN_1221060 |
Pparg |
6 |
115372091 |
115440419 |
+ |
|
Dob6e |
ILMN_1216056 |
2510049J12Rik |
6 |
115533562 |
115542594 |
- |
|
Dob6e |
ILMN_2956092 |
Rassf4 |
6 |
116583026 |
116623809 |
- |
|
Dob6e |
ILMN_2686244 |
Rassf4 |
6 |
116583026 |
116623809 |
- |
|
Dob6e |
ILMN_2672698 |
Rassf4 |
6 |
116583026 |
116623809 |
- |
|
Dob8a |
ILMN_2912598 |
Ap3m2 |
8 |
23897827 |
23916099 |
- |
|
Dob8c |
ILMN_2719473 |
Asf1b |
8 |
86479406 |
86494096 |
+ |
|
Dob10b
|
ILMN_1215807 |
Glipr1
|
10 |
111422511 |
111439687 |
- |
|
Doc10c |
ILMN_3162796 |
Cnot2 |
10 |
115922222 |
116018557 |
- |
|
Doc10c |
ILMN_2878071 |
Lyz |
10 |
116724853 |
116729924 |
- |
|
Dob13a |
ILMN_2865016 |
Cd83 |
13 |
43880572 |
43898501 |
+ |
|
Dob14a |
ILMN_2627022 |
Itih4 |
14 |
31699662 |
31715167 |
+ |
|
Dob14a |
ILMN_1231336 |
Itih3 |
14 |
31721762 |
31736731 |
- |
|
Dob17b |
ILMN_1236993 |
March2 |
17 |
33825041 |
33855598 |
- |
|
Dob17b |
ILMN_1226525 |
H2-Ab1 |
17 |
34400185 |
34406355 |
+ |
|
Dob17b |
ILMN_2631423 |
H2-Ab1 |
17 |
34400185 |
34406355 |
+ |
|
Dob17b |
ILMN_2913716 |
H2-Ab1 |
17 |
34400185 |
34406355 |
+ |
|
Dob17b |
ILMN_1239102 |
H2-Eb1 |
17 |
34442843 |
34453144 |
+ |
|
Dob17b |
ILMN_2741935 |
H2-Ea |
17 |
34479878 |
34481588 |
- |
|
Dob17b |
ILMN_2599858 |
Pbx2 |
17 |
34729416 |
34734286 |
+ |
|
Dob17b |
ILMN_2665266 |
H2-T10 |
17 |
36254035 |
36258389 |
- |
|
Dob17b |
ILMN_1230878 |
H2-T10 |
17 |
36254035 |
36258389 |
- |
|
Dob17b |
ILMN_2783997 |
Trim10 |
17 |
37006537 |
37014750 |
+ |
|
Dob17b |
ILMN_2426853 |
Ubd |
17 |
37330873 |
37332782 |
+ |
|
Dob17b |
ILMN_2964185 |
H2-M2 |
17 |
37617796 |
37620474 |
- |
|
Dob17b |
ILMN_2742311 |
Cyp39a1 |
17 |
43804474 |
4388794 |
+ |
|
Dob19a |
ILMN_1230587 |
Lpxn |
19 |
12873133 |
12908301 |
+ |
|
Diabetes QTLs |
|
|
|
|
|
|
|
Ddiab3a |
ILMN_1222860 |
381484 |
3 |
15848070 |
15906332 |
- |
|
Ddiab4a |
ILMN_2773215 |
Epb4.1l4b |
4 |
57004844 |
57156309 |
- |
|
Ddiab4a |
ILMN_2775064 |
Epb4.1l4b |
4 |
57004844 |
57156309 |
- |
|
Ddiab4b |
ILMN_2736168 |
Ppt1 |
4 |
122513485 |
122536418 |
+ |
|
Ddiab5a |
ILMN_2424721 |
Pdgfa |
5 |
139451968 |
139473324 |
- |
|
Ddiab6a |
ILMN_2656021 |
Ospl3 |
6 |
50243329 |
50406200 |
- |
|
Ddiab6a |
ILMN_2974064 |
Osbpl3 |
6 |
50243329 |
50406200 |
- |
|
Ddiab5d |
ILMN_1221060 |
Pparg |
6 |
115372091 |
115440419 |
+ |
|
Ddiab5d |
ILMN_1216056 |
2510049J12Rik |
6 |
115533562 |
115542594 |
- |
|
Ddiab7b |
ILMN_2658804 |
Rras |
7 |
52273348 |
52277016 |
+ |
|
Ddiab7c |
ILMN_2707494 |
Mcee |
7 |
71537531 |
71557007 |
+ |
|
Ddiab8a |
ILMN_2912598 |
Ap3m2 |
8 |
23897827 |
23916099 |
- |
|
Diab8b |
ILMN_2767918 |
Ifi30 |
8 |
73286673 |
73290562 |
- |
|
Diab8b |
ILMN_1228213 |
Ifi30 |
8 |
73286673 |
73290562 |
- |
|
Diab8b |
ILMN_2749747 |
Haus8 |
8 |
73772460 |
73796833 |
- |
|
Ddiab11a |
ILMN_2727503 |
Igfbp3 |
11 |
7106089 |
7113900 |
- |
|
Diab11d
|
ILMN_3147074 |
Pecam1
|
11 |
106515531 |
106611942 |
- |
|
Ddiab13a |
ILMN_2595395 |
Slc17a2 |
13 |
23898862 |
23917049 |
+ |
|
Ddiab13a |
ILMN_1217058 |
Slc17a2 |
13 |
23898862 |
23917049 |
+ |
|
Ddiab13c |
ILMN_3122081 |
5133401N09Rik |
13 |
58259015 |
58266052 |
+ |
|
Ddiab14b |
ILMN_2627022 |
Itih4 |
14 |
31699662 |
31715167 |
+ |
|
Ddiab14b |
ILMN_1231336 |
Itih3 |
14 |
31721762 |
31736731 |
- |
|
Diab15b |
ILMN_2543688 |
Snord123 |
15 |
32170324 |
32176484 |
|
|
Ddiab16a |
ILMN_1222821 |
Rogdi |
16 |
5008823 |
5013610 |
- |
|
Ddiab17a
|
ILMN_2933463 |
Plg
|
17 |
12571474 |
12612250 |
+ |
| Ddiab19a | ILMN_2744398 | Ostf1 | 19 | 18653818 | 18706279 | - |
Transcripts in bold are located just outside the 95% CI for the QTL and were not included in the enrichment analysis.
Discussion
This study has two main goals. The first, to characterize hepatic gene expression profiles for SM/J and LG/J inbred mouse strains and examine how these profiles were influenced by diet and sex. The second goal is to examine how expression profiles differ between these two strains in relation to diet, and to characterize potential candidate genes located within previously mapped QTLs that are associated with traits from metabolic syndrome domains. As expected, our results show that diet, sex, and strain all have significant impacts on gene expression, with many genes showing strain-specific dietary responses for gene expression.
Overall, the impact of the high-fat diet on gene expression appears to be similar to that found in other expression studies [20]. There are many more effects than noted in Shockley et al. [21] perhaps because of the higher amount of fat in the diet utilized here (42% vs 30%) and the prolongation of the dietary treatment, from 6–10 weeks compared to 3–20 weeks in our study. A number of defense and stress response pathways were enriched by genes over-expressed in high-fat fed mice, including the p53, the inflammation mediated by chemokine and cytokine, and the ubiquitin signaling pathways, which regulate cellular damage response and influence inflammatory response. Enrichment of these pathways supports previous work suggesting that a high-fat diet can lead to cellular oxidative stress and increased inflammation within the liver, potentially resulting in nonalcoholic steatohepatitis (NASH), liver fibrosis, and further exacerbating insulin resistance [34-38].
SM/J and LG/J differ in their phenotypic response to a high-fat diet, with SM/J being more responsive than LG/J for many obesity, diabetes-related, and serum lipid level traits [23,24]. While these phenotypic differences between these strains have previously been observed, the stark differences in how diet impacts gene expression is somewhat surprising. A total of 259 unique genes displayed significant diet-by-strain interactions. In 95% of these cases, SM/J mice displayed a greater change in expression in relation to diet than LG/J mice. Hierarchical cluster analysis of these genes grouped high-fat fed SM/J separately from all other groups (Figure 1), again demonstrating that SM/J is more responsive to dietary fat intake than LG/J. This suggests that genetic background plays a significant role in influencing how genes respond to high-fat diet.
Similar to these results, Shockey et al’s. [21] assessment of how high fat diet affected gene expression showed that only a few biochemical pathways were commonly affected across the strains that were analyzed. This suggests that there is little consistency between strains in what is up- or down-regulated on a high fat diet. This is an important consideration because it means that genetic background plays a significant role in how diet impacts gene expression in this system. Thus, one cannot characterize a general murine response to a high fat diet for hepatic expression using any specific strain, such as C57BL/6J. While this may seem like an obstacle for murine studies of hepatic gene expression, it also provides a great opportunity to examine how genetic background influences these effects.
The biological processes that are most enriched with genes showing diet-by-strain interactions were mainly related to immune system processes, specifically antigen processing and presentation. Most of the differences were driven by the effects of the high-fat diet in SM/J mice. Associated with these are a number of transcripts involving major histocompatibilty complexes (MHC) I and II (Hfe, H2-D1, H2-D4, H2-Ea, H2-Ab1, H2-DMa) and killer cell activation (Tyrobp, Pira11). In most cases, there was a significant increase in the expression of these genes with a high-fat diet in SM/J and either no change or a slight decrease in expression in LG/J. This suggests a heightened immune response in SM/J with a high-fat diet, compared to LG/J mice. There is substantial evidence suggesting a strong association between immune response and metabolic function [39]. In particularly, diets that are high in fat have been shown to trigger immune response, particularly through inflammation in a number of different tissues (including adipose and liver) [40-42]. For example, MHC-II expression tends to increase when cells are under oxidative stress [43,44], and increased expression of MHC-II associated genes in hepatic cells can be induced by altering levels of dietary cholesterol [45]. Severe oxidative stress can lead to cellular damage, resulting in further hepatic inflammation, and potentially the development of heptatic steatosis and insulin resistance [34-38]. The difference in immune response in relation to diet between these two strains may, in part, explain why they differ in their response to dietary treatment. In particular, it provides some information as to why SM/J mice may show diminished glucose tolerance in comparison to the LG/J strain [24] on a high fat diet.
Biochemical pathways that were enriched with genes showing a diet-by-strain interaction included the plasminogen activating pathway, p53 pathway, and angiogenesis (Table 2). As a consequence of increased hepatic inflammation and hypoxia, which are associated with immune response, angiogenesis is commonly induced in order to increase blood flow and provide oxygen and nutrients to damaged areas [46,47]. Interestingly, Liu et al. [48] found that angiogenesis in a skin wound-healing model was higher in the MRL strain, which shares 75% of its DNA identical-by-descent with LG/J, than in other strains. In our data, we found that diet affected many genes within this pathway differently and in a strain-specific fashion. Some genes, including angiopotin (Ang) and mitogen-activated protein kinase 4 (Mapk4), showed decreased expression in high-fat fed SM/J mice, Rous sarcoma oncogene (Src) and Mapk4 showed increased expression in high-fat fed LG/J mice and the remaining genes in this pathway with a diet-by-strain effect (i.e., platelet derived growth factor (Pdgfa), docking protein 2 (Dok2) and leupaxin (Lpxn)) exhibited increased expression in high-fat fed SM/J (Table 4). Still, the actual phenotypic effect that these gene expression changes have on the liver is unclear. For example, Ang and Pdgfa, along with other growth factors, have a strong pro-angiogenic effect when up-regulated [47]. In our data gene expression levels for Ang were lower in SM/J animals fed a high-fat diet, while Pdgfa expression levels significantly increased. Similarly, Lpxn encodes for the protein leupaxin, a member of the paxillin protein family, which play an important role in focal cell adhesion organization and signal transduction within the extracellular matrix [49,50]. It also provides a platform for SRC protein binding [50,51]. In our data set Src showed increased expression on a high-fat diet in LG/J, while Lpxn only showed increased expression in high-fat fed SM/J animals. It, therefore, appears that while high-fat diet does impact the angiogenesis pathway for both LG/J and SM/J, the genes that are impacted differ between the two. To clarify these results future studies assessing the effects of high-fat diet on angiogenesis for these strains should continue. Future studies would also be interesting considering how closely related LG/J is to MRL and MRL’s strong healing phenotype.
Table 4.
Genes expressing significant diet-by-strain interactions within enriched biochemical pathways
| Biochemical pathways | Genes within pathway |
|---|---|
| Plasminogen activating cascade |
Serpinf2 (↓HFSm), Plg
D
(↓HFSm), Fga(↓HFSm) |
| p53 pathway |
Igfbp3
D
(↑HFSm), E2f1 (↑HFSm), Ccng1(↑HFSm), Tnfrsf6(↑HFSm), Cdc2a(↑HFSm) |
| Angiogenesis |
Src(↑HFLg), Ang(↓HFSm), Mapk4
L
(↑HFLg, ↓HFSm), Dok2
FL
(↑HFSm), Lpxn
MS,Ob
(↑HFSm), PdgfaD(↑HFSm) |
| Blood coagulation |
Serpinf2(↓HFSm), Plg
D
(↓HFSm), Fga(↓HFSm) |
| Integrin signalling pathway |
Fn1(↑HFLg, ↓HFSm), Src(↑HFLg), Rras
D
(↑HFSm), Mapk4
L
(↑HFLg, ↓HFSm), Arl11
FL
(↑HFSm) |
| Androgen/estrogene/progesterone biosynthesis |
Hsd3b4(↓HFLg), Hsd3b2(↓HFSm) |
| Ornithine degradation |
Azi2(↓HFSm) |
| FAS signaling pathway |
Capg(↑HFSm), Tnfrsf6(↑HFSm) |
| Methylmalonyl pathway |
Mcee
MS,P
(↑HFSm) |
| Xanthine and guanine salvage pathway |
Hprt1(↑HFSm) |
| p53 pathway feedback loops 2 | E2f1(↑HFSm), Ccng1(↑HFSm) |
Arrows indicate wether expression levels were higher or lower in high-fat fed individuals verses low-fat fed individuals. HFSm=High-fat fed SM/J, HFLg=High-fat fed LG/J. Genes with superscripts are located within and near previously identified QTLs for a number of traits.
D Diabetes QTL, L Lipid QTL, FL Fatty Liver QTL, MS Metabolic Syndrome QTL, O Obesity QTL.
One of the most interesting aspects of this study is that QTLs associated with many metabolic syndrome domains, including obesity, diabetes, cholesterol and triglyceride levels, and fatty liver, have previously been mapped in LG/J by SM/J crosses using the same high and low-fat diets as used in this study [25,27,30-33]. Thus, by examining how gene expression profiles differ between these strains, particularly for genes within these QTL regions, we can narrow the number of positional candidate genes influencing individual dietary response. Of the 259 gene transcripts with a significant diet by strain interaction, 57 were located within previously mapped QTLs. There was a significant enrichment of genes for obesity and serum lipid level QTLs, although, no such enrichment occurred for diabetes-related QTLs. Several metabolic syndrome components are associated with genes within and around these regions including peroxisome proliferator-activated receptor gamma (Pparg), energy homeostasis (Enho), insulin-like growth factor binding protein 3 (Igfbp3), palmitoyl-protein thioesterase 1 (Ppt1), and sortilin 1 (Sort1).
Genes associated with lipid metabolism, such as Pparg and Enho, were differentially expressed between SM/J and LG/J strains. Pparg is well known as a major factor involved in dietary obesity and diabetes [52-54] and one of the major regulators of adipocyte differentiation. This gene is located within a QTL affecting both obesity- [27] and diabetes-related traits [30]. Gene expression profiles for Pparg showed that high-fat diet increased expression of this gene in both SM/J and LG/J, although this increase was significantly greater in SM/J individuals (Figure 2A). Enho produces adropin, a protein involved in glucose and lipid homeostasis [55], and is located within a QTL associated with obesity [56]. Increased levels of adropin in transgenic mice were found to be associated with improved response to diet-induced obesity, insulin resistance, and glucose tolerance [54]. In SM/J, the high-fat diet significantly reduces the expression of Enho, promoting obesity. Expression was also reduced in high-fat fed LG/J animals, but this decrease was not as severe as that observed in SM/J (Figure 2B).
Figure 2.

Least square mean intensity values for genes within or near previously identified QTLs that exhibited a diet by strain interaction. (A) Peroxisome proliferator-activated receptor gamma (Pparg); (B) Energy homeostasis (Enho); (C) Sortilin (Sort1); (D) Platelet/endothelial cell adhesion molecule 1 (Pecam1). Abbrev: LF-SM: Low-fat SM/J; HF-SM: High-fat SM/J; LF-LG: Low-fat LG/J; HF-LG: High-fat LG/J. Graphs based on LS mean of raw intensity data. Error bars represent standard error of the mean.
Sortilin (Sort1) plays a significant role in the release of low-density lipoprotein (LDL) cholesterol from the liver to the blood stream making it a potentially important gene for NAFLD and is located just outside the 1-LOD drop support interval of a QTL mapped for obesity [27]. Recently, single nucleotide polymorphisms (SNPs) located in an enhancer region of this gene have shown to be associated with an increased risk of myocardial infarction and increased LDL cholesterol levels. In this study, we found that the overall levels of Sort1 were significantly higher in SM/J than in LG/J. However, high-fat diet significantly lowered expression of Sort1 in SM/J, while this effect was not observed for the LG/J strain (Figure 2C). Similarly, total cholesterol levels from blood serum tend to be lower in SM/J compared to LG/J, but these values respond more to diet in SM/J, with high-fat diet eliciting a significant increase [24].
Genes that have been shown to impact NAFLD were also differentially expressed between LG/J and SM/J. Platelet/endothelial cell adhesion molecule 1 (Pecam1) is a glycoprotein located near a QTL for fatty liver [32] and diabetes [30]. Previous work has suggested that Pecam1 is involved in regulating inflammation and higher expression of this gene protects the liver from the effect of high dietary fat and NAFLD [57]. High-fat fed SM/J displayed significantly higher Pecam1 expression levels when compared to low-fat fed individuals. The effect of diet on Pecam1 expression was not significant in LG/J (Figure 2D). This may suggest that the liver in SM/J mice is under increased stress when fed a high-fat diet relative to LG/J. Overall, the expression profiles of genes in QTLs on a high fat diet, support increased obesity, serum lipid levels, and diabetes associated with the SM/J alleles.
The only gene transcripts exhibiting a significant 3-way diet-by-sex-by-strain interaction were for the cell death-inducing DNA fragmentation factor-alpha (Cidea) gene. While this gene is not located within a previously identified QTL, mice deficient in Cidea do show increased metabolic rates and resistance to obesity when on a high-fat diet [58]. Cidea expression is strongly associated with the production of lipid droplets in white adipose tissue, with increased expression enhancing the size of the lipid droplets [59]. In addition, this increase is also associated with increased insulin sensitivity [59]. Cidea expression is typically regulated by Pparg and our data show that Cidea and Pparg show similar expression trends (Figure 3). However, the 3-way interaction of Pparg was not significant at the whole genome level. Remaining questions are why such strong differences in Cidea expression were observed between SM/J males and SM/J females and whether or not these effects are also observed in other strains. To our knowledge, there is no data within the literature addressing sex specific differences in Cidea expression in relation to diet. Most studies examining expression levels do not separate out sex effects, with few exceptions [60], and indeed, for our data set, the effect observed in SM/J males were strong enough that when SM/J males and SM/J females were pooled together a significant increase in Cidea was still observed. Thus, future studies would benefit from separating out and examining the sexes individually in order to determine if significant sex effects are likewise occurring.
Figure 3.
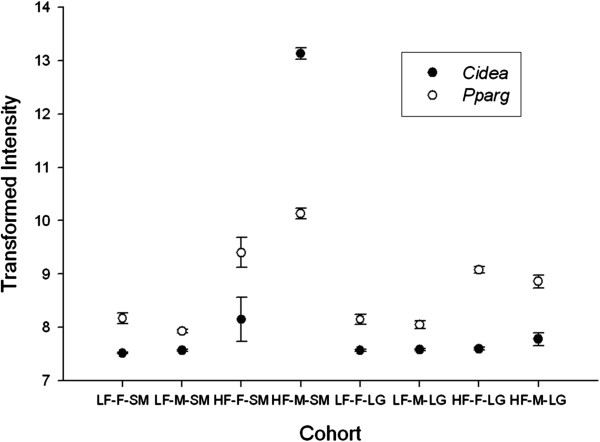
Comparison of Cidea and Pparg intensity values. Abbrev: LF-F: Low-fat female; LF-M: Low-fat male; HF-F: High-fat female; HF-M: High-fat male. Transformed data are used for comparison purposes. Error bars represent standard error of the mean.
Conclusions
These data show that dietary fat intake significantly impacts gene expression levels, particularly in SM/J relative to LG/J. This is consistent with previous phenotypic data that has shown SM/J to be more responsive than LG/J to a high-fat diet for metabolic syndrome associated traits, such as obesity, diabetes and lipid serum levels [23,24]. Many of the genes that are affected by diet are related to cellular defense, stress, and inflammation, suggesting that increased dietary fat intake promotes processes related to hepatic inflammation more so in SM/J than in LG/J. As the prevalence of NAFLD and its association with obesity and increased risk for metabolic syndrome steadily increases among Western societies, it is becoming vital that we understand the factors that contribute to individual variability in and susceptibility to this disease. Previous work has shown that genetic differences between SM/J and LG/J contribute to the amount of fat that accumulates within the liver on a high-fat diet [32] and QTLs for this trait have been mapped in recombinant inbred strains produced from these two parent strains. In accordance with this and our findings that gene expression profiles in response to high-fat diet produces a strong inflammatory response within the liver, particularly for SM/J, we suggest that SM/J and its cross with the unresponsive LG/J strain are a good model for examining non-alcoholic fatty liver disease and its role in the metabolic syndrome.
Methods
In order to assess the effects of dietary intake on gene expression in SM/J and LG/J mice, males and females from each strain were placed on either a low-fat diet (15%, Research Diets #D12284) or high-fat (42%, Harlan-Teklad #TD88137) diet immediately after weaning (3weeks) until 20 weeks of age (Table 5). Previous work has shown that SM/J mice consume more calories per gram of body mass than LG/J; however, there is no difference in the amount of energy consumed per body mass between individuals fed a high-fat versus a low-fat diet for either strain [24]. At 20 weeks, mice were sacrificed in late morning after a four-hour fast and tissue was collected from 4 males and 4 females from each strain and diet. The liver tissue was immediately frozen in liquid nitrogen and stored at −80°C until extraction. All animal procedures were approved by the Washington University in St. Louis Institutional Animal Care and Use Committee (IACUC).
Table 5.
Components of high-fat and low-fat diets
| High fat diet | Low fat diet | |
|---|---|---|
| Energy from fat (%) |
42 |
15 |
| Casein (g/kg) |
195 |
197 |
| Sugars (g/kg) |
341 |
307 |
| Corn starch (g/kg) |
150 |
313 |
| Cellulose (g/kg) |
50 |
50 |
| Corn oil (g/kg) |
0 |
58 |
| Hydrogenated coconut oil (g/kg) |
0 |
7 |
| Anhydrous milk fat (g/kg) |
210 |
0 |
| Cholesterol (g/kg) |
1.5 |
0 |
| Kilojoules per gram | 18.95 | 16.99 |
Total RNA was extracted using RNeasy® 96 Universal Tissue extraction kits (Qiagen, Valencia, CA) and quantified using a Nanodrop™ 2000 (Thermo Scientific, Wilmington, DE). RNA samples were submitted to the Washington University Microarray Core Facility, where quality was assessed using a 2100 Bioanalyzer (Agilent Tecnologies, Palo Alto, CA). RNA was reverse transcribed and amplified using an Illumina TotalPrep amplification kit (Ambion, Austin, TX) and then hybridized onto Illumina® WG-6 v.2 BeadChips (Illumina, San Diego, CA). Arrays were scanned using the Illumina Beadstation 500. Images were processed using Illumina BeadScan software and intensity values were analyzed using Illumina BeadStudio.
Illumina raw data from 45,281 unique probes were read into R statistical software using the Lumi package [61]. Data were transformed using a variance stabilization transformation [62], which takes into account the large number of technical replicates on Illumina arrays, and normalized using a robust spline normalization. Genes that showed no significant expression were filtered from the data set prior to analysis, leaving 26,209 transcripts analyzed for the liver. The data was then read into Partek Genomics software v. 6.5 (Partek Incorporated, St. Louis, MO) for further statistical analysis. An ANOVA was used to examine the impact of diet, strain, sex, and their interactions (diet x strain, diet x sex, sex x strain, and diet x sex x strain) on differential gene expression. A genome-wide false discovery rate threshold of 0.05 was used to determine statistical significance.
K-means and hierarchical clustering analysis were performed in Partek (Partek Incorporated, St. Louis, MO) on genes that showed significant diet-by-strain interactions (FDR<0.05). K-means clustering was preformed using a Euclidian distance function with 1,000 iterations utilizing different values of K. The number of clusters with the lowest David-Bouldin value was identified as the most likely value of K. Hierarchical clustering was performed on group mean data using a Euclidian distance function and average linkage method.
The Gene Ontology (GO) database PANTHER (http://pantherdb.org) was used to determine biological processes and biochemical pathways that were enriched with differentially expressed genes. Pathways and processes with p values<0.05 were considered to be significant.
In order to determine if previously identified QTLs for diabetes, serum lipid levels, and obesity were significantly enriched with genes exhibiting a significant diet-by-strain interaction, a chi-square test was used to determine if the number of these genes located within QTLs significantly differed from what would be expected by chance. Probability values of <0.05 were used to determine significance.
Availability of supporting data
The data set supporting the results of this article are available in the ArrayExpress database (http://www.ebi.ac.uk/arrayexpress) under the accession number #E-MTAB-2172.
Abbreviations
NAFLD: Non-alcoholic fatty liver disease; QTL: Quantitative trait loci.
Competing interests
No conflicts of interest (financial or otherwise) are declared by the authors.
Authors’ contributions
JMC conceived the study. CP, GF, and BW were involved in sample and data collection. CP performed the statistical analyses. CP, CFS, and JMC were involved in data interpretation. CP and JMC wrote the manuscript. All authors read and edited the manuscript.
Supplementary Material
Gene transcripts that are significantly different between SM/J and LG/J lines.
Gene transcripts that are significantly different between females and males.
Gene transcripts that are significantly different between diets.
Biological and biochemical processes enriched by genes exhibiting higher expression in either SM/J or LG/J.
Biological and biochemical processes enriched by genes exhibiting higher expression in either females or males.
Biological and biochemical process enriched by genes exhibiting higher expression with either low-fat or high-fat diets.
Genes that exhibited a significant diet-by-strain interaction.
Biological and biochemical process enriched by genes from cluster 1 and cluster 2.
Gene transcripts displaying differential expression with diet in SM/J.
Gene transcripts differentially expressed between the sexes in LG/J.
Contributor Information
Charlyn G Partridge, Email: cpartri4@uwo.ca.
Gloria L Fawcett, Email: glfawcet@bmc.edu.
Bing Wang, Email: bingw@pcg.wustl.edu.
Clay F Semenkovich, Email: csemenko@wustl.edu.
James M Cheverud, Email: jcheverud@luc.edu.
Acknowledgements
This project was funded by grants obtained through the National Institute of Health RR015116 and DK-055736 (J M Cheverud). We would also like to thank Heather Lawson for assisting with statistical analysis.
References
- Heymsfield SB. How large is the energy gap that accounts for the obesity epidemic? Am J Clin Nutri. 2009;15:1717–1718. doi: 10.3945/ajcn.2009.27889. [DOI] [PubMed] [Google Scholar]
- Stunkard AJ, Foch TT, Hrubec Z. A twin study of human obesity. JAMA. 1986;15:51–54. [PubMed] [Google Scholar]
- Stunkard AJ, Sørensen TIA, Hanis C, Teasdale TW, Chakraborty R, Schull WJ, Schulsinger F. An adoption study of human obesity. N Engl J Med. 1986;15:193–198. doi: 10.1056/NEJM198601233140401. [DOI] [PubMed] [Google Scholar]
- Cornier MA, Dabelea D, Hernandez TL, Lindstrom RC, Steig AJ, Stob NR, Van Pelt RE, Wang H, Eckel RH. The metabolic syndrome. Endocr Rev. 2008;15:777–822. doi: 10.1210/er.2008-0024. [DOI] [PMC free article] [PubMed] [Google Scholar]
- Musani SK, Erickson S, Allison DB. Obesity—still highly heritable after all these years. Am J Clin Nutr. 2008;15:275–276. doi: 10.1093/ajcn/87.2.275. [DOI] [PubMed] [Google Scholar]
- Deng QG, She H, Cheng JH, French SW, Koop D, Xiong S, Tsukamoto H. Steatohepatitis induced by intragastric overfeeding in mice. Hepatology. 2005;15:905–914. doi: 10.1002/hep.20877. [DOI] [PubMed] [Google Scholar]
- Sathiaraj E, Chutke M, Reddy MY, Pratap N, Rao PN, Reddy DN, Raghunath M. A case–control study on nutritional risk factors in non-alcoholic fatty liver disease in Indian population. Eur J Clin Nutr. 2011;15:533–537. doi: 10.1038/ejcn.2011.3. [DOI] [PubMed] [Google Scholar]
- Zou Y, Li J, Lu C, Wang J, Ge J, Huang Y, Zhang L, Wang Y. High-fat emulsion-induced rat model of nonalcoholic steatohepatitis. Life Sci. 2006;15:1100–1107. doi: 10.1016/j.lfs.2006.03.021. [DOI] [PubMed] [Google Scholar]
- Luyckx FH, Desalve C, Thiry A, Scheen AJ, Gielen JE, Lefbvre PJ. Liver abnormalities in severely obese subjects: effect of drastic weight loss after gastroplasty. Int J Obesity. 1998;15:222–226. doi: 10.1038/sj.ijo.0800571. [DOI] [PubMed] [Google Scholar]
- Marchesini G, Brizi M, Morselli-Labate AM, Bianchi G, McCullough AJ, Foriani G, Melchionda N. Association of nonalcoholic fatty liver disease with insulin resistance. Am J Med. 1999;15:45–455. doi: 10.1016/s0002-9343(99)00271-5. [DOI] [PubMed] [Google Scholar]
- Seppala-Lindroos A, Vehkavaara S, Hakkinen AM, Goto T, Westerbacka J, Sovijarvi A, Halavaara J, Yki-Jarvien H. Fat accumulation in the liver is associated with defects in insulin suppression of glucose production and serum free fatty acids independent of obesity in normal men. J Clin Endocr Metab. 2002;15:3023–3028. doi: 10.1210/jcem.87.7.8638. [DOI] [PubMed] [Google Scholar]
- Venturi C, Zoppini G, Zamboni C, Muggeo M. Insulin sensitivity and hepatic steatosis in obese subjects with normal glucose tolerance. Nutr Metab Cardiovas. 2004;15:200–204. doi: 10.1016/s0939-4753(04)80005-x. [DOI] [PubMed] [Google Scholar]
- Bozzetto L, Prinster A, Mancini M, Giacco R, De Natale C, Salvatore M, Riccardi, Rivellese AA, Annuzzi G. Liver fat in obesity: role of type 2 diabetes mellitus and adipose tissue distribution. Eur J of Clin Invest. 2011;15:39–44. doi: 10.1111/j.1365-2362.2010.02372.x. [DOI] [PubMed] [Google Scholar]
- Silverman JF, Obrien KF, Long S, Leggett N, Khazanie PG, Pories WJ, Norris HT, Caro JF. Liver pathology in morbidly obese patients with and without diabetes. Am J Gastroenterol. 1990;15:1349–1355. [PubMed] [Google Scholar]
- Browning JD, Szczepaniak LS, Dobbins R, Nuremberg P, Horton JD, Cohen JC, Grundy SM, Hobbs HH. Prevalence of hepatic steatosis in an urban population in the United States: impact of ethnicity. Hepatology. 2004;15:1387–1395. doi: 10.1002/hep.20466. [DOI] [PubMed] [Google Scholar]
- Browning JD, Kumar KS, Saboorian H, Thiele DL. Ethnic differences in the prevalence of cryptogenic cirrhosis. Am J Gastroenterol. 2004;15:282–291. doi: 10.1111/j.1572-0241.2004.04059.x. [DOI] [PubMed] [Google Scholar]
- Schwimmer JB, Celedon MA, Lavine JE, Salem R, Campbell N, Schork N, Shiehmorteza M, Yokoo T, Chavez A, Middleton M, Sirlin C. Heritability of nonalcoholic fatty liver disease. Gastroenterology. 2009;15:1585–1592. doi: 10.1053/j.gastro.2009.01.050. [DOI] [PMC free article] [PubMed] [Google Scholar]
- Struben VM, Hespenheide EE, Caldwell SH. Nonalcoholic steatohepatitis and cryptogenic cirrhosis within kindreds. Am J Med. 2000;15:9–13. doi: 10.1016/s0002-9343(99)00315-0. [DOI] [PubMed] [Google Scholar]
- Willner IR, Waters B, Patil SR, Reuben A, Morelli J, Riley CA. Ninety patients with nonalcoholic steatohepatitis: insulin resistance, familial tendency and severity of disease. Am J Gastroenterol. 2001;15:2957–29561. doi: 10.1111/j.1572-0241.2001.04667.x. [DOI] [PubMed] [Google Scholar]
- Kim Y, Park T. DNA microarrays to define and search for genes associated with obesity. Biotechnol J. 2010;15:99–112. doi: 10.1002/biot.200900228. [DOI] [PubMed] [Google Scholar]
- Shockley KR, Witmer DW, Bergess-Herbert SL, Paigen B, Churchill G. Effects of anthrogenic diet on hepatic gene expression across mouse strains. Physiol Genomics. 2009;15:172–182. doi: 10.1152/physiolgenomics.90350.2008. [DOI] [PMC free article] [PubMed] [Google Scholar]
- Warden CH, Fisler JS. Comparisons of diets used in animal models of high-fat feeding. Cell Metab. 2008;15:277. doi: 10.1016/j.cmet.2008.03.014. [DOI] [PMC free article] [PubMed] [Google Scholar]
- Cheverud JM, Pletscher LS, Vaughn TT, Marshall B. Differential response to dietary fat in large (LG/J) and small (SM/J) inbred mouse strains. Physiol Genomics. 1999;15:33–39. doi: 10.1152/physiolgenomics.1999.1.1.33. [DOI] [PubMed] [Google Scholar]
- Ehrich T, Kenney J, Vaughn TT, Pletscher LS, Cheverud JM. Diet, obesity and hyperglycemia in LG/J and SM/J mice. Obes Res. 2003;15:1400–1410. doi: 10.1038/oby.2003.189. [DOI] [PubMed] [Google Scholar]
- Cheverud JM, Ehrich TH, Hrbek T, Kenney JP, Pletscher LS, Semenkovich CF. Quantitative trait loci for obesity- and diabetes-related traits and their dietary responses to high-fat feeding in LGXSM recombinant inbred mouse strains. Diabetes. 2004;15:3328–3336. doi: 10.2337/diabetes.53.12.3328. [DOI] [PubMed] [Google Scholar]
- Cheverud JM, Vaughn TT, Pletscher S, Peripato A, Adams ES, Erikson CF, King-Ellison KJ. Genetic architecture of adiposity in the cross of LG/J and SM/J inbred mice. Mamm Genome. 2001;15:3–12. doi: 10.1007/s003350010218. [DOI] [PubMed] [Google Scholar]
- Cheverud JM, Lawson HA, Faucett GL, Wang B, Pletscher LS, Fox AR, Maxwell TJ, Ehrich TH, Kenney-Hunt JP, Wolf JB, Semenkovich CF. Diet-dependent genetic and genomic imprinting effects on obesity in mice. Obesity. 2011;15:160–170. doi: 10.1038/oby.2010.141. [DOI] [PMC free article] [PubMed] [Google Scholar]
- Fawcett GL, Roseman CC, Jarvis JP, Wang B, Wolf JB, Cheverud JM. Genetic architecture of adiposity and organ weight using combined generation QTL analysis. Obesity. 2008;15:1861–1868. doi: 10.1038/oby.2008.300. [DOI] [PubMed] [Google Scholar]
- Fawcett GL, Jarvis JP, Roseman CC, Wang B, Wolf JB, Cheverud JM. Fine-mapping of Obesity-related quantitative trait loci in an F-9/10 advanced intercross line. Obesity. 2010;15:1383–1392. doi: 10.1038/oby.2009.411. [DOI] [PMC free article] [PubMed] [Google Scholar]
- Lawson HA, Lee A, Fawcett GL, Wang B, Pletscher LS, Maxwell TJ, Ehrich TH, Kenney-Hunt JP, Wolf JB, Semenkovich CF, Cheverud JM. The importance of context to the genetic architecture of diabetes-related traits is revealed in a genome-wide scan of LG/J x SM/J murine model. Mamm Genome. 2011;15:197–208. doi: 10.1007/s00335-010-9313-3. [DOI] [PMC free article] [PubMed] [Google Scholar]
- Lawson HA, Zelle KM, Fawcett GL, Wang B, Pletscher LS, Maxwell TJ, Ehrich TH, Kenney-Hunt JP, Wolf JB, Semenkovich CF, Cheverud JM. Genetic, epigenetic, and gene-by-diet interaction effect underlie variation in serum lipids in a Lg/J x Sm/J murine model. J Lipid Res. 2010;15:2976–2984. doi: 10.1194/jlr.M006957. [DOI] [PMC free article] [PubMed] [Google Scholar]
- Minkina O, Cheverud JM, Fawcett G, Semenkovich C, Kenney-Hunt JP. Quantitative trait loci affecting liver fat content in mice. Genes, Genomics, Genetics. 2012;15:1019–1025. doi: 10.1534/g3.112.003343. [DOI] [PMC free article] [PubMed] [Google Scholar]
- Lawson HA, Cady JE, Partridge C, Wolf JB, Semenkovich CF, Cheverud JM. Context-dependency of genetic effects at pleiotrophic loci associated with metabolic syndrome components: evolutionary and biomedical implications. PLOS Genetics. 2011;15:e1002256. doi: 10.1371/journal.pgen.1002256. [DOI] [PMC free article] [PubMed] [Google Scholar]
- Carmiel-Haggai M, Cederbaum A, Nieto N. A high-fat diet leads to the progression of non-alcoholic fatty liver disease in obese rats. FASEB J. 2005;15:136–138. doi: 10.1096/fj.04-2291fje. [DOI] [PubMed] [Google Scholar]
- Day CP. Genes or environment to determine alcohol liver disease and non-alcoholic fatty liver disease. Liver Int. 2006;15:1021–1028. doi: 10.1111/j.1478-3231.2006.01323.x. [DOI] [PubMed] [Google Scholar]
- Matsunami T, Sato Y, Ariga S, Sato T, Kashimura H, Hasegawa Y, Yukawa M. Regulation of oxidative stress and inflammation by hepatic adiponectin receptor 2 in an animal model of nonalcoholic steatohepatitis. Int J Clin Exp Pathol. 2010;15:472–481. [PMC free article] [PubMed] [Google Scholar]
- Monteiro R, Azevedo I. Chronic inflammation in obesity and the metabolic syndrome. Mediators Inflamm. 2010;15:289645. doi: 10.1155/2010/289645. [DOI] [PMC free article] [PubMed] [Google Scholar]
- Parola M, Marra F. Adipokines and redox signaling. Impact on fatty liver disease. Antiox Redox Sign. 2011;15:461–483. doi: 10.1089/ars.2010.3848. [DOI] [PubMed] [Google Scholar]
- Wellen KE, Hotamisligil GS. Inflammation, stress, and diabetes. J Clin Invest. 2005;15:1111–1119. doi: 10.1172/JCI25102. [DOI] [PMC free article] [PubMed] [Google Scholar]
- Caspar-Bauguil S, Cousin B, Galinier A, Segafredo C, Nibbelink M, André, Casteilla L, Pénicaud. Adipose tissue as an ancestral immune organ: site specific change in obesity. FEBS Lett. 2005;15:3487–3492. doi: 10.1016/j.febslet.2005.05.031. [DOI] [PubMed] [Google Scholar]
- Li H, Lelliott C, Håkansson P, Ploj K, Tneld A, Verolin-Johansson M, Benthem, Carlsson B, Storlien L, Michaëlsson E. Intestinal, adipose, and liver inflammation in diet-induced obese mice. Metabolism. 2008;15:1704–1710. doi: 10.1016/j.metabol.2008.07.029. [DOI] [PubMed] [Google Scholar]
- Radonjic M, de Haan JR, van Erk MJ, van Dijk KW, van den Berg SAA, de Groot PJ, Müller M, van Ommen. Genome-wide mRNA expression analysis of hepatic adaptation to high-fat diets reveals switch from an inflammatory to steatotic transcriptional program. PLoS One. 2009;15:e6646. doi: 10.1371/journal.pone.0006646. [DOI] [PMC free article] [PubMed] [Google Scholar]
- Kurtz J, Wegner M, Kalbe M, Reusch TB, Schaschl H, Hasselquist D, Milinski M. MHC genes and oxidative stress in sticklebacks: an immuno-ecological approach. Proc R Soc B. 2006;15:1407–141. doi: 10.1098/rspb.2005.3450. [DOI] [PMC free article] [PubMed] [Google Scholar]
- Tezel G, Yang X, Luo C, Peng Y, Sun S, Sun D. Oxidative stress-stimulated antigen presentation by the retina and optic nerve head glia. Invest Ophthalmol Vis Sci. 2007;15:705–714. doi: 10.1167/iovs.06-0810. [DOI] [PMC free article] [PubMed] [Google Scholar]
- Vergnes L, Phan J, Strauss M, Tafuri S, Reue K. Cholesterol and cholate components of an antherogenic diet induce distinct stages of hepatic inflammatory gene expression. J Biol Chem. 2003;15:42774–42784. doi: 10.1074/jbc.M306022200. 44. [DOI] [PubMed] [Google Scholar]
- Chaparro M, Sanz-Cameno P, Trapero-Marugán M, García-Bucy L, Moreno-Otero R. Mechanisms of angiogenesis in chronic inflammatory liver disease. Ann Hepatol. 2007;15:208–213. [PubMed] [Google Scholar]
- Fernández M, Semela D, Bruix J, Colle I, Pinzani M, Bosch J. Angiogenesis in liver disease. J Hepatol. 2009;15:604–620. doi: 10.1016/j.jhep.2008.12.011. [DOI] [PubMed] [Google Scholar]
- Liu F, Smith J, Zhang Z, Cole R, Herron BJ. Genetic heterogeneity of skin microvasculature. Dev Biol. 2010;15:480–489. doi: 10.1016/j.ydbio.2010.02.003. [DOI] [PMC free article] [PubMed] [Google Scholar]
- Schaller M, Parsons J. Focal adhesion kinase and associated proteins. Curr Opin Cell Biol. 1994;15:705–710. doi: 10.1016/0955-0674(94)90097-3. [DOI] [PubMed] [Google Scholar]
- Turner CE. Paxillin: a cytoskeletal target for tyrosine kinases. Bioassays. 1994;15:47–52. doi: 10.1002/bies.950160107. [DOI] [PubMed] [Google Scholar]
- Turner CE. Paxillin interactions. J Cell Sci. 2000;15:4139–4140. doi: 10.1242/jcs.113.23.4139. [DOI] [PubMed] [Google Scholar]
- Kliewer SA, Xu HE, Lambert MH, Willson TM. Peroxisome proliferator-activated receptors: from genes to physiology. Recent Prog Horm Res. 2001;15:239–263. doi: 10.1210/rp.56.1.239. [DOI] [PubMed] [Google Scholar]
- Moller DE, Berger JP. Role of PPARs in the regulation of obesity-related insulin sensitivity and inflammation. Int J Obes Relat Metab Disord. 2003;15:S17–S21. doi: 10.1038/sj.ijo.0802494. [DOI] [PubMed] [Google Scholar]
- Vidal-Puig A, Jimenez-Liñan M, Lowell B, Hamann A, Hu E, Spiegelman B, Flier J, Moller D. Regulation of PPARγ gene expression by nutrition and obesity in rodents. J Clin Invest. 1996;15:2553–2561. doi: 10.1172/JCI118703. [DOI] [PMC free article] [PubMed] [Google Scholar]
- Kumar KG, Trevaskis JL, Lam DD, Sutton GM, Koza RA, Chouljenko VN, Kousoulas KG, Rogers PM, Kesterson RA, Thearle M, Ferrante AW Jr, Mynatt RL, Burris TP, Dong JZ, Halem HA, Culler MD, Heisler LK, Stephens JM, Butler AA. Identification of adropin as a secreted factor linking dietary macronutrient intake with energy homeostasis and lipid metabolism. Cell Metab. 2008;15:468–481. doi: 10.1016/j.cmet.2008.10.011. [DOI] [PMC free article] [PubMed] [Google Scholar]
- Lyly A, Marjavaara SK, Kyttälä A, Uusi-Rauva K, Luiro K, Kopra O, Martinez LO, Tanhuanpää K, Kalkkinen N, Suomalainen A, Jauhiainen M, Jalanko A. Deficiency of the INCL protein Ppt1 results in changes in ectopic F1-ATP synthase and altered cholesterol metabolism. Hum Mol Genet. 2008;15:1406–1417. doi: 10.1093/hmg/ddn028. [DOI] [PubMed] [Google Scholar]
- Goel R, Boylan B, Gruman L, Newman PJ, North PE, Newman DK. The proinflammatory phenotype of PECAM-1 deficient mice results in atherogenic diet-inducted steatohepatitis. Am M Physiol-Gastr L. 2007;15:G1205–G1214. doi: 10.1152/ajpgi.00157.2007. [DOI] [PubMed] [Google Scholar]
- Zhou Z, Yon Toh S, Chen Z, Guo K, Ng CP, Ponniah S, Lin SC, Hong W, Li P. Cidea-deficient mice have lean phenotype and are resistant to obesity. Nat Genet. 2003;15:49–56. doi: 10.1038/ng1225. [DOI] [PubMed] [Google Scholar]
- Puri V, Ranjit S, Konda S, Nicoloro SMC, Straubhaar J, Chawia A, Chouinard M, Lin C, Burkart A, Corvera S, Perugini RA, Czech MP. Cidea is associated with lipid droplets and insulin sensitivity in humans. Proc Natl Acad Sci U S A. 2008;15:7833–7836. doi: 10.1073/pnas.0802063105. [DOI] [PMC free article] [PubMed] [Google Scholar]
- Gatti DM, Zhao N, Chesler EJ, Bradford BU, Shabalin AA, Yordanova R, Lu L, Rusyn I. Sex-specific gene expression in the BXD mouse liver. Physiol Genomics. 2010;15:456–468. doi: 10.1152/physiolgenomics.00110.2009. [DOI] [PMC free article] [PubMed] [Google Scholar]
- Du P, Kibbe WA, Lin SM. Lumi: a pipeline for processing Illumina microarray. Bioinformatics. 2008;15:1547–1548. doi: 10.1093/bioinformatics/btn224. [DOI] [PubMed] [Google Scholar]
- Lin SM, Du P, Huber W, Kibbe WA. Model-based variance-stabilizing transformation for Illumina microarray data. Nucleic Acids Res. 2008;15:e11. doi: 10.1093/nar/gkm1075. [DOI] [PMC free article] [PubMed] [Google Scholar]
Associated Data
This section collects any data citations, data availability statements, or supplementary materials included in this article.
Supplementary Materials
Gene transcripts that are significantly different between SM/J and LG/J lines.
Gene transcripts that are significantly different between females and males.
Gene transcripts that are significantly different between diets.
Biological and biochemical processes enriched by genes exhibiting higher expression in either SM/J or LG/J.
Biological and biochemical processes enriched by genes exhibiting higher expression in either females or males.
Biological and biochemical process enriched by genes exhibiting higher expression with either low-fat or high-fat diets.
Genes that exhibited a significant diet-by-strain interaction.
Biological and biochemical process enriched by genes from cluster 1 and cluster 2.
Gene transcripts displaying differential expression with diet in SM/J.
Gene transcripts differentially expressed between the sexes in LG/J.